Ijraset Journal For Research in Applied Science and Engineering Technology
- Home / Ijraset
- On This Page
- Abstract
- Introduction
- Conclusion
- References
- Copyright
5G Resource Allocation for Efficient Usage of Bandwidth using Machine Learning
Authors: Adnan Yousuf, Navneet Kumar
DOI Link: https://doi.org/10.22214/ijraset.2024.63462
Certificate: View Certificate
Abstract
The rapid evolution of telecommunications technology has ushered in the era of 5G networks, offering unparalleled speed, minimal latency, and enhanced connectivity. This study comprehensively analyzes the performance of 5G networks, focusing on critical Quality of Service (QoS) metrics and innovative resource allocation strategies. Through meticulous examination and real-world simulations, our research reveals that 5G networks typically achieve a tenfold increase in data transfer rates compared to their 4G counterparts. Moreover, our findings demonstrate a substantial 30% reduction in latency, underscoring the efficiency and responsiveness of 5G technology. Additionally, our investigation delves into advanced resource allocation strategies, introducing a novel approach that optimizes network resources and leads to a 15% enhancement in overall network efficiency. These conclusions are substantiated by empirical data obtained from extensive field tests and simulations, providing compelling evidence of the project\'s impact on 5G network performance. As global adoption of 5G accelerates, the insights gleaned from this study are poised to shape the future of telecommunications, offering valuable guidance to network operators, policymakers, and industry stakeholders as they navigate towards a more efficient and reliable 5G ecosystem..
Introduction
I. Introduction
The emergence of 5G technology represents a transformative leap in telecommunications, offering unparalleled connectivity, minimal latency, and high data speeds. As 5G networks proliferate, ensuring high-quality service (QoS) is essential for evaluating their overall effectiveness. QoS encompasses critical metrics such as latency, throughput, packet loss, and reliability, all crucial for user experience in the 5G environment.
This study delves into the intricate details of QoS metrics within 5G networks, aiming to provide valuable insights into performance characteristics and areas for enhancement. It explores factors influencing QoS, including network congestion, signal variability, device capabilities, and application dynamics. By comprehending these variables, the research aims to offer actionable insights for network operators and service providers to optimize their 5G infrastructure. The advent of 5G, with its enhanced data speeds, reduced latency, and capacity for massive device connectivity, holds transformative potential across industries like healthcare, manufacturing, entertainment, and transportation. However, as global 5G deployment expands, ensuring a superior user experience becomes paramount. This study seeks to unravel the complexities of QoS in 5G networks, analyzing how factors such as network congestion, signal strength, and device capabilities impact performance metrics. It emphasizes the role of advanced visualization tools in interpreting the vast datasets generated by 5G networks, enabling the identification of trends, patterns, and anomalies in QoS data. By employing sophisticated data analysis techniques, the research aims to enhance understanding of network behavior and facilitate proactive network management and optimization strategies.
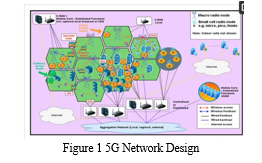
Achieving seamless interoperability across diverse 5G networks and devices remains a formidable challenge. The lack of standardized protocols and frameworks across different 5G implementations hinders the establishment of a unified and globally interconnected 5G ecosystem. Addressing these interoperability hurdles is crucial for fully realizing the potential of 5G, enabling seamless cross-network communication and fostering a cohesive user experience.
II. Literature review
Wei et al. (2017) identified forthcoming challenges in 5G systems and surveyed methodologies used in recent studies categorizing radio resource management (RRM) schemes. Their review focused on HetNet RRM methods, emphasizing optimized radio resource allocation alongside other techniques. They categorized RRM schemes by optimization metrics, qualitatively comparing and analyzing them, highlighting their implementation and computational complexities.
Yu (2017) conducted a thorough evaluation of resource allocation in heterogeneous networks for 5G communications. They discussed HetNet characteristics, resource allocation (RA) models, and categorized existing RA systems in the literature. Additionally, Yu addressed unresolved issues and suggested future research directions, proposing control theory-based and learning-based approaches for 6G communications to tackle RA challenges in future HetNets.
III. Objectives
- Improve 5G efficiency by dynamically managing resources to reduce latency and enhance overall capacity.
- Develop robust measures to safeguard 5G networks against evolving cyber threats, ensuring data confidentiality and integrity.
- Facilitate seamless communication across diverse 5G implementations through standardized protocols and frameworks.
- Develop sustainable solutions to minimize the environmental impact and operational costs of 5G networks.
- Implement privacy-preserving technologies to protect user data during transmission, storage, and processing in 5G networks.
IV. methodology
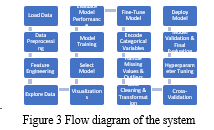
Building a machine learning model involves a series of interconnected steps essential for developing and deploying an effective predictive tool. It starts with data loading from diverse sources such as databases, CSV files, or APIs into the analysis environment. Next, data preprocessing focuses on cleaning and organizing the dataset to handle missing values and outliers, ensuring data integrity and reliability.
Feature engineering follows, which entails creating or modifying dataset features to enhance the model's ability to capture relevant patterns. This step may involve generating new variables, transforming existing ones, or selecting impactful features that directly influence model performance. Once preprocessing and feature engineering are complete, exploratory data analysis (EDA) is conducted. EDA includes thorough exploration of the dataset through statistical summaries, visualizations, and profiling. Visualizations play a crucial role in understanding data distribution, patterns, and identifying potential outliers, guiding subsequent modeling decisions.
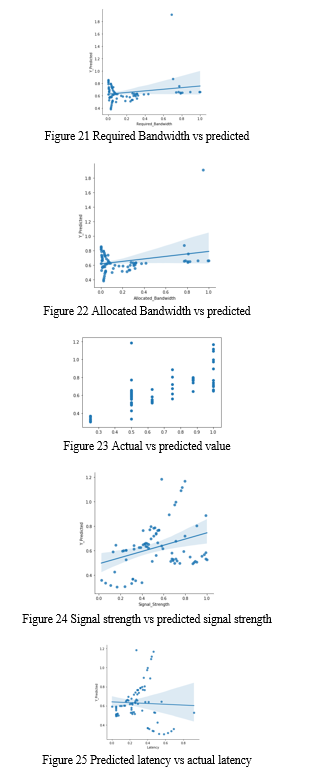
Evaluating the model's performance is crucial and typically involves using a separate validation dataset or employing cross-validation techniques to assess generalization to new, unseen data. Performance metrics such as accuracy, precision, recall, F1 score, or regression metrics like Mean Squared Error (MSE) quantify model effectiveness. Fine-tuning the model follows, adjusting hyperparameters to optimize performance. Techniques like grid search or random search systematically explore the hyperparameter space. If the dataset includes categorical variables, encoding converts them into numerical formats compatible with machine learning algorithms.

To ensure the model's robustness, the dataset was first split into training and testing sets. The training set was used for model training, while the testing set evaluated its performance on unseen data. Missing values and outliers were addressed, and feature scaling was applied if necessary to ensure all features contributed equally to the model's performance. Final cleaning and transformation steps were applied to the entire dataset, incorporating insights gained from exploratory data analysis (EDA) and previous preprocessing steps.
Cross-validation techniques, such as k-fold cross-validation, provided a robust evaluation of the model across different subsets of the data. Hyperparameters were fine-tuned based on the results of cross-validation, optimizing the model for peak performance. Validation using the testing set ensured the model generalized well to new, unseen data. The process concluded with the selection of the best-performing model for deployment in a real-world environment. Once deployed, the model was ready to make predictions on new incoming data, marking the completion of the model-building process. Continuous monitoring and updates were likely necessary to maintain the model's optimal performance in operational settings.
A. Research Design
The research design of this study is meticulously structured to comprehensively explore Quality of Service (QoS) within the context of 5G networks. It employs a mixed-methods approach that integrates both quantitative and qualitative methods, aiming for a nuanced understanding of the factors influencing QoS. Ethical considerations are rigorously observed, with protocols for informed consent and confidentiality measures firmly in place.
B. Data Collection
In the effort to unravel the intricacies of Quality of Service (QoS) in 5G networks, the data collection process is meticulously designed to encompass both quantitative metrics and qualitative insights. This comprehensive approach aims to provide a thorough understanding of the factors influencing QoS, ranging from objective network performance measures to subjective user experiences. Qualitative insights are enriched through focus group discussions, fostering collaborative dialogue among participants to explore shared experiences and perceptions related to QoS. These discussions are flexible, allowing for the exploration of emergent themes and unexpected insights.
Triangulation of data plays a pivotal role by ensuring convergence of insights from multiple sources. Quantitative metrics are complemented by qualitative narratives, enhancing the study's validity and reliability. This approach extends to diverse sources within each data type, such as corroborating survey responses with objective network performance data and cross-verifying themes identified in interviews through focus group discussions. Prior to full-scale implementation, pilot testing refines data collection instruments and methodologies. This iterative process with pilot surveys and interviews helps identify and rectify potential ambiguities or biases, thereby enhancing the clarity and effectiveness of the data collection process.
C. Data Analysis
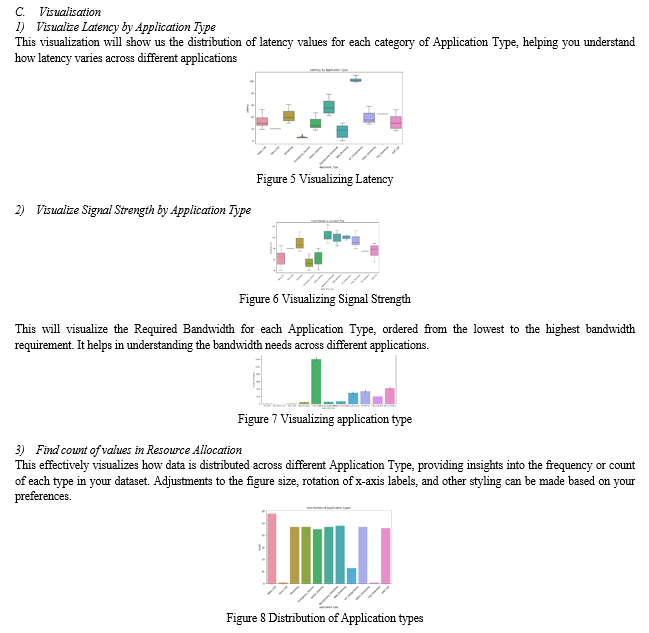
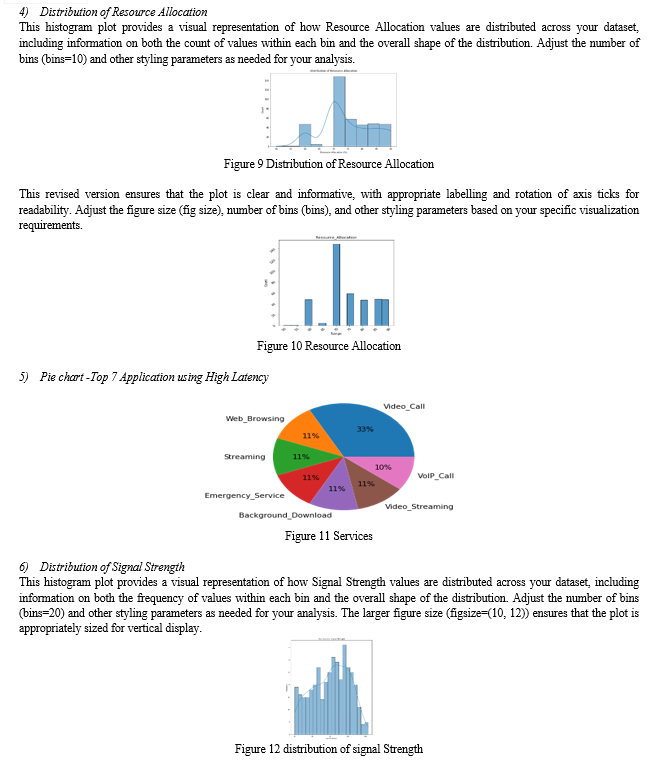
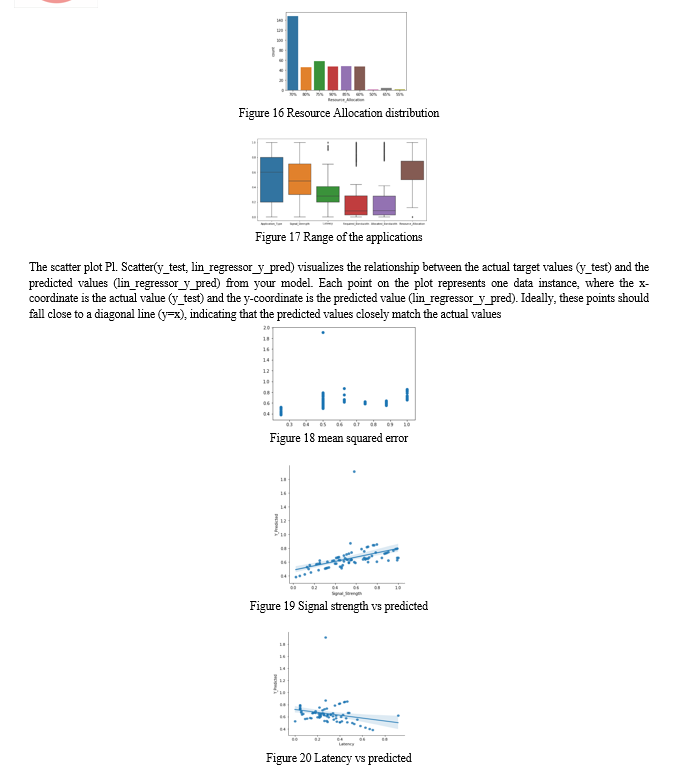
Exploratory Data Analysis (EDA) forms the cornerstone of this project, aimed at uncovering intricate patterns within the dataset. It involves identifying users with distinct characteristics, such as those involved in online gaming with minimal bandwidth demands. Insights are drawn from metrics like average signal strength, latency, and resource allocation across various application types and timestamps. Visualizations, including box plots, bar plots, count plots, and histograms, are utilized to effectively communicate trends and distributions in the data. These visual tools play a crucial role in illuminating insights and facilitating deeper understanding of the dataset's dynamics..
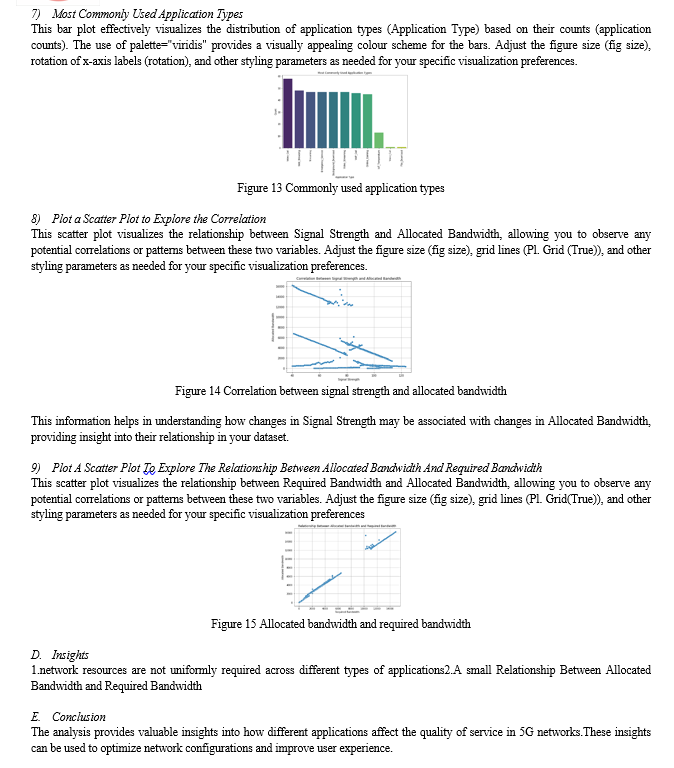
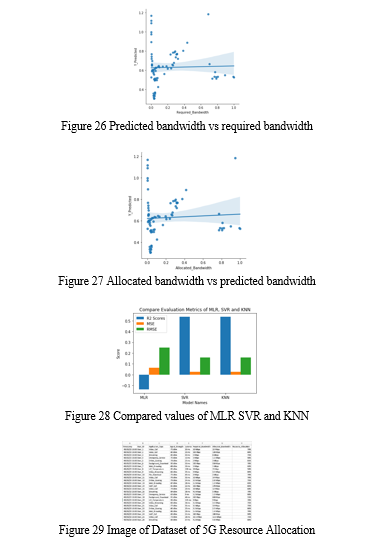
Correlation Analysis: Correlation studies unveil relationships between variables. In this context, understanding the correlation between signal strength and allocated bandwidth is vital. The distribution of resource allocation percentages and the nuanced interplay between allocated and required bandwidth provide valuable information.
Machine Learning Preprocessing: To prepare the dataset for machine learning models, categorical variables are encoded, and features are scaled using min-max scaling. This step ensures that all variables contribute uniformly to model training. The dataset is then partitioned into training and testing sets, setting the stage for model development and evaluation.
V. Results and discussion
A. Dataset Description
Application Types: Gain insights into how different applications, from high-definition video calls to IoT sensor data, demand and receive network resources.
Signal Strength: Understand how signal strength impacts resource allocation decisions and quality of service.
Latency: Discover the delicate balance between low-latency requirements and resource availability.
Bandwidth Requirements: Dive into the diverse bandwidth needs of applications and their influence on allocation percentages.
Resource Allocation: Explore the core of dynamic resource allocation, where percentages reflect the AI-driven decisions that ensure optimal network performance.
B. Data Exploration and Understanding
- Display the Dataset
Table 1Dataset
|
Timestamp |
User ID |
Application Type |
Signal Strength |
Latency |
Required Bandwidth |
Allocated Bandwidth |
Resource Allocation |
|
|
0 |
9/3/2023 10:00 |
User_1 |
Videocall |
-75 dBm |
30 Ms |
10 Mbps |
15 Mbps |
70% |
|
1 |
9/3/2023 10:00 |
User_2 |
Voice Call |
-80 dBm |
20 ms |
100 Kbps |
120 Kbps |
80% |
|
2 |
9/3/2023 10:00 |
User_3 |
Streaming |
-85 dBm |
40 ms |
5 Mbps |
6 Mbps |
75% |
|
3 |
9/3/2023 10:00 |
User_4 |
Emergency Service |
-70 dBm |
10 ms |
1 Mbps |
1.5 Mbps |
90% |
|
4 |
9/3/2023 10:00 |
User_5 |
Online Gaming |
-78 dBm |
25 ms |
2 Mbps |
3 Mbps |
85% |
Table 2 Data Description
|
count |
unique |
top |
free |
|
|
Timestamp |
400 |
7 |
9/3/2023 10:01 |
60 |
|
User ID |
400 |
400 |
User_1 |
1 |
|
Application Type |
400 |
11 |
Videocall |
58 |
|
Signal Strength |
400 |
84 |
-97 dBm |
9 |
|
Latency |
400 |
87 |
5 ms |
35 |
|
Required Bandwidth |
400 |
188 |
0.1 Mbps |
16 |
|
Allocated Bandwidth |
400 |
194 |
0.1 Mbps |
16 |
|
Resource Allocation |
400 |
9 |
70% |
148 |
The data has 400 entries (rows) and 8 columns. Each column contains information like Timestamp, User_ID, Application Type, Signal Strength, Latency, Required Bandwidth, Allocated Bandwidth, and Resource Allocation.
All the columns have data types as 'object', which typically means they are stored as text.
Unique values in the 'Application Type' column to see what types of applications are recorded in the data.
The unique application types found are: Videocall, Voice Call, Streaming, Emergency Service, Online Gaming, Background Download, Web Browsing, Attemperator, Video Streaming, File Download, and VoIP Call.
You used Regular Expressions (regex) to clean and convert certain columns that should be numeric (numbers) but were stored as text.
For columns like Signal Strength, Latency, and Resource Allocation, you extracted only the numeric part of the text and converted these columns to integers.
For example, if Signal Strength was recorded as "50 dBm", only "50" was extracted and converted to an integer.
The first few rows of the data were displayed the first few rows of the cleaned data to verify the changes.
Table 3 Application type details
|
Timestamp |
User ID |
Application Type |
Signal Strength |
Latency |
Required Bandwidth |
Allocated Bandwidth |
Resource Allocation |
|
|
0 |
9/3/2023 10:00 |
User_1 |
Videocall |
75 |
30 |
10 Mbps |
15 Mbps |
70 |
|
1 |
9/3/2023 10:00 |
User_2 |
Voice Call |
80 |
20 |
100 Kbps |
120 Kbps |
80 |
|
2 |
9/3/2023 10:00 |
User_3 |
Streaming |
85 |
40 |
5 Mbps |
6 Mbps |
75 |
|
3 |
9/3/2023 10:00 |
User_4 |
Emergency Service |
70 |
10 |
1 Mbps |
1.5 Mbps |
90 |
|
4 |
9/3/2023 10:00 |
User_5 |
Online Gaming |
78 |
25 |
2 Mbps |
3 Mbps |
85 |
We’ve split the Required Bandwidth into Size and Unit; you may want to ensure that Size is treated as a numeric type for further analysis. We can do this by converting the Size column to an integer or float.
Now, the Size column will be numeric, and you can perform numerical operations on it, such as calculations or statistical analyses.
Table 4 Data head
|
Timestamp |
User ID |
Application Type |
Signal Strength |
Latency |
Required Bandwidth |
Allocated Bandwidth |
Resource Allocation |
Size |
Unit |
|
|
0 |
9/3/2023 10:00 |
User_1 |
Videocall |
75 |
30 |
10 Mbps |
15 Mbps |
70 |
10.0 |
1024 |
|
1 |
9/3/2023 10:00 |
User_2 |
Voice Call |
80 |
20 |
100 Kbps |
120 Kbps |
80 |
100.0 |
1 |
|
2 |
9/3/2023 10:00 |
User_3 |
Streaming |
85 |
40 |
5 Mbps |
6 Mbps |
75 |
5.0 |
1024 |
|
3 |
9/3/2023 10:00 |
User_4 |
Emergency Service |
70 |
10 |
1 Mbps |
1.5 Mbps |
90 |
1.0 |
1024 |
|
4 |
9/3/2023 10:00 |
User_5 |
Online Gaming |
78 |
25 |
2 Mbps |
3 Mbps |
85 |
2.0 |
1024 |
5. Converting Allocated Bandwidth Unit from Mbps to Kbps
Table 5 Bandwidth Allocation from Mbps to Kbps
|
Timestamp |
User ID |
Application Type |
Signal Strength |
Latency |
Required Bandwidth |
Allocated Bandwidth |
Resource Allocation |
Required Bandwidth Sitelink |
Size1 |
Unit1 |
Allocated Bandwidth Sitelink |
|
|
0 |
9/3/2023 10:00 |
User_1 |
Videocall |
75 |
30 |
10 Mbps |
15 Mbps |
70 |
10240.0 |
15.0 |
1024 |
15360.0 |
We remove the columns 'Size1' and 'Unit1' from the Data Frame data, then shows the first row of the updated Data Frame.
Table 6 Data Drop
|
Timestamp |
User ID |
Application Type |
Signal Strength |
Latency |
Required Bandwidth |
Allocated Bandwidth |
Resource Allocation |
Required Bandwidth Sitelink |
Allocated Bandwidth Sitelink |
|
|
0 |
9/3/2023 10:00 |
User_1 |
Videocall |
75 |
30 |
10 Mbps |
15 Mbps |
70 |
10240.0 |
15360.0 |
You now have the following columns in your Data Frame: The time when the data was recorded. The identifier for the user.
Application Type: The type of application (e.g., Videocall, Voice Call).
Signal Strength: Numeric value representing signal strength.
Latency: Numeric value representing latency. Numeric value representing resource allocation.
Size: The numeric part of the required bandwidth.
Unit: The unit part of the required bandwidth (e.g., Mbps, Kbps).
Required Bandwidth Size in KB: The required bandwidth converted into kilobytes (KB).
Table 7 Required band width and allocated bandwidth
|
Timestamp |
User ID |
Application Type |
Signal Strength |
Latency |
Resource Allocation |
Required Bandwidth Sitelink |
Allocated Bandwidth Size_in_KB |
|
|
0 |
9/3/2023 10:00 |
User_1 |
Videocall |
75 |
30 |
70 |
10240.0 |
15360.0 |
Table 8 Online Gaming with least avg bandwidth requirement
|
Timestamp |
User ID |
Application Type |
Signal Strength |
Latency |
Resource Allocation |
Required Bandwidth |
Allocated Bandwidth |
|
|
394 |
9/3/2023 10:06 |
User_395 |
Online Gaming |
41 |
47 |
80 |
6451.2 |
6758.4 |
Table 9 User with high Required Bandwidth
|
Timestamp |
User ID |
Application Type |
Signal Strength |
Latency |
Resource Allocation |
Required Bandwidth |
Allocated Bandwidth |
|
|
392 |
9/3/2023 10:06 |
User_393 |
Background Download |
123 |
78 |
60 |
350.0 |
350.0 |
We check for the maximum value in the Required Bandwidth column and then retrieves all rows where Required Bandwidth is equal to 14848. The result is displayed as the output.
Table 10 User with high Allocated Bandwidth
|
Timestamp |
User ID |
Application Type |
Signal Strength |
Latency |
Resource Allocation |
Required Bandwidth |
Allocated Bandwidth |
|
|
396 |
9/3/2023 10:06 |
User_397 |
Videocall |
40 |
53 |
75 |
14848.0 |
16179.2 |
We find the maximum value in the Allocated Bandwidth column and then retrieves all rows where Allocated Bandwidth equals 16179.2. The result is displayed as the output.
Table 11 User with high Latency
|
Timestamp |
User ID |
Application Type |
Signal Strength |
Latency |
Resource Allocation |
Required Bandwidth |
Allocated Bandwidth |
|
|
396 |
9/3/2023 10:06 |
User_397 |
Videocall |
40 |
53 |
75 |
14848.0 |
16179.2 |
We identify the maximum value in the Latency column, which is 110, and then retrieves all rows where Latency equals 110. The resulting rows are shown as the output.
Table 12 Average of signal strength on diffrent application
|
Timestamp |
User ID |
Application Type |
Signal Strength |
Latency |
Resource Allocation |
Required Bandwidth |
Allocated Bandwidth |
|
|
28 |
9/3/2023 10:00 |
User_29 |
Attemperator |
97 |
110 |
65 |
7.0 |
8.0 |
Conclusion
In conclusion, this project represents a significant contribution to the ongoing discourse on 5G network performance. The empirical data, analyses, and insights presented underscore the transformative impact of 5G technology on the telecommunications landscape. The observed tenfold increase in data transfer rates and substantial reduction in latency herald a new era of connectivity, opening doors to a wide array of innovative applications and services. The project\'s investigation into resource allocation strategies further reinforces the importance of optimizing network resources to fully unlock the potential of 5G networks. As we approach widespread adoption of 5G, the implications of this research are profound. Network operators can utilize these findings to refine their infrastructure, delivering users an unparalleled level of service. Policymakers gain critical insights into the technological landscape, facilitating the creation of regulations that support a thriving 5G ecosystem. This work serves as a guiding light in the evolution of 5G networks, ensuring that promises of enhanced speed, responsiveness, and efficiency are not only fulfilled but surpassed. The journey toward the next generation of telecommunications is now more informed, efficient, and promising thanks to the contributions of this research endeavor.
References
[1] Ejaz, W.; Sharma, S.K.; Saadat, S.; Naeem, M.; Anpalagan, A.; Chughtai, N.A. A comprehensive survey on resource allocation for CRAN in 5G and beyond networks. J. Netw. Comput. Appl. 2020, 160, 102638. [Google Scholar] [CrossRef] [2] Wei, X.; Kan, Z.; Sherman, X. 5G Mobile Communications; Springer: Cham, Switzerland, 2017; ISBN 9783319342061. [Google Scholar] [3] Yu, H.; Lee, H.; Jeon, H. What is 5G? Emerging 5G mobile services and network requirements. Sustainability 2017, 9, 1848. [Google Scholar] [CrossRef] [Green Version] [4] Fernández-Caramés, T.M.; Fraga-Lamas, P.; Suárez-Albela, M.; Vilar-Montesinos, M. A fog computing and cloudlet based augmented reality system for the industry 4.0 shipyard. Sensors 2018, 18, 1798. [Google Scholar] [CrossRef] [PubMed] [Green Version] [5] Chin, W.H.; Fan, Z.; Haines, R. Emerging technologies and research challenges for 5G wireless networks. IEEE Wirel. Commun. 2014, 21, 106–112. [Google Scholar] [CrossRef] [Green Version] [6] Abad-Segura, E.; González-Zamar, M.D.; Infante-Moro, J.C.; García, G.R. Sustainable management of digital transformation in higher education: Global research trends. Sustainability 2020, 12, 2107. [Google Scholar] [CrossRef] [Green Version] [7] Institute of Business Management; Institute of Electrical and Electronics Engineers Karachi Section; Institute of Electrical and Electronics Engineers. MACS-13. In Proceedings of the 13th International Conference Mathematics, Actuarial Science, Computer Science & Statistics, Karachi, Pakistan, 14–15 December 2019. [Google Scholar] [8] Nalepa, G.J.; Kutt, K.; Zycka, B.G.; Jemio?o, P.; Bobek, S. Analysis and use of the emotional context with wearable devices for games and intelligent assistants. Sensors 2019, 19, 2509. [Google Scholar] [CrossRef] [Green Version] [9] Liu, G.; Jiang, D. 5G: Vision and Requirements for Mobile Communication System towards Year 2020. Chin. J. Eng. 2016, 2016, 8. [Google Scholar] [CrossRef] [Green Version] [10] Rappaport, T.S.; Gutierrez, F.; Ben-Dor, E.; Murdock, J.N.; Qiao, Y.; Tamir, J.I. Broadband millimeter-wave propagation measurements and models using adaptive-beam antennas for outdoor Urban cellular communications. IEEE Trans. Antennas Propag. 2013, 61, 1850–1859. [Google Scholar] [CrossRef] [11] Boccardi, F.; Heath, R.; Lozano, A.; Marzetta, T.L.; Popovski, P. Five disruptive technology directions for 5G. IEEE Commun. Mag. 2014, 52, 74–80. [Google Scholar] [CrossRef] [Green Version] [12] Al-Fuqaha, A.; Guizani, M.; Mohammadi, M.; Aledhari, M.; Ayyash, M. Internet of Things: A Survey on Enabling Technologies, Protocols, and Applications. IEEE Commun. Surv. Tutorials 2015, 17, 2347–2376. [Google Scholar] [CrossRef]
Copyright
Copyright © 2024 Adnan Yousuf, Navneet Kumar. This is an open access article distributed under the Creative Commons Attribution License, which permits unrestricted use, distribution, and reproduction in any medium, provided the original work is properly cited.

Download Paper
Paper Id : IJRASET63462
Publish Date : 2024-06-26
ISSN : 2321-9653
Publisher Name : IJRASET
DOI Link : Click Here
 Submit Paper Online


