Ijraset Journal For Research in Applied Science and Engineering Technology
- Home / Ijraset
- On This Page
- Abstract
- Introduction
- Conclusion
- References
- Copyright
Mapping Nigeria’s Poverty with Satellite Imagery Using Deep Learning: A Comparative Study of Day and Night Light Satellite Images
Authors: Okoroafor Daniel Chukwuebuka, Zhang Diping
DOI Link: https://doi.org/10.22214/ijraset.2024.58717
Certificate: View Certificate
Abstract
Poverty mapping plays a crucial role in understanding and addressing socioeconomic disparities within a country. Traditional methods of poverty estimation often rely on survey data, which can be time consuming, expensive, and limited in coverage. In recent years, the advent of satellite imagery and deep learning techniques has opened up new avenues for poverty mapping. This study aims to compare the effectiveness of day and night light satellite imagery in mapping poverty in Nigeria using deep learning models. In this thesis, daylight satellite data is used to directly forecast poverty by evaluating Convolutional Neural Network (CNN) models. one methods semantic segmentation are put forth and contrasted with the multistep learning method that makes use of an image of nighttime lights. We conduct our experiments with satellite pictures from Google Maps and NOAA that are publicly available throughout the day and at night. Combining the night lights data with the semantic segmentation approach to yields the best model.
Introduction
I. INTRODUCTION
With so many people in Nigeria living below the poverty line, poverty is still a major problem there. To successfully target resources, politicians and NGOs need to have access to accurate and current poverty mapping. In order to compare the efficacy of daytime and nighttime satellite photos, this paper suggests mapping poverty in Nigeria using deep learning models and satellite photography. The machine learning researchers compute or quantify the economic livelihood status of daily satellite photos by using a convolutional neural network (CNN) to extract and recognize feature patterns. The residual neural network (ResNet) is a novel network design proposed by Kaiming He et al. in 2015.
A. Poverty Measurement
The World Bank Group’s mission is to end extreme poverty by 2030. In order to monitor progress and understand the types of poverty reduction way and strategies that could work, it is important to measure poverty regularly. To better understand whether the world is on a way to end extreme poverty, Poverty measurement and analysis has been a key aspect of the Bank’s mission for years. By understanding and measuring poverty, we will surely learn which poverty reduction strategies work.
B. Important Of The Research
The creation and analysis of CNN models to accurately forecast poverty from daylight satellite imagery is the aim of this thesis. Additionally, we plan to compare our models' performance with one that makes use of an image of evening lights. The National Geophysical Data Center (NOAA) and Google Static Maps API provide publicly available image data that are needed as the input model. We employ labeled training data on poverty from the socioeconomic survey conducted in Nigeria. Nigeria is a developing nation with a wide range of social, demographic, and geographic traits. According to a research published by the bank, 95 million Nigerians are living in poverty in 2022. The national poverty headcount rate rise from 40.1 percent now to 42.5 percent in 2020 and 42.9 percent in 2022 due to the effects of the crisis, meaning that there will be 95 million impoverished people in 2022.
The World Bank is fighting poverty and raising living standards for Nigerians, but it might be challenging for them to identify which states actually require assistance. Nigeria continues to lack access to the most accurate information regarding the social and economic circumstances of its citizens, including wealth assets, consumption expenditures, and health indexes. Conventional techniques for gathering this kind of information involve conducting on site surveys, which can be costly, labor intensive, and a waste of time and effort before yielding accurate results.
In Nigeria, a significant barrier to disaster relief, food security, and sustainable development is a lack of trustworthy data. It makes it difficult for them to forecast the government. In order to design targeted programs and aid, humanitarian organizations and policymakers must map out the distribution of poverty in emerging nations but by the used of the satellite image we believe it simplify the challenges of the mapping poverty and can accurately forecast Nigeria's poverty levels using day and night satellite image.
The prediction of poverty using data from this nation's satellite images has not been examined in any prior research. We use the data from this nation to reproduce the multistep learning strategy proposed by Jean et al. Next, we contrast the outcomes with the techniques we suggested. Ultimately, this research will offer perspectives on utilizing fresh datasets to assess poverty throughout Nigeria. Our goal is to determine whether models trained on data and features from satellite images from one nation can be applied to predict the quality of life in other nations' regions.
C. Principle Of Convolutional Neural Network
At first the definition of neural network is a series of algorithm which recognize in different parameter. The relationships in a set of data through the system that copy the way human brain operate. Convolutional neural network it make use of large futures in image not only that but also speech recognition as well. Because the convolutional network it forces the extraction of correlation to understand and remember the inputs. The concept of Convolutional Neural Networks (CNN) is a unique network structure discovered the study of neurons in the 1960s shows the unique features in which convolutional neural network can effectively reduce the complexity of the network. CNN can extract key features of any input data through the following convolution and pooling operations. Therefore, CNN becomes one of the greatest when it comes to receiving extensive attention and applications in the field of pattern classification. The basic structure of convolutional neural network it includes convolutional layer, pooling layer and fully connected layer. The convolutional layer mainly performs convolution operations. The methods we used are mainly local connections and weight sharing methods, mainly to simulate cells with local receptive fields in the brain, so as to extract some information from the obtained information. The pooling layer usually performs down sampling operations, which including some methods such as maximum pooling and average pooling. After the input data is down, sampled by the pooling layer, then the output data matrix will become smaller, but one thing the number remains unchanged, while the pooling layer can compress the data output from the convolutional layer of the previous layer, The number of learning parameters is reduced because of the reduction of the complexity of calculation and the problem of over fitting is prevented. In the CNN model, the main function of the last layer which is fully connected layer is to perform a weighted summation of the features extracted by the previous convolution and pooling operations to ensure that the input data is in the few data features retained after the pooling operation can reproduce the original input data as much as possible.
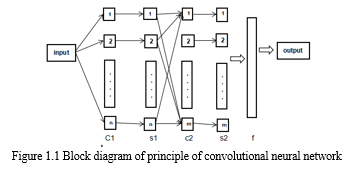
D. Convolutional Layers and Architecture
The behavior of a neural network is described by its architectonic. A convolutional neural network consists of an input and an output layer, and multiple hidden layers. The series of convolutional layers that bear with multiplication or other dot product are hidden layers of CNN. The neural network architecture is design and shaped by several numbers of neurons which are connected between layers. And in each layer it has different number of neurons, and in order to improve the model performance we used the paths connecting the neurons which contain the adaptive weights that can be turned by the algorithm. And this hidden layers are referred as the normalization layers fully connected layers and pooling layers because there input and output are marked by their active in the final convolutional.
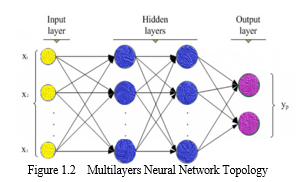
This diagram represents what is so called multi layers perceptron, and in other hand is called a neural network. As you can see the first is the input values to the input layers the order layer represents the structure of input which also called as the features. This futures are the fed for the hidden neural network, in which calculated each every values. This input layers it also consist of neurons that receive data from one layer to another and continue passing it order layers the neurons layers is equals to number of futures in the data set.as the network is trained if the outcomes are weighted enough more heavily than those nodes will be find to be more predictive. While the output layers have nodes the number is it depends upon the model type we are trying to build. so the neural network can be useful for both classification and regression models only that one node for each classification label while only single node produce value in regression. That's why this model is being widely used so many times to work on images and text data,
- Pooling Layer
In this case the use of pooling operation help in extracting the combinations of features which are the invariant to translation shifts and small distortions. The pooling function is also used to modify the output of the layers, and if the method applied to the pooling layers in order to reduce spatial size of the data it will help to control overfitting. And it uses the max operation system to reside the input data. There are different types of pooling formulation system which are the max, the average, the overlapping, the spatial pyramid pooling. The all used in the CNN pooling a compute the max or average. The maximum pooling it uses the maximum value from each of a cluster of neurons at the prior layer. Average pooling uses the average value each of the cluster of neurons at the prior layers.
2. Weight
This weight represents the strength and the energy of the connection between the units. If this weight from node 1 to node 2 has greater magnitude, it means that neuron 1 has greater influence over neuron 2. A weight brings down the importance of the input value. So the weight of connection in neural network is a numerical value which tries to rearrange everything in order to just reduce the errors. Each every matrix element in the CNN filter is one of the weights that will be trained and to that these weights will impact the extracted convoluted. Each neural network will apply function to input values by computing an output value which is coming from the layers. The functions that applied to input values are determined by the weight and bias. Neural network try to make an adjustment to this biases and weights. Because the vector of weights and the biases distinguishing feature of CNNs are that many neurons can share the same filter. and are also used across all receptive fields sharing that filter, as opposed to each receptive field having its own bias and vector weighting.
3. Regularization and Over Fitting
A model that has learn about the noise instead of learning about the signal is absolute consider to over fit because it fits the training data set but it has a poor fits with new database. And the major problems that normally occurred with learning algorithms is over fitting, it came to existing when parameters which was the best pit perform good on the training set but poorly in the testing set. Which to that make our parameter to have reflection upon the unique situation of training set, but cannot also be used for further generalization? And also the only way to get rid of it is through regularization because it presents a greater stability to the algorithm. We need to reduce over fitting and detect fitting and also improve its performance in a situation were by our model do better on training set than on the test set, there will be almost 90% chance of over fitting.
E. Transfer Learning
Transfer learning can be defined as a process whereas one models trained on a problem order to be used in some ways on a second related problems. The amount of data used to fit CNN models is one of the thing that makes the quality been determine. Better performance has hence presented itself as a result of more training data set. However so many data needed to also start it from the scratch. But to make it easy you can just find a CNN model that has been done successfully before that brings a good result and then you can re train it for another task. And the idea is by transferring the knowledge from this place to apply to our task,
F. CNN on Satellite Images
In this process the implementation of a supervised machined learning for the detection of poverty in a region. We have relied solely on satellite image in other to predict the poverty of a country. Most of the old supervise learning is not really suitable to handle a lot of satellite datasets. But classification frame work has been into existed and been introduce as a classification framework. its the combination of the neural network to detect or extract some features from the image from the sky and also stabilize the features vectors in other to classify the image land, road, cars European, buildings infrastructures, water, boats. It produces and gives a strong prediction with a strong accuracy. The Convolutional neural network itself it presents a huge break through in image recognition, The convolutional neural network is using a two stage frame work which is the image net pre-trained model and trainable convolutional neural network.
II. METHODOLOGY
The deep learning models used in this study are presented, including convolutional neural networks (CNN). The models are trained and validated using the labeled dataset, and the performance metrics are discussed. When neural networks are employed, we test our ability to identify patterns in satellite images, such as buildings, zink, roads, lights, cars, and many more. We then use these patterns to survey the area and use convolutional neural networks to forecast which areas are rich or poor. The above methodology provides a high level overview of the steps involved in building and evaluating a deep learning model for poverty prediction using convolutional and recurrent neural networks. The specific details may vary depending on the dataset, problem domain, and available resources.
- Data Gathering and Preprocessing: Detailed information on the data collection process is provided, including the acquisition of both day and night light satellite images. The preprocessing steps, such as image enhancement, normalization, and feature extraction, are described to ensure the data is suitable for deep learning analysis. We Create a labeled dataset with satellite photos taken during the day and the accompanying poverty labels.We downloaded several packages using PyCharm 2020.1, including Tensor Flow, Numpy Prompt Toolkit, Matplotlib, and many others. We upload the satellite images to our PyCharm after zipping the images of the impoverished and the non poor into separate zip files. After running and installing every package, we change the codes to identify the photographs that depict poverty.
- Gather satellite photographs of nighttime light and day time: they are representative of the same geographic areas as the images taken during the day.We downloaded 5000 images for each categories which is the poor and rich category data from Google earth were we select three state in Nigeria Abuja, Lagos, Jigawa. We used Abuja in practice to train some of the data to see how it will goes and we used Lagos for rich city and we used Jigawa for poor city and at the same time we used 10 nightligh data of each state Abuja and Jigawa,For comparable works, the baseline model has been the multistep learning technique developed by Jean et al. We also duplicate this procedure for our investigation, comparing the suggested approaches with our dataset. There are three primary steps in this procedure. Initially, we use a VGG-F CNN model that has been pre trained on ImageNet, a sizable dataset of 1000 distinct categories for image classification. Secondly, estimating the intensity of evening lights matching to input satellite data captured during the day. In order to anticipate the classes of light intensity, we approach this phase as a classification issue. we used this two state data in our work to train our models if it can identify and detect poverty in the area of the place using rich state and poor state. we access along with 300 square tiles of the daytime satellite image within 5km radius, and almost 70 square tiles of Lagos within the 3 km radius. We Make sure the daytime and nighttime light photos are preprocessed are in an appropriate format for validation and training. Resizing, standardizing pixel values, and dividing into training and validation sets are a few examples of how to do this.
- CNN Architecture: We Create a CNN architecture that works well for the tasks involving the classification of images. Multiple convolutional layers with activation functions (like ReLU), pooling layers, and fully connected layers should all be a part of this design.
- Experiment with different CNN architectures and hyperparameters to find the best performing model. This we try it through techniques like grid search or random search.
4. Model Training:
- We Train the CNN models separately using the labeled dataset.
- We Use techniques like batch normalization and dropout to prevent overfitting.
- We Optimize the models using appropriate loss functions (e.g., binary cross entropy) and optimization algorithms (e.g., Adam).
5. Model Validation:
- Validate the trained models using the validation dataset.
- We Calculate evaluation metrics such as accuracy, precision, recall, and F1 score to assess the performance of the models.
6. Comparison of Day Time and Night Light Images:
- We Use the trained models to predict poverty labels for both day time and night light images.
- Compare the predictions from the two models to understand the impact of using night light images on poverty prediction.
- We Calculate evaluation metrics for both models and compare their performance.
7. Further Analysis:
- We Conduct additional analysis to understand the factors contributing to the differences in performance between day time and night light images.
- We Explore techniques like transfer learning or ensemble methods to improve the models’ performance.
- We Investigate the interpretability of the models to gain insights into the relationship between satellite images and poverty prediction.
8. Model Deployment:
- Once satisfied with the performance of the models, deploy them in a production environment for real-time poverty prediction using day time and night light satellite images.
III. RESULTS AND ANALYSIS
The findings of the study are presented, comparing the performance of the deep learning models using day and night light satellite images. The accuracy, precision, recall, and F1-score of each model are analyzed, providing insights into the effectiveness of each approach in mapping poverty in Nigeria.
A. Daytime Satellite Imagery
Google Satellite Maps' satellite imagery serves as our models' main source of data. We cannot estimate when the maps will be updated, even though these photos are updated on a frequent basis. The data is updated around once a month, but before it is made available to the public, it must be processed, verified, and set up. Based on the date stamp marking on the map, we were able to verify that the Nigerian map was last updated in 2018. We make the assumption that there is no discernible temporal variation in the landscape features within a year because we utilize the poverty data from 2017. The Google Static Maps API is the source of the daytime satellite imagery Given the geolocation data and zoom level, we may create the high resolution photos by supplying an API key. The latitude and longitude values that represent a place's position in the real world make up the geolocation. On the other hand, Google Maps' zoom levels, which indicate the map's scale, vary from 0 to 19. The foundation of Google Maps is a 256 × 256 pixel tile system, with a 256 × 256 pixel representation of the entire planet at zoom level 0. A 128 × 128 pixel section from zoom level 0 is enlarged by a 256 × 256 tile at zoom level 1. We created random samples of the coordinate locations in every Nigeria municipality to supply inputs for the API. Figure 3.1 depicts the geographic coordinate samples within a municipality, with the municipality's border represented by the line in the figure.
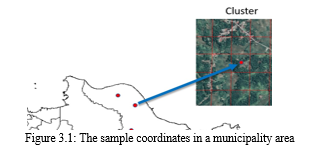
As illustrated in the figure above, we generated 10 random points for each region. Each point acts as the center of a cluster, and 25 satellite images were extracted from each cluster. Hence, each poverty data point is represented by 250 images. We set the resolution of the images 350 × 350 same as the size used by the reference study. We use the zoom level 16 (1 pixel = 2.387 meter). It means that each image covers ∼1 km in width and height. In the end, we have 12,500 images for training dataset and 6,250 images each testing dataset.
B. Nighttime Lights Image
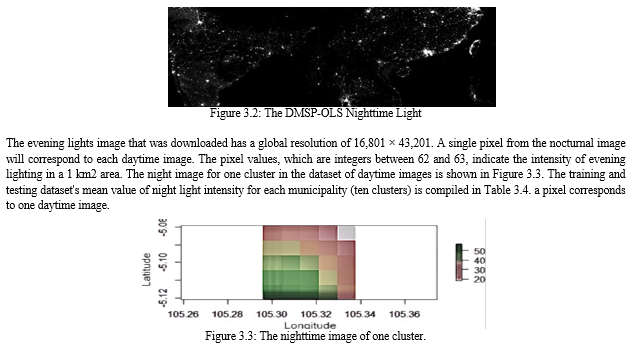
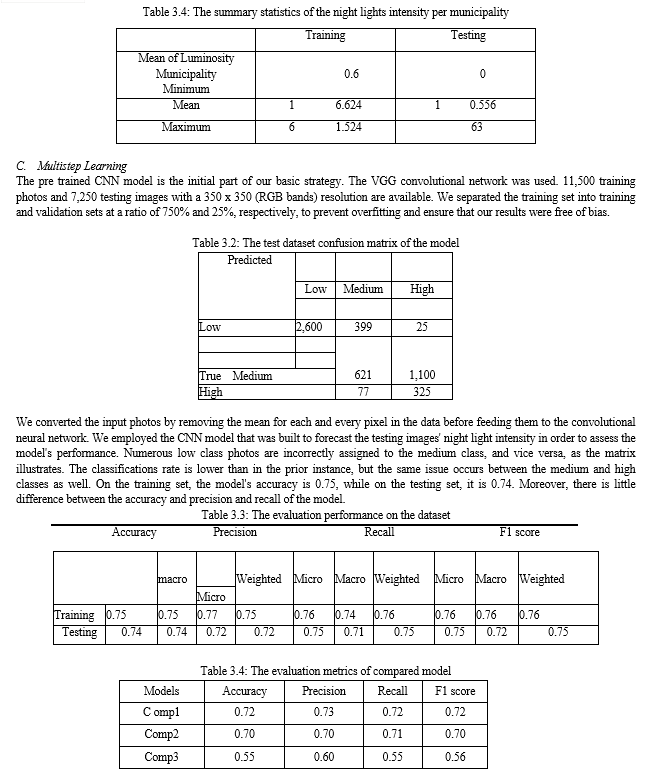
The US Air Force Weather Agency's Defense Meteorological Satellite Program (DMSP) captured the photographs of the nighttime lights. The NOAA National Centers for Environmental Information (NCEI) processed the data and created the image. The data are cloud-free composites created from every archived smooth resolution DMSP-OLS (Operational Linescan System) data set for the relevant calendar years.The 35 arc second grids that cover -180 to 180 degrees longitude and -66 to 76 degrees latitude are the products. On the NOAA website, you can get the Version 4 DMSP-OLS Nighttime Lights Time Series in GeoTIFF format for free. The 30 arc second grids that cover -170 to 170 degrees longitude and -66 to 76 degrees latitude are the products.. On the NOAA website, you can get the Version 4 DMSP-OLS Nighttime Lights Time Series in GeoTIFF format for free. Using this format, we are able to extract photos according to a location's latitude and longitude on Earth. The most recent update was in 2013, despite the fact that new data are added every year. This is the version of the evening lights image that we use. We presume that the luminance in the nighttime photographs does not change considerably across those distinct time periods because the year of data is
\

IV. DISCUSSION
The findings and their ramifications for Nigerian poverty mapping are examined. The benefits and drawbacks of utilizing satellite photos taken during the day and at night are discussed, along with any potential biases and difficulties related to either method.The convolutional neural network model used satellite imagery, both during the day and at night, to make predictions based on geographic features like position In contrast to survey data, which was based on house to house surveys, nighttime light depends on the intensity or brightening of the night sky, terrain, infrastructures, buildings, cars, and other mostly physical qualities. The program produced an exact prediction with 100% accuracy, differentiating between two states in Nigeria based on how impoverished they are.
Conclusion
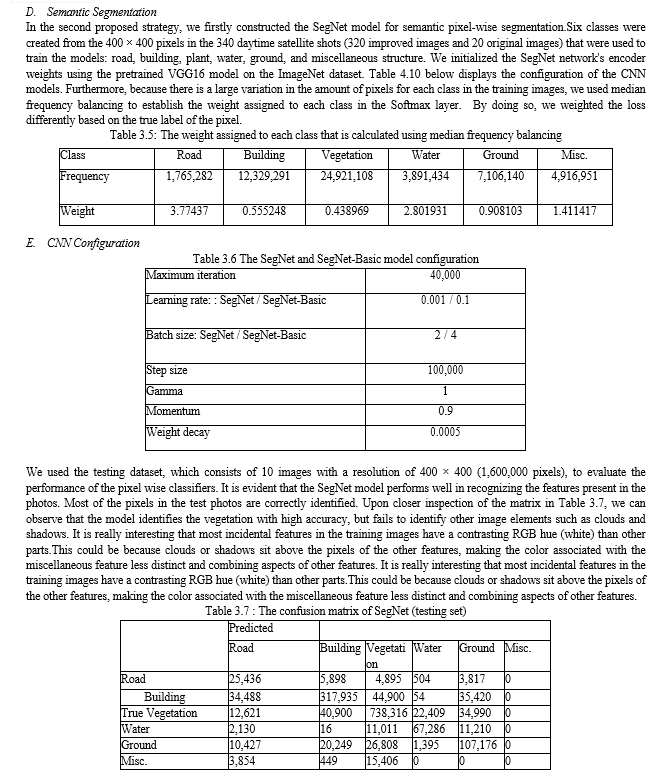
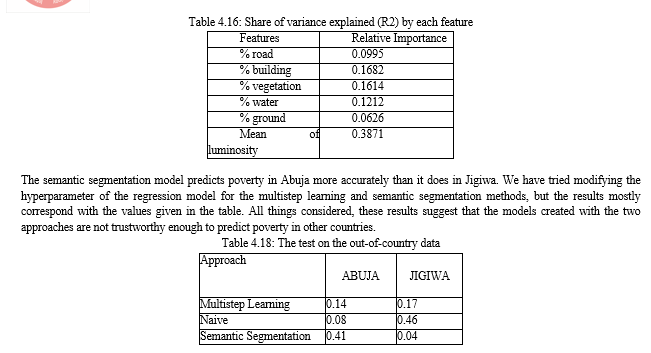
This paper concludes by summarizing the key findings and implications of the study. It highlights the potential of deep learning models and satellite imagery in poverty mapping and suggests future research directions to improve the accuracy and applicability of such models. Convolutional Neural Networks offer a powerful tool for predicting poverty levels using night and daylight satellite images. By leveraging the capabilities of CNNs, governments and organizations can make informed decisions and allocate resources more effectively. However, it is crucial to address challenges related to data availability, labeling, and interpretability to ensure accurate and reliable predictions. We have covered and contrasted multistep learning, and semantic segmentation methods in the earlier chapters in order to forecast poverty in a given area. We compared the effectiveness of using night lights as a stand in for poverty estimation in multistep learning with the direct use of daylight satellite data in the semantic segmentation approaches. Furthermore, we evaluated if the satellite picture captured during the day had greater relevance to poverty than the image of the lights at night. We conducted experiments using openly accessible satellite imagery from NOAA and Google Maps. Several convolution networks, including VGG F, Resnet10 were used to analyze the photos. To create the models, we also used a transfer learning technique. To initialize the weights of our CNNs, we used CNN models that had already been trained on the ImageNet dataset. According to this study, the multistep learning strategy generally yields worse results than the semantic segmentation approach. In the multistep learning, the landscape elements such as the ground, road, building, flora, and water appears to be more predictive than the high level image data that the CNN model extracted. Together, those landscape elements account for 50% of the variance in the log poverty line. It outperforms the multistep learning outcome, which is 47 percent. Additionally, this method has the benefit of being simple, with only five features in the model. The pretrained model\'s fine tuning was effective because it was able to raise our models\' performance. This finding validates the notion that satellite image processing can begin with the visual filters from generic images, like ImageNet.According to this study, the multistep learning strategy generally yields worse results than the semantic segmentation approach. When using multistep learning, the landscape elements such as roads, buildings, flora, water, and ground seem to be more predictive than the high level image features that the CNN model extracted. Surprisingly, the performance of the night lights model is almost identical to that of the multistep learning. Poverty can be explained by the night lighting variable alone in 44% of cases. Our trials\' best model, which gets a 55 percent R2 value, was created by fusing the night lights data with the semantic segmentation approach. In summary, CNNs provide an innovative approach to poverty prediction, leveraging the rich information contained in night and daylight satellite images. As technology advances and more data becomes available, CNNs have the potential to significantly contribute to poverty alleviation efforts worldwide.
References
[1] Jean, N., Burke, M., Xie, M., Davis, W.M., Lobell, D.B., Ermon, S.: Combining satellite imagery and machine learning to predict poverty. Science 353(6301), 790–794 (2016) [2] Ngestrini, 2019 Ngestrini, R. (2019). Predicting poverty of a region from satellite imagery [3] using cnns. Master’s thesis, Departement of Information and Computing Science, Utrecht University. Unpublished, http://dspace.library.uu.nl/handle/1874/376648. [4] Nigeria\'s Economy\". Macro Poverty Outlook for Sub.Saharan Africa. World Bank [5] Y. Zhang, J. Gao, and H. Zhou, “Breeds Classification with Deep Convolutional Neural Network,” in ACM International Conference Proceeding Series, 2020, pp. 145–151. [6] C. Zhao, B. Ni, J. Zhang, Q. Zhao, W. Zhang, and Q. Tian, “Variational convolutional neural network pruning,” in Proceedings of the IEEE Computer Society Conference on Computer Vision and Pattern Recognition, 2019, vol. 2019.June, pp. 2775–2784. [7] Jean et al., 2016 Jean, N., Burke, M., Xie, M., Davis, W. M., Lobell, D. B., and Ermon, S.(2016). Combining satellite imagery and machine learning to predict poverty. [8] Poverty index in Nigeria https://www.statista.com/statistics /1121438/ poverty. head count.rate. in.nigeria.by.state/in the poverty headcount of the northern part of Nigeria [9] S. Albawi, T. A. Mohammed, and S. Al.Zawi, “Understanding of a convolutional neural network,” in Proceedings of 2017 International Conference on Engineering and Technology, [10] K. Simonyan and A. Zisserman, “Very deep convolutional networks for large.scale image recognition,” in 3rd International Conference on Learning Representations, ICLR 2015 . Conference Track Proceedings, 2015. and poverty detection using satellite image [11] Har.Peled, S., Roth, D., Zimak, D. (2003) \"Constraint Classification for Multiclass Classification and Ranking.\" In: Becker, B., Thrun, S., Obermayer, K. (Eds) Advances in Neural Information Processing Systems 15: Proceedings of the 2002 Conference, MIT [12] A. Shafiee et al., “ISAAC: A Convolutional Neural Network Accelerator with In.Situ Analog Arithmetic in Crossbars,” Proc. . 2016 43rd Int. Symp. Comput. Archit. ISCA 2016, [13] Abdi, H. and Valentin, D. (2007) :Multiple correspondence analysis. Retrieved 27. 03.2016 from :https: //ww. researchgate.net/ profile/ Dominique_Valentin/ publication/239542271_ Multiple_Correspondence_ Analysis/ links/54a979900cf25 6bf8bb9 [14] Hersh, J., and Newhouse, D. Poverty from space: using high.resolution satellite [15] imagery for estimating economic well.being, 2017. Breiman, L. (2001). Random forests. Machine learning, [16] David, W. . H., & Stanley, L. (2000). Applied logistic regression. Willey. [17] Agresti, A. (2003). Categorical Data Analysis (2th ed.). John Wiley & Sons [18] Asselin, L..M. And Anh, V.T. (2008) : Multidimensional Poverty Measurement with Multiple Correspondence Analysis. In: Kakwani, N. And Silber, J. (eds.) Quantitative Approaches to Multidimensional Poverty Measurement. Palgrave Macmillan [19] James, G; Witten, D., Hastie, T., Tibshirani, R. (2013): An Introduction to Statistical Learning with Applications in R. New York: Springer [20] Greenacre, M.(2010) : Correspondence analysis and related methods [course]. Retrieved 26.03.2016 from http://statmath.wu.ac.at/courses/CAandRelMeth/ [21] A. Krizhevsky, I. Sutskever, and G. E. Hinton, “ImageNet classification with deep convolutional neural networks,” Commun. ACM, vol. 60, no. 6, pp. 84–90, 2017 [22] K. H. Jin, M. T. McCann, E. Froustey, and M. Unser, “Deep Convolutional Neural Network for Inverse Problems in Imaging,” ., vol. 26, no. 9, pp. 4509–4522, 2017. [23] aches to Multidimensional Poverty Measurement. Palgrave MacmillanK.Means Clustering in R documentation. Retrieved 28.04.2016 from https://stat.ethz.ch /R.manual /R.devel/library/ stats /html/ kmeans.html [24] F. Harrell. (2017, January 15). Classification vs. Prediction. Retrieved April 01, 2018, from Statistical Thinking: http://www.fharrell.com/post/classification/ [25] Jean, Neal, Marshall Burke, Michael Xie, W. Matthew Davis, David B. Lobell, and Stefano Ermon. 2016. \"Combining satellite imagery and machine learning to predict poverty.\" Science 353 (6301): [26] Joshi, R. (2016, September 9). Accuracy, Precision, Recall & F1 Score: Interpretation of Performance Measures. Retrieved from http:// blog. exsilio. com/ all/ accuracy. Precision re call. f1.score .interpretation. Of .performance .measures/ [27] Asselin, L..M. And Anh, V.T. (2008) : Multidimensional Poverty Measurement with Multiple Correspondence Analysis. In: Kakwani, N. And Silber, J. (eds.) Quantitative Appro
Copyright
Copyright © 2024 Okoroafor Daniel Chukwuebuka, Zhang Diping. This is an open access article distributed under the Creative Commons Attribution License, which permits unrestricted use, distribution, and reproduction in any medium, provided the original work is properly cited.

Download Paper
Paper Id : IJRASET58717
Publish Date : 2024-03-01
ISSN : 2321-9653
Publisher Name : IJRASET
DOI Link : Click Here
 Submit Paper Online

