

Ijraset Journal For Research in Applied Science and Engineering Technology
A Comparative Study on Seismic Behaviour of Plan Irregular Buildings
Authors: Ravi Tej M J, Chidananda G
DOI Link: https://doi.org/10.22214/ijraset.2024.64804
Certificate: View Certificate
Abstract
Asymmetrical plan irregularities occur when the horizontal layout of a building is non uniform or unsymmetrical in one or more axes. These irregularities may arise from variations in building shape, size, or configuration, leading to non-uniform distribution of mass, stiffness, or load paths throughout the structure. Considering equivalent static analysis (ESA) and response spectrum analysis (RSA) as per IS 1893-Part 1 (2016) considering seismic zones III, structure with square shaped plan performs better than the other shaped models (viz. T, L, H and Plus shapes) with least values of storey displacement and storey drift ratio, and also with higher value of storey stiffness. Thus, square plan shaped structure is seismically more resistant than T, L, H and Plus shaped structures.
Introduction
I. INTRODUCTION
Earthquake is a naturally occurring phenomenon which is caused due movement between the tectonic plates along a fault line in the earth's crust. Earthquake causes violent and abrupt shaking of the ground surface. The quantitative measure of size of an earthquake is represented in magnitude and is measured using Richter scale. IS 1893-Part -1 (2016) provides the guidelines for analysis structures for earthquake force. India has been classified into various zones viz. II, III, IV and V. Asymmetrical plan irregularities occur when the horizontal layout of a building is non uniform or unsymmetrical in one or more axes. These irregularities may arise from variations in building shape, size, or configuration, leading to non-uniform distribution of mass, stiffness, or load paths throughout the structure.
II. BUILDING DESCRIPTION
Table 1 Shows the parameters of the developed RCC models
Table 1: Parameters of the developed RCC models
|
Sl. No. |
Parameter |
Remarks |
|
1 |
Building type |
Commercial |
|
2 |
Structure type |
G+12 |
|
3 |
Total No. of stories |
13 |
|
4 |
Total height of building from ground floor to terrace |
42.9 m |
|
5 |
Size of column |
300x750 mm |
|
6 |
Size of beam |
300x600 mm |
|
7 |
Thickness of wall |
300 mm |
|
8 |
Thickness of slab |
150 mm |
|
9 |
Base storey height |
1.5 m |
|
10 |
Typical storey height |
3.3 m |
|
11 |
Parapet wall height |
0.9 m |
|
12 |
Grade of concrete |
M35 |
|
13 |
Concrete Density |
25 kN/m3 |
|
14 |
Grade of Rebar |
Fe500 |
|
15 |
Live loads on floors excluding terrace |
4 kN/m2 |
|
16 |
Live loads on terrace |
1.5 kN/m2 |
|
17 |
Floor finish on terrace |
2.4 kN/m2 |
|
18 |
Floor finish of each floor except terrace |
1.5 kN/m2 |
|
19 |
Soil Type |
Medium |
|
20 |
Seismic zone |
III |
|
21 |
Importance factor |
1 |
|
22 |
Response factor value |
3 |
|
23 |
Dead load calculation |
As per IS 875-Part 1 (1987) |
|
24 |
Live load calculation |
As per IS 875-Part 2 (1987) |
|
25 |
Earthquake load calculation |
As per IS 1893-Part 1 (2016) |
|
26 |
Load combinations |
As per IS 1893-Part 1 (2016) |
Table 2 shows the identity for the developed RCC models
Table 2 : Identity for the developed RCC models
|
Sl. No. |
Model ID |
Plan shapes |
|
1 |
M-I |
Square |
|
2 |
M-II |
T |
|
3 |
M-III |
L |
|
4 |
M-IV |
H |
|
5 |
M-V |
Plus |
Figures from 1to 10 shows the plan and elevation of the developed models.
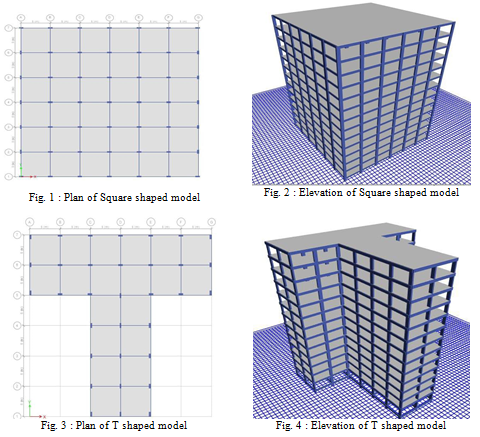
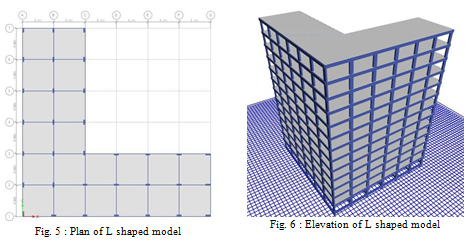
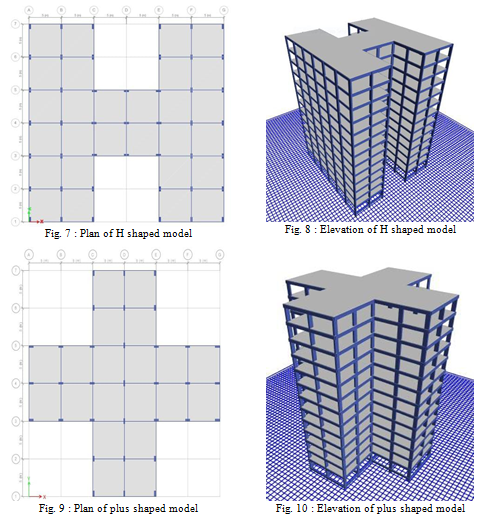
III. ANALYSIS OF RCC MODELS
Using ETABS software, the developed models are subjected to equivalent static analysis (ESA) and response spectrum analysis (RSA) as per IS 1893-Part 1 (2016) for different load combinations. Seismic parameters viz. storey displacement, drift ratio, stiffness, shear and overturning moments are obtained from the analysis of developed models in seismic zone III.
IV. RESULTS AND DISCUSSION
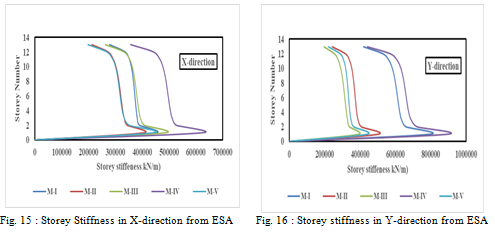
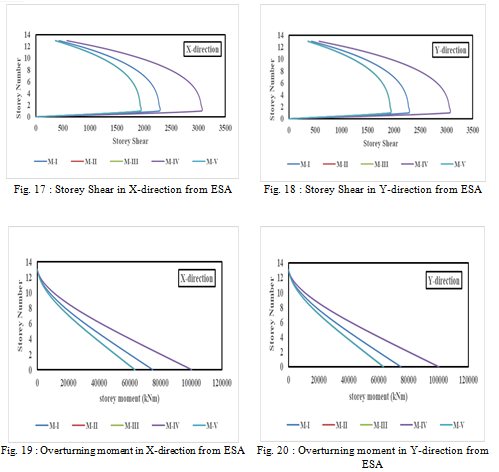
Figures 11 to 20 shows the variation of storey displacement, drift ratio, stiffness, shear, overturning moments over the number of stories in both X and Y directions obtained for all the RCC models by Equivalent static method
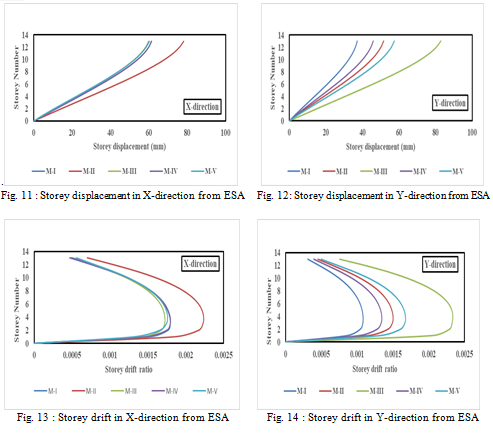
From the Figs. 11 and 12, it is observed that, all the models exhibit similar kind of variation in storey displacement. However, storey displacement in X-direction is found to be more than that of Y-direction.
From the Figs. 13 and 14, it is observed that, all the models exhibit similar kind of variation in storey drift ratio. However, drift ratio in X-direction is found to be more than that of Y-direction.
From the Figs.15 and 16, it is observed that, all the models exhibit similar kind of variation in storey stiffness. However, storey stiffness in Y-direction is found to be more than that of X-direction.
From the Figs. 17 and 18 it is observed that, all the models exhibit similar kind of variation in storey shear in both X and Y directions.
From the Figs. 19 and 20, it is observed that, all the models exhibit similar kind of variation in overturning moments in both X and Y-directions.
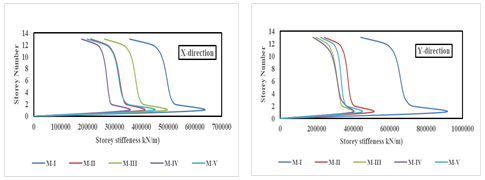
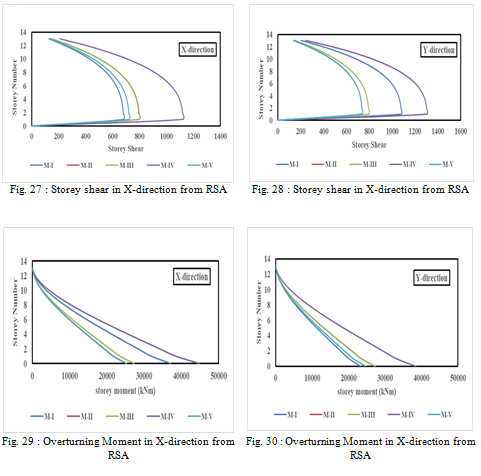
Figures 21 to 30 shows the variation of storey displacement, drift ratio, stiffness, shear, overturning moments over the number of stories in both X and Y directions obtained for all the RCC models by Response spectrum method.
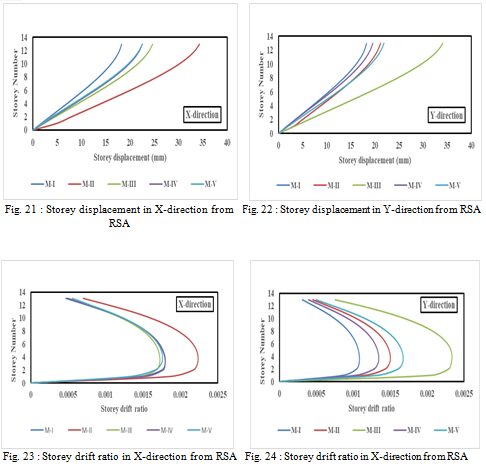
From the Figs. 21 and 22, it is observed that, all the models exhibit similar kind of variation in storey displacement. However, storey displacements in X-direction is found to be more than that of Y-direction.
From the Figs 23 and 24, it is observed that, all the models exhibit similar kind of variation in storey drift ratio. However, storey drift ratio in X-direction is found to be more than that of Y-direction.
From the Figs. 25 and 26, it is observed that all the models exhibit similar kind of variation in storey stiffness. However, storey stiffness in Y-direction is found to be more than that of X-direction.
From the Figs. 27 and 28, it is observed that, all the models exhibit similar kind of variation in storey shear. However, storey shear in Y-direction is found to be more than that of X-direction.
From the Figs. 29 and 30, it is observed that, all the models exhibit similar kind of variation in storey overturning storey moment. However, storey overturning storey moment in X-direction is found to be more than that of Y-direction.
Figures 31 to 40 show the variation of maximum storey displacement, drift ratio, stiffness, shear and overturning moment for all the models by ESA and RSA.
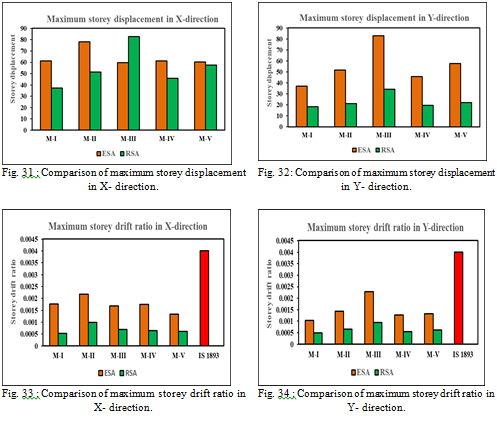
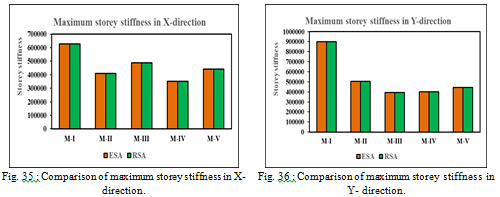
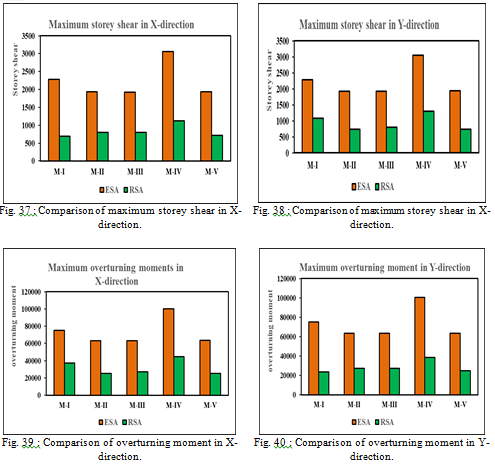
From Figs. 31 to 40, it is observed that, for all the models, equivalent static analysis predicts higher values of storey displacement, storey drift ratio, storey shear and overturning moment than that predicted by response spectrum analysis. In both methods of analysis, maximum storey drift ratio in all the models is within the allowable limits specified in Cl.7.11.1 of IS 1893-Part 1(2016). In both X and Y directions, least values of storey displacement and storey drift ratio, and also higher value of storey stiffness is observed in square shaped model as compared with T, L, H and Plus plan shaped models
Conclusion
In the present study, seismic performance of RCC structures with various plan irregularities is investigated using ETABS software. Seismic parameters viz. storey displacement, drift ratio, stiffness, shear, overturning moment, time period and natural frequency for the developed RCC models are obtained in both X and Y directions by equivalent static analysis (ESA) and response spectrum analysis (RSA) as per IS 1893-Part 1 (2016) considering seismic zones III.
References
[1] Upadhyay H, Singh S K and Sharma A (2021), “Dynamic analysis of G+15 multi-storied RCC commercial buildings with different plan configuration in seismic zone V using ETABS 2018”, International Research Journal of Engineering and Technology, Volume 8, Issue 8, pp. 85-91. [2] Imranullahkhan and Sanyasi Rao S S E (2017), “Seismic analysis of irregular L-shape building in various zones”, International Journal of Innovative Research in Science, Engineering and Technology, Volume 6, Issue 8, pp. 16529-16536. [3] Raagavi M T and Sidhardhan S (2021), “Analytical study on seismic performance of plan irregular structures”, Journal of Emerging Technologies and Innovative Research, Volume 8, Issue 8, pp. 221-225. [4] Sultan M R and Peera D G (2015), “Dynamic analysis of multi-storey building for different shapes”, International Journal of Innovative Research in Advanced Engineering, Volume 2, Issue 8, pp. 85-91. [5] Farhan M A A and Bommisetty J (2019), “Seismic analysis of multistoried RCC buildings regular and irregular in plan”, International Journal of Engineering Research & Technology (IJERT), Volume 8 Issue 11, pp.115-121. [6] Md.Naimul Haque, Zisan M N, Kibria M B (2021), “Influence of planar irregularities on seismic responses of RC building”. Springer journal publications, Volume 22, pp -995-1009. [7] Banginwar R S, Vyawahare M R and Modani P O (2012), “Effect of plans configurations on the seismic behaviour of the structure by response spectrum Method”, International Journal of Engineering Research and Applications (IJERA), Volume 2, Issue 3, pp.1439-1443. [8] IS 456 (2000), “Code of Practice for Plain and Reinforced Concrete”, Bureau of Indian Standards New Delhi, India. [9] IS 875-1 (1987), “Code of Practice for Design Loads (Other Than Earthquake) For Buildings and Structures, Part 1: Dead Loads - Unit Weights of Building Material and Stored Materials”, Bureau of Indian Standards New Delhi, India. [10] IS 875-2 (1987), “Code of Practice for Design Loads (Other Than Earthquake) For Buildings and Structures, Part 2: Imposed Loads”, Bureau of Indian Standards New Delhi, India. [11] IS 1893 Part-1 (2016), “Criteria for Earthquake Resistant Design of Structures part1 General Provision and Building”, Bureau Of Indian Standards New Delhi, India.
Copyright
Copyright © 2024 Ravi Tej M J, Chidananda G. This is an open access article distributed under the Creative Commons Attribution License, which permits unrestricted use, distribution, and reproduction in any medium, provided the original work is properly cited.

Download Paper
Paper Id : IJRASET64804
Publish Date : 2024-10-25
ISSN : 2321-9653
Publisher Name : IJRASET
DOI Link : Click Here
 Submit Paper Online