Ijraset Journal For Research in Applied Science and Engineering Technology
- Home / Ijraset
- On This Page
- Abstract
- Introduction
- Conclusion
- References
- Copyright
Air Pollution Forecasting Using a Deep Learning Model Based on 1D ConvNets and Bidirectional GRU
Authors: Sagar Shrivastava, Shyamol Banerjee
DOI Link: https://doi.org/10.22214/ijraset.2024.63402
Certificate: View Certificate
Abstract
This study presents a methodology for air pollution forecasting, aiming to improve accuracy through incorporating models for deep learning. Our goal is to create a reliable technique for forecasting air pollution concentrations. Central Pollution Control Board (CPCB) data undergoes exploratory data analysis. Analysis (EDA) and pre-processing before being split into training and testing sets. Two sequential models, Sequential-1 and Sequential-2, are compared, with Sequential-2 incorporating Conv1D layers alongside GRU for enhanced spatial-temporal modeling. Findings reveal that Sequential-2 consistently outperforms Sequential-1, exhibiting lower loss, mean squared error (MSE), validation loss, and validation MSE metrics. This indicates Sequential-2\\\'s superior predictive performance and generalization capability, attributed because of how well it can grasp spatial dependencies. In sum, the methodology proves that deep learning methods work well for predicting air pollution levels, offering promising avenues for accurately predicting pollutant concentrations and informing mitigation strategies for a healthier environment.
Introduction
I. INTRODUCTION
Predicting what kinds of air pollutants will be present in a certain area is what "air pollution forecasting" is all about. and time by employing scientific developments and technology. The calculation of the air quality index is dependent on these predictions, which are based on real-time data or algorithms that estimate pollutant concentrations. Many organizations, both public and private, are dedicated to predicting urban and national air pollution levels, including national and state governments as well as corporations like Airly, AirVisual, Aerostate, Ambee, BreezoMeter, PlumeLabs, and DRAXIS. Air pollution remains a paramount global challenge, contributing significantly to cardiovascular diseases, respiratory illnesses, and various health issues. Its adverse effects extend to mental health and exacerbation of preexisting conditions, while also posing a threat to the environment. Educating people about the consequences of air pollution and actively working to mitigate these issues are imperative. Advancements in precise air pollution forecasting methods have made it easier to monitor and regulate pollutant concentrations, thereby ensuring a safer and healthier environment. This forecasting tool not only aids in controlling and reducing air pollution but also plays a pivotal role in addressing environmental and climatic concerns stemming from inadequate air quality regulations[1]–[4]. Accurate forecasting assists in organizing daily activities, avoiding areas under high pollution alerts, and implementing effective pollution management strategies, thereby contributing to better public health and environmental sustainability. All life on Earth depends on air to breathe and thrive. Its quality significantly impacts both economic development and individual health. The current decline in air quality and increasing air pollution can be attributed to industrialization, the surge in personal vehicle usage, and the widespread reliance on fossil fuels. Air pollution is a serious problem in many parts of everything on Earth because of the abundance of dangerous chemicals. Researchers and experts worldwide have concentrated on predicting pollutants in their studies, aiming to forecast air pollution and improve air quality. The consequences of air pollution deeply affect communities, posing a threat to human survival. Notably, during the Industrial Revolution, the rising use of coal in industries and homes exacerbated air pollution. When combined with stagnant air, this pollution led to increased illness and mortality. A tragic instance was the five-day pollution event in London in 1952, claiming the lives of at least 4,000 people. The link between air pollution and health was brought into sharp focus by this tragic event. However, despite such historical events, air pollution continues to worsen in cities and households worldwide. Air pollution forecasting involves the application of scientific knowledge and technological tools To forecast the precise constitution of atmospheric contamination in a specific geographical area and time in the atmosphere. This procedure is necessary to precisely forecast the situation.
The algorithmic estimation of pollutant concentrations can be converted into the air quality index using the same process as actual measurements are used to calculate the index. Various entities, such as government agencies at the state and municipal levels, along with private companies like Airly, Air Visual, Aerostate, Ambee, BreezoMeter, PlumeLabs, and DRAXIS, offer predictions regarding air pollution. These forecasts are produced by private businesses and organizations. Subsequently, these predictions are distributed to local governments and municipalities. Air pollution prediction entails employing mathematical models, Utilizing statistical analysis & methods for artificial intelligence This study aims to predict the amounts of air pollutants in a certain region during . a given timeframe. These projections are crucial for effectively managing public health hazards, making informed policy decisions, and implementing actions to minimize pollution. One approach to predict exposure to air pollution is by employing mathematical models based on the chemistry and physics of the atmosphere. These models consider climatic elements such as temperature, wind speed, and humidity. Additional factors that are considered encompass emissions originating from corporations, natural sources, and other modes of transportation. These models have the capability to forecast the concentrations of pollutants in various geographical areas through simulating the dispersion and chemical reactions of pollutants in the atmosphere. Another approach entails employing statistical methods to analyze historical pollution data and weather trends[5]. The ability of statistical models to produce forecasts based on comparable weather patterns that will occur in the future is made possible by the identification of connections between past pollution levels and certain weather circumstances. The forecasting of air pollution is another area in which machine learning algorithms play a crucial role. These algorithms analyze vast datasets in order to uncover complicated correlations between various variables and thereby Enhance the precision of forecasts. Continuous data collection on pollution levels through real-time monitoring stations equipped with sensors is crucial for evaluating and improving forecasting models[6], [7]. The PM2.5 and PM10 portions of these websites measure the levels of pollutants, which include ozone (O3), gaseous carbon monoxide (CO), sulfur dioxide (SO2), nitrogen dioxide (NO2), and atmospheric nitrogen (NO2). Written by the user. is incomplete.real-time data is fed into forecasting models, enabling the models to constantly update and enhance their predictions based on the present circumstances.
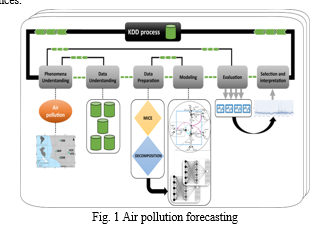
The accuracy and breadth of air pollution forecasting have both been improved as a result of technological advancements such as remote sensing using satellites and drones. Satellite data can provide a more comprehensive spatial perspective by monitoring contaminants across wide geographical areas. This serves as a complementary method to monitoring that conducted on the ground. Nevertheless, numerous difficulties still exist in the field of predicting air pollution [8], [9]. These challenges encompass the intricacy of atmospheric processes, the uncertainty in emissions data, and the requirement for high-quality input data in order to make reliable predictions. Furthermore, unanticipated occurrences such as wildfires or industrial accidents can have a substantial impact on air quality, which contributes to the difficulty of precisely forecasting the situation. Refining models through continuous data Efforts to enhance the accuracy of air pollution forecasting involve activities such as data collection, advancing comprehension of atmospheric dynamics, and incorporating information from diverse sources. Within order to develop more robust forecasting systems that are better able to protect public health and the environment, it is essential for scientists, policymakers, and other stakeholders to work together on collaborative projects[10].
II. LITERATURE REVIEW
Xu 2023 et al. Like most spatiotemporal modeling issues, air quality prediction requires different components to handle the spatial and temporal dependencies in complex systems. In their simulations, TSA and RNN models have solely used time series devoid of spatial information. Attempts to correlate the spatial locations of observation sites using graph convolution neural networks (GCNs) have to come before. We use past data to determine site strengths and relationships. Due to the limitations of human intellect, limited prior information cannot reflect the fundamental structure of the station or provide better data for reliable prediction. Our special Dynamic Graph Neural Network (DGN-AEA) learns edge characteristics and model parameters to construct the adaptive bidirected dynamic graph in the message-passing passing network. Our approach can benefit from adaptive edge data provided via end-to-end training even in the absence of any background knowledge. Consolidating issue complexity. Studies involving decision-making can benefit from model by-products that disclose previously unknown structural information between stations [11].
Cities 2023 et al. "The phrase "smart city" describes a type of urban region that enhances conventional networks and services through the use of digital technologies, with the goals of fostering sustainable economic growth, better managing resources, or providing public enjoyment.
More and more people are choosing to live in cities, which is elevating the status of cities and necessitating rapid expansion to accommodate the varied needs of city dwellers. In order to accomplish smart city objectives, the Internet of Things (IoT) gathers and intelligently applies massive amounts of data. With applications in many fields, including healthcare, meteorology, retail, economics, and more, time-series forecasting based on machine learning has been the subject of much research. For multivariate scenarios involving different Internet of Things (IoT) time series in six smart city areas, this review covers the most popular deep neural network time-series forecasting approaches [12].
Gurumoorthy 2023 et al. Particle and pollutant instability and fluctuation makes air quality prediction (AQP) challenging. Urban air quality has declined in some nations due to increased PM2.5 emissions. In order to reliably forecast air pollution, this study established a regression model based on optimization. To begin, we analyzed real-time PM2.5 readings from a Beijing dataset covering the years 2010–2014. The real-time dataset covered the years 2016–2022, and it included the cities of Cochin, Hyderabad, Chennai, and Bangalore. After applying Min-Max normalization to the data, we used correlation analysis to pick highly connected variables, such as wind speed, temperature, dew point, wind direction, and history of PM2.5. Next, we used reinforced swarm optimization (RSO) to pick out the important parts of the highly correlated variables. The most effective features were input into a Bi-GRU model to optimize AQP efficiency [13].
Abimannan 2023 et al. Although developing tools to monitor air quality is difficult, it is crucial in the fight against air pollution. Both federated learning and multi-access computing edge (MEC) technologies have the potential to make these systems more precise and efficient. In this article, we review the most current findings about air monitoring networks that use federated learning, often known as MEC. The privacy-preserving MEC model training technique, which improves reaction times and minimizes latency, is one of several advantages of federated learning for air quality monitoring. The main challenges faced by real-time air monitoring systems include data quality, security, privacy, and interpretable models powered by artificial intelligence. Air quality forecasts provided by modern air monitoring systems are accurate because they use state-of-the-art techniques and technologies to overcome obstacles [14].
Huang 2023 et al. To better predict short-term wind output, it is helpful to consider the spatial-temporal relationship of neighboring wind turbines. We introduce a 3D generalized recurrent unit model for the purpose of short-term wind turbine output forecasting. 3D convolutional neural network (CNN) or generalized recurrent unit (GRU) encoders take a 3D matrix of wind power or weather data and feed it to the twenty-four turbines in the target area in order to extract their spatial-temporal properties. The GRU decoder or fully linked layers thereafter produce the anticipated power for different time horizons. Lastly, our technique exceeds the prediction accuracy of the BPNN, GRU, and 1D CNN-GRU models according to the SDWPT data. The outcomes prove that the 3D CNN-GRU is the superior design. On the validation dataset, RMSE and MAE typically rise by 10% and 11% over a 10-minute forecasting horizon, respectively, with an improvement in R of 1% [15].
III. RESEARCH METHODOLOGY
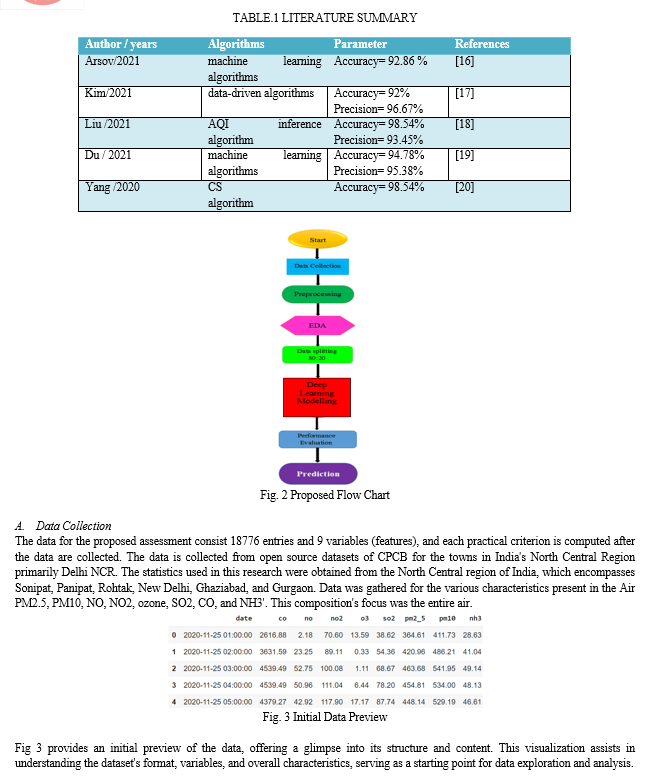
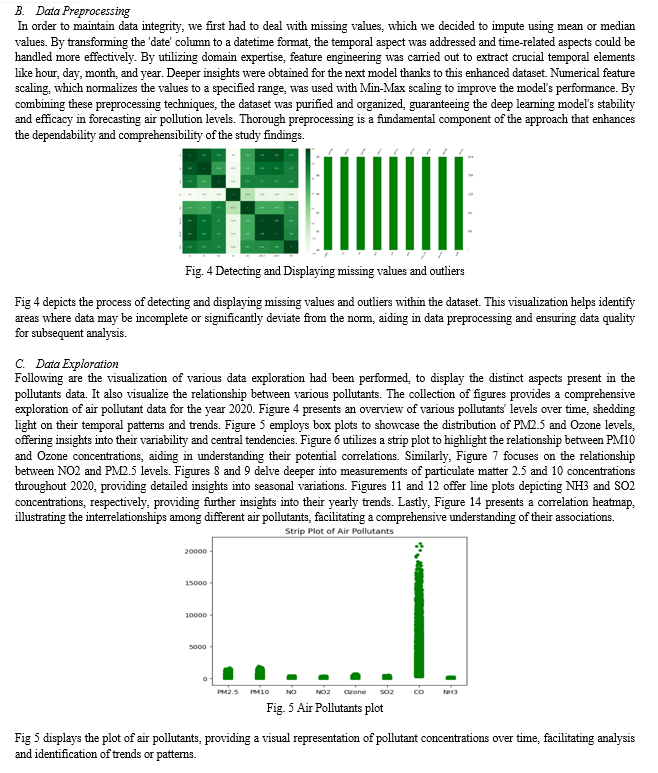
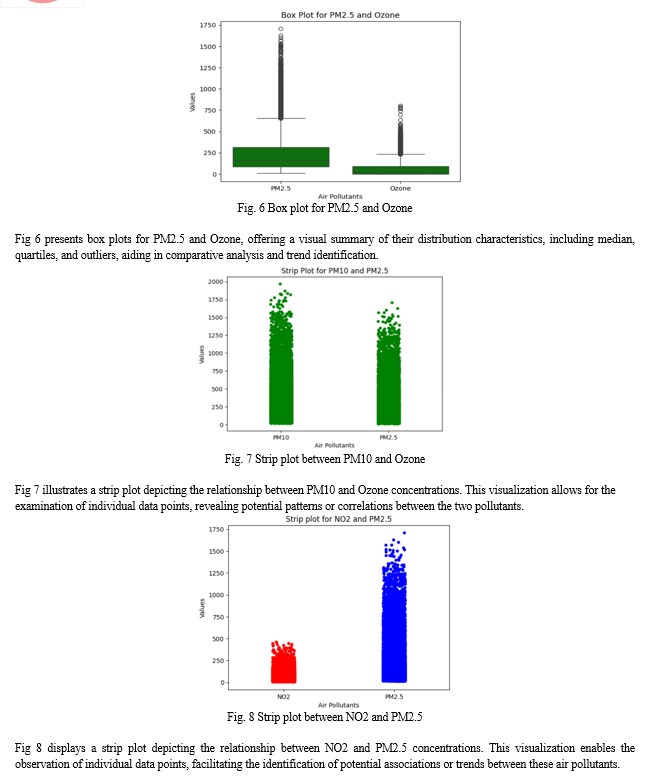
The suggested methodology for measuring Air pollution is discussed in this section. Data from CPCB are first collected, after which EDA and pre-processing are carried out. The data are then split into 80:20 split, with training taking up 80% of the time and testing taking up 20% Next, deep learning models will be used for assessment.
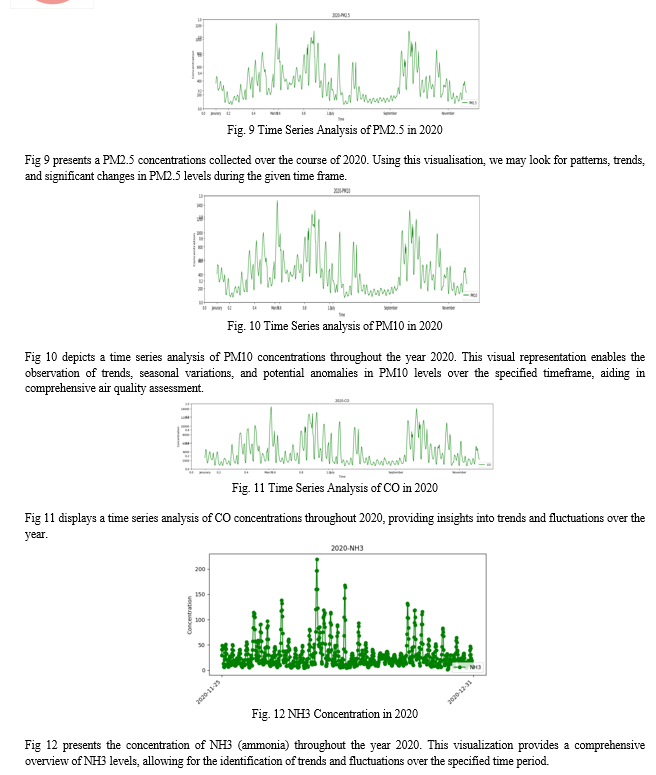
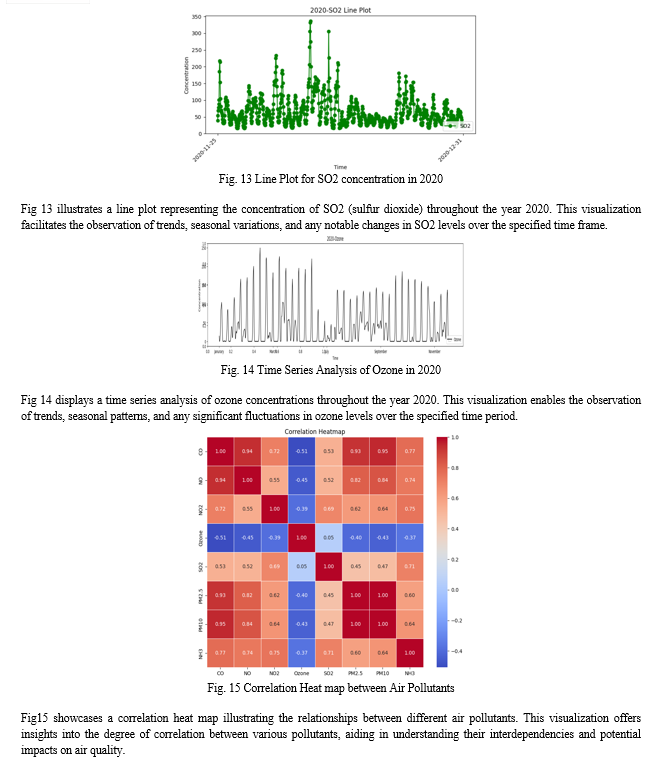
D. Data Splitting
Data splitting is an important part of building machine learning models because it allows you to test how well the model does on data that it has never seen before. The given code fragment uses the 'train_test_split' function to split the dataset in half, 90 percent for training and 10 percent for testing. This keeps some data for evaluation and trains the model on most of the data. To make the data suitable for deep learning frameworks, we transform the features into NumPy arrays and then shape them. As a whole, this data partitioning method makes it easier to train, validate, and test the generalizability of models.
E. Deep Learning Modelling
Predicting levels of air pollution is the goal of the presented deep learning model, which is a sequential model. There are primarily two levels to it: a Gated Recurrent Unit (GRU) layer and a Dense layer. The GRU layer serves as the primary component for sequence modelling, capable of capturing temporal dependencies within the data. It takes input data and processes it through its recurrent units to extract relevant features. In this model, the GRU layer outputs a sequence of 50-dimensional vectors.
Following the GRU layer, the output is passed through a Dense layer, which performs the final classification or regression task. In this case, it reduces the dimensionality of the GRU layer's output to a single value, representing the predicted pollution level. The model architecture comprises a a grand total of 8001 trainable parameters. In order to reduce the difference between the actual and expected amounts of pollution, these parameters are fine-tuned throughout training. The model's goal is to accurately anticipate air pollution levels by learning from the input data's complicated patterns and correlations.
Overall, this deep learning model is tailored specifically for air pollution prediction, leveraging recurrent neural networks to capture temporal dynamics and make informed predictions based on historical data. Considerations including feature selection, data quality, and training methods will determine its efficacy.
The second model is a sequential deep learning model that uses a mix of CNN and GRU layers to forecast air pollution. A Conv1D layer is the starting point. which convolves input data with 64 filters, each spanning a window of size 5. This layer aims to capture spatial patterns within the input sequence.
Following the convolutional layer, a MaxPooling1D layer is employed to down-sample the feature maps, reducing their dimensionality while retaining the most salient information. This pooling operation is performed with a pool size of 2, resulting in a feature map of size 2x64.
Subsequently, the processed data is fed into a GRU layer comprising 50 units. The GRU layer excels in capturing temporal dependencies within sequential data, which is crucial for modeling time-series aspects of air pollution. Lastly, a dense layer with a single neuron is utilized for regression or classification, producing the final prediction of air pollution levels.
With a total of 17,707 trainable parameters, the model is optimized during training to minimize prediction errors. It's engineered to efficiently record incoming data's spatial and temporal patterns, rendering it appropriate.cfor forecasting air pollution levels based on historical observations. The model's performance will be influenced by factors like dataset quality, feature engineering, and training strategies.
IV. RESULT & DISCUSSION
Below are the metrics used for assessment
The computation of commonly used metrics such as mean squared error (MSE), root mean square error (RMSE), and mean absolute error (MAE) involves comparing the projected value with the actual value.The se four metrics can be used to compare the other parameter values of any model or technique.
A mistake is committed in performance validation when data is divided up, taught, and assessed just once. This implies that changing the subgroup under test can render previous conclusions erroneous.
A. MSE (Mean Square Error)
The mean squared error (MSE) is now the most popular metric for assessing picture quality. The closer it is to zero, the better, since the number represents an all-inclusive standard. The mean squared error (MSE) is a risk function that predicts the value of this squared error loss. Probability or the analyst's failure to account for relevant data can lead to an overly optimistic mean squared error (MSE). (in place of none).

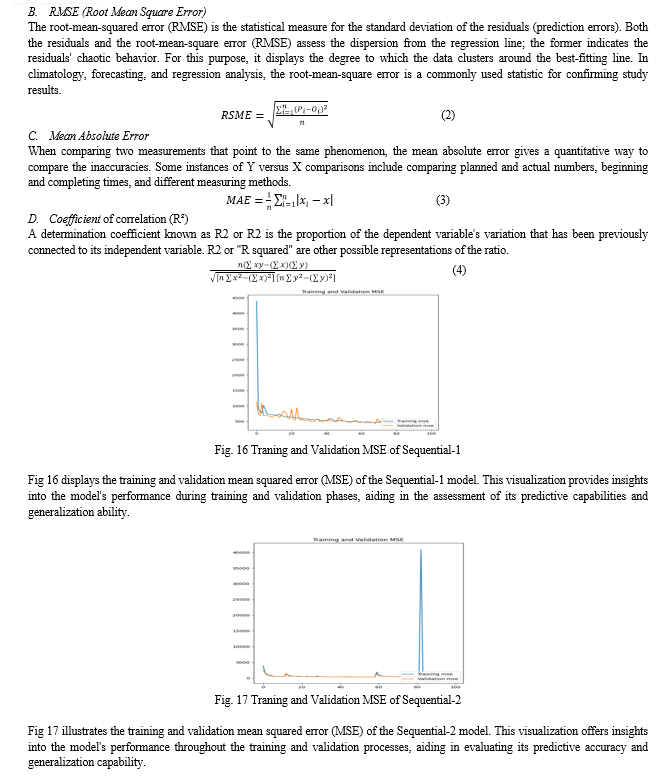
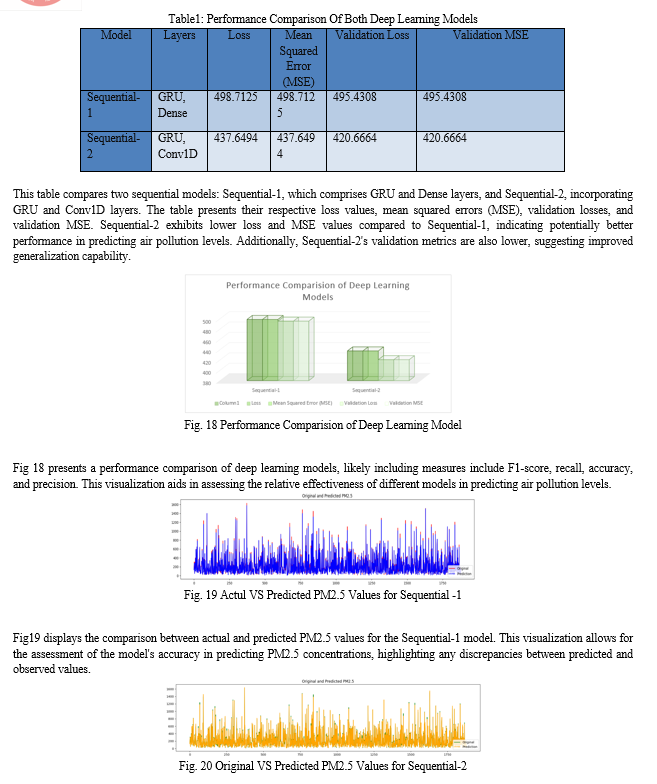
Fig 20 illustrates the comparison between original and predicted PM2.5 values for the Sequential-2 model. This visualization enables the evaluation of the model's performance in forecasting PM2.5 concentrations, facilitating the identification of any disparities between predicted and actual values.
V. FUTURE WORK
Future research in the field of air pollution forecasting utilizing deep learning algorithms encompasses various significant avenues. Initially, the primary objective should be to enhance the resilience and applicability of the model in other geographical areas and pollutant categories, maybe by employing transfer learning methodologies. The inclusion of external variables such as weather patterns and industrial operations in the models has the potential to improve the accuracy of predictions. Additionally, the utilization of multi-source data fusion techniques may provide comprehensive solutions for monitoring purposes. Furthermore, it is essential to improve the comprehensibility Utilizing deep learning algorithms to understand the logic behind forecasts, necessitating the development of explainable AI methods. By combining many models, ensemble learning approaches can improve prediction accuracy. Integrating real-time forecasting systems with adaptive control mechanisms can also help with proactive pollution management. This involves adjusting techniques for managing traffic and reducing emissions based on expected levels of pollution. Improvements in the accuracy, comprehensibility, and usefulness of air pollution prediction models are the focus of next studies. by focusing on these specific aspects. This will ultimately lead to the development of more efficient pollution mitigation techniques and the promotion of healthier surroundings.
Conclusion
In conclusion The methodology described presents a structured framework for quantifying and predicting air pollution levels through the utilization of sophisticated data analysis and deep learning methodologies. The study assures the preparedness of the dataset for analysis by gathering data regarding EDA and pre-processing, as well as data from the Central Pollution Control Board (CPCB). Separating the data into training and testing sets allows for a more thorough assessment of the model\\\'s performance. The approach aims to use deep learning models, namely the combination of 1D Convolutional Neural Networks (ConvNets) and Bidirectional Gated Recurrent Units (BiGRUs), to generate accurate predictions of concentrations of air pollution. Compared to Sequential-1, Sequential-2 models perform better when it comes to validation loss, validation mean squared error (MSE), loss overall, and validation MSE. These findings suggest that the latter model demonstrates enhanced predictive performance and a greater capacity for generalization. Integrating Conv1D layers into Sequential-2 enhances the ability to accurately represent geographical relationships and temporal changes in air pollution data. In general, this methodology offers a systematic framework for tackling the intricacies of air pollution prediction, thereby facilitating well-informed decision-making and the implementation of efficient pollution mitigation strategies aimed at promoting environmental well-being.
References
[1] L. Gao, C. Cai, and X. M. Hu, “Air Quality Prediction Using Machine Learning,” Mach. Learn. Chem. Saf. Heal. Fundam. with Appl., vol. 9, no. 5, pp. 267–288, 2022, doi: 10.1002/9781119817512.ch11. [2] Q. Zhang, Y. Han, V. O. K. Li, and J. C. K. Lam, “Deep-AIR: A Hybrid CNN-LSTM Framework for Fine-Grained Air Pollution Estimation and Forecast in Metropolitan Cities,” IEEE Access, vol. 10, pp. 55818–55841, 2022, doi: 10.1109/ACCESS.2022.3174853. [3] D. Kothandaraman et al., “Intelligent Forecasting of Air Quality and Pollution Prediction Using Machine Learning,” Adsorpt. Sci. Technol., vol. 2022, 2022, doi: 10.1155/2022/5086622. [4] D. Pandya and H. Shah, “Prediction of Air Pollution Using Deep Learning Model,” J. Emerg. Technol. Innov. Res., vol. 9, no. 9, pp. 2349–5162, 2022, [Online]. Available: www.jetir.org [5] G. Mani, V. Joshi Kumar, and A. A. Stonier, “Prediction and forecasting of air quality index in Chennai using regression and ARIMA time series models,” J. Eng. Res., vol. 10, no. 2 A, pp. 179–194, 2022, doi: 10.36909/jer.10253. [6] S. Sonawani, K. Patil, and P. Chumchu, “NO2 pollutant concentration forecasting for air quality monitoring by using an optimised deep learning bidirectional GRU model,” Int. J. Comput. Sci. Eng., vol. 24, no. 1, pp. 64–73, 2021, doi: 10.1504/IJCSE.2021.113652. [7] I. Mokhtari, W. Bechkit, H. Rivano, and M. R. Yaici, “Uncertainty-Aware Deep Learning Architectures for Highly Dynamic Air Quality Prediction,” IEEE Access, vol. 9, pp. 14765–14778, 2021, doi: 10.1109/ACCESS.2021.3052429. [8] D. K. Rajakumari and P. V, “Air Pollution Prediction in Smart Cities by using Machine Learning Techniques,” Int. J. Innov. Technol. Explor. Eng., vol. 9, no. 5, pp. 1272–1279, 2020, doi: 10.35940/ijitee.e2690.039520. [9] M. Arsov et al., “Short-term air pollution forecasting based on environmental factors and deep learning models,” Proc. 2020 Fed. Conf. Comput. Sci. Inf. Syst. FedCSIS 2020, vol. 21, pp. 15–22, 2020, doi: 10.15439/2020F211. [10] S. Jeya and L. Sankari, “Air Pollution Prediction by Deep Learning Model,” Proc. Int. Conf. Intell. Comput. Control Syst. ICICCS 2020, no. Iciccs, pp. 736–741, 2020, doi: 10.1109/ICICCS48265.2020.9120932. [11] J. Xu et al., “Dynamic graph neural network with adaptive edge attributes for air quality prediction: A case study in China,” Heliyon, vol. 9, no. 7, p. e17746, 2023, doi: 10.1016/j.heliyon.2023.e17746. [12] S. Cities, “smart cities Multivariate Time-Series Forecasting?: A Review of Deep Learning Methods in Internet of Things Applications to Smart Cities,” pp. 2519–2552, 2023. [13] S. Gurumoorthy, A. K. Kokku, P. Falkowski-Gilski, and P. B. Divakarachari, “Effective Air Quality Prediction Using Reinforced Swarm Optimization and Bi-Directional Gated Recurrent Unit,” Sustain., vol. 15, no. 14, pp. 1–19, 2023, doi: 10.3390/su151411454. [14] S. Abimannan et al., “Towards Federated Learning and Multi-Access Edge Computing for Air Quality Monitoring: Literature Review and Assessment,” Sustainability, vol. 15, no. 18, p. 13951, 2023. [15] X. Huang, Y. Zhang, J. Liu, X. Zhang, and S. Liu, “A Short-Term Wind Power Forecasting Model Based on 3D Convolutional Neural Network – Gated Recurrent Unit,” 2023. [16] M. Arsov et al., “Multi-horizon air pollution forecasting with deep neural networks,” Sensors (Switzerland), vol. 21, no. 4, pp. 1–18, 2021, doi: 10.3390/s21041235. [17] A. Murad, F. A. Kraemer, K. Bach, and G. Taylor, “Quality Forecasting,” pp. 1–42, 2021. [18] Y. Liu, J. Nie, X. Li, S. H. Ahmed, W. Y. B. Lim, and C. Miao, “Federated Learning in the Sky: Aerial-Ground Air Quality Sensing Framework with UAV Swarms,” IEEE Internet Things J., vol. 8, no. 12, pp. 9827–9837, 2021, doi: 10.1109/JIOT.2020.3021006. [19] S. Du, T. Li, Y. Yang, and S. J. Horng, “Deep Air Quality Forecasting Using Hybrid Deep Learning Framework,” IEEE Trans. Knowl. Data Eng., vol. 33, no. 6, pp. 2412–2424, 2021, doi: 10.1109/TKDE.2019.2954510. [20] Hufang, Z. Zhu, C. Li, and R. Li, “A novel combined forecasting system for air pollutants concentration based on fuzzy theory and optimization of aggregation weight,” Appl. Soft Comput. J., vol. 87, p. 105972, 2020, doi: 10.1016/j.asoc.2019.105972.
Copyright
Copyright © 2024 Sagar Shrivastava, Shyamol Banerjee. This is an open access article distributed under the Creative Commons Attribution License, which permits unrestricted use, distribution, and reproduction in any medium, provided the original work is properly cited.

Download Paper
Paper Id : IJRASET63402
Publish Date : 2024-06-21
ISSN : 2321-9653
Publisher Name : IJRASET
DOI Link : Click Here
 Submit Paper Online

