Ijraset Journal For Research in Applied Science and Engineering Technology
- Home / Ijraset
- On This Page
- Abstract
- Introduction
- Conclusion
- References
- Copyright
An Optimal Multi-Modal Approach for Stock Market Price Forecasting with Fused Sentiment Analysis for Real Time Data
Authors: Visakh Chandran Melveetil
DOI Link: https://doi.org/10.22214/ijraset.2024.64417
Certificate: View Certificate
Abstract
This study presents an innovative fusion-based methodology that integrates real-time stock market technical indicators with news sentiment analysis from financial news feeds to enhance stock selection decisions. The proposed framework employs a Bidirectional Long Short-Term Memory (Bi-LSTM) model for forecasting stock prices and a Deep Neural Network (DNN) used in conjunction with transformer-based model for sentiment classification, both optimized through the incorporation of real-time datasets. To further refine feature selection, Artificial Bee Colony (ABC) and Firefly algorithms are utilized, significantly improving the accuracy of price trend predictions and sentiment analysis. Technical indicators from stock market data are processed using the Bi-LSTM model to predict future stock prices. Concurrently, sentiment data from the Economic Times is pre-processed through Term Frequency-Inverse Document Frequency (TF-IDF) vectorization and pre-trained transformer models to extract key sentiment scores. The ABC algorithm enhances textual feature selection, while the Firefly algorithm reduces skewness in the error distribution of technical indicators, thereby improving the alignment between forecasted and actual stock prices. The fusion mechanism integrates predicted price movements with sentiment analysis to provide actionable insights for stock selection. The decision-making framework classifies stocks based on the consistency between price movements and sentiment: stocks predicted to rise with positive sentiment are labelled as \"Sure Selection\"; rising prices with negative sentiment are categorized as \"Dicey Selection\"; declining prices with positive sentiment result in a \"Risky Selection\"; and negative sentiment with falling prices trigger an \"Avoid Selection\". The proposed approach achieved a prediction accuracy of 67.00% for the Bi-LSTM model, with a precision of 0.714, recall of 0.695, and an F1 score of 0.677, demonstrating the model\'s robustness. The mean absolute error (MAE) for the Bi-LSTM model was 4.30, indicating strong predictive performance. The combined use of ABC and Firefly algorithms optimizes both technical and sentiment features, significantly contributing to the overall performance of the prediction model. By fusing multiple data sources and employing advanced optimization techniques, this methodology offers a unique and effective solution for stock market prediction and decision-making.
Introduction
I. INTRODUCTION
The Indian stock exchange popularly known as Bombay Stock Exchange (BSE) and the National Stock Exchange (NSE), ranks among the largest and most dynamic stock exchanges in the world. With over 7,000 companies listed on the BSE alone, the sheer volume of transactions and market capitalization places the Indian stock market on a global pedestal. These exchanges are not only a significant financial hub for investors and institutions, but also a reflection of the economic sentiment and mood of the entire country. One key feature of the Indian stock market is the substantial fluctuation in stock prices. These fluctuations are driven by a variety of factors such as political events, economic policy changes, global financial trends, and market sentiment [1]. It is not uncommon to see significant differences between the opening and closing prices of stocks within the same trading day. This volatility can be attributed to both micro and macroeconomic factors, where even a small piece of news can cause dramatic price swings. The sentiment of the common man is deeply intertwined with the stock market. Indian investors, especially retail investors, often base their decisions not just on fundamental analysis but also on emotional responses to news and market trends. This sentiment-driven approach creates a unique ecosystem where the stock market becomes more than just a financial instrument – it becomes a reflection of public perception, optimism, and fear[2].
In recent years, social media platforms like Instagram, Twitter, Facebook and Electronic News Media have amplified this phenomenon. Investors and the general public now have a medium through which they can rapidly share opinions, experiences, and sentiments about market movements. This has created a feedback loop where stock market performance and social sentiment influence each other. Social media has given a voice to a vast number of retail investors, making it a key source of real-time sentiment data[3].
This research aims to explore the correlation between stock market fluctuations and overall market sentiments arise from textual data like news, social media etc, particularly in the context of predicting stock market trends. By analysing historical stock data and user emotions expressed on platforms like Twitter and Instagram, the paper seeks to develop a predictive model that integrates both market and sentiment-based insights.
The objective is to provide a combined approach for stock market prediction that is informed by both quantitative stock data and qualitative sentiment analysis, thereby offering a more comprehensive understanding of market trends. This approach acknowledges the complexity of the stock market, where not only technical factors but also psychological aspects play a critical role. By combining these two aspects, the research hopes to present a more nuanced prediction model that considers both market dynamics and public emotion[4].
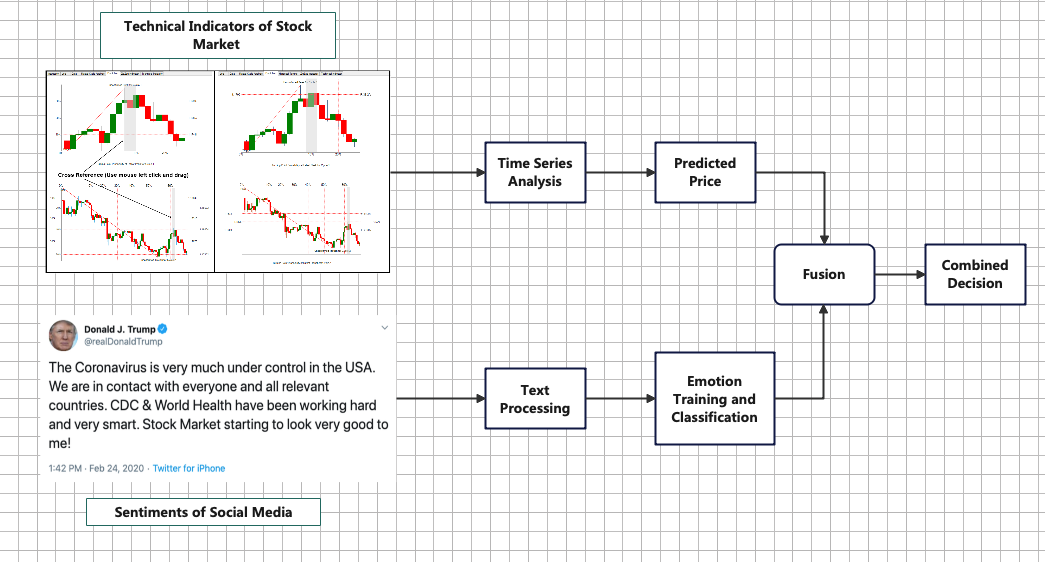
Figure 1: Fusion of time series and social media tweets or comments
The paper contributes in the following manner.
- Aggregation of technical indicators from NSE for various companies
- Application of dual optimization technique for the selection of features from text and technical indicators
- Application of various deep learning classifiers to predict the best classification algorithm over aggregated data for text.
- Application of forecasting algorithms for the analysis of time series forecasting for the selection of best predictor.
- Fusion model of prediction using emotion or sentiments and time series data.
The rest of the paper is organised in the following manner. Section 2 represents the literature that illustrates the fusion and analysis of different authors over different forecasting and sentiment predictions over stock market. Section 3 presents the proposed work that explains the working of the entire proposal. Section 4 illustrates the results whereas Section 5 concludes the paper.
II. RELATED WORK
Gandhi et al. (2023) present a comprehensive review on multimodal sentiment analysis. The paper systematically explores the evolution of multimodal sentiment analysis, examining a variety of datasets, fusion methods, and applications across domains. Key contributions include a discussion on multimodal fusion approaches, where multiple data types (e.g., text, audio, video) are fused to enhance sentiment detection accuracy.
The authors highlight algorithmic advancements, such as early and late fusion techniques, as well as deep learning models, particularly focusing on convolutional and recurrent networks. The paper identifies challenges in handling modality-specific noise and the need for better integration strategies, while also providing future research directions. The review underscores the growing importance of multimodal classification in sentiment analysis across domains like marketing and finance[5] .Sardelich and Manandhar (2018) focus on using multimodal deep learning to predict short-term stock volatility. Their approach combines textual data from news articles and financial reports with historical stock price data to train deep learning models. The key innovation is the integration of different modalities—textual and numerical data—using deep neural networks. Their results indicate that incorporating multimodal data enhances the model's ability to predict market volatility, as opposed to relying solely on numerical stock price data. The authors used multimodal fusion techniques, applying deep learning architectures like LSTMs and CNNs to improve stock price volatility forecasting, showcasing a significant improvement in predictive accuracy[6]. Thandaga Jwalanaiah et al. (2023) develop a deep learning-based multimodal sentiment analysis system to process unstructured big data. The focus of their work is on integrating various data sources, including text, images, and social media, to provide a more holistic sentiment analysis approach. By utilizing convolutional neural networks (CNNs) and long short-term memory (LSTM) models, the study highlights how feature extraction from different modalities can contribute to more accurate sentiment classification. Their framework showcases how deep learning can be applied to process big data effectively, particularly in identifying hidden patterns in unstructured data[7]. Ali et al. (2023) propose a hybrid Empirical Mode Decomposition (EMD) and LSTM model to predict complex stock market data. Their model utilizes EMD to decompose stock time-series data into intrinsic mode functions, which are then fed into the LSTM for forecasting. This hybrid model is aimed at improving accuracy in volatile and nonlinear stock market environments. The empirical results show that combining EMD and LSTM models significantly enhances forecasting performance compared to traditional time-series forecasting techniques, due to the model's ability to capture both short- and long-term dependencies in stock data . Shah et al. (2024) present a thorough review on sentiment analysis of social/web media data for stock market prediction. This paper discusses how sentiments extracted from platforms like Twitter and financial news can be integrated with stock market data to improve predictive models. They explore both traditional machine learning techniques (e.g., SVM, Random Forest) and deep learning models (e.g., RNN, CNN). The review emphasizes the importance of integrating multimodal data, such as text and historical stock data, to improve prediction accuracy. The challenges of handling noisy and unstructured social media data are also highlighted, along with future research directions in this rapidly evolving field[8]. Yun et al. (2023) introduce an interpretable stock price forecasting model that combines Genetic Algorithms (GA) with machine learning regressions to select the best feature subset. The primary contribution of this work lies in its use of GA to optimize feature selection, which improves the performance of regression models in predicting stock prices. The authors discuss how this approach helps identify the most relevant features from a large dataset, thus reducing overfitting and improving the model's interpretability. The application of GAs allows the model to select a smaller, more meaningful set of features without sacrificing accuracy[9] . Lee and Yoo (2020) address the challenge of forecasting international stock markets by integrating multimodal data in a deep learning model. The paper proposes a framework where textual data from financial news is combined with stock market time-series data. By using a multimodal deep learning approach, including CNN and LSTM models, the authors show that integrating multiple data sources leads to better forecasting performance. Their results demonstrate that multimodal deep learning is a promising approach for handling the complexity of financial market forecasting[10]. Wang et al. (2023) propose a tensor learning framework for predicting stock movements based on multimodal information. Their model integrates stock price data with financial news and social media data to predict stock movements. By using tensor-based methods, the model efficiently handles high-dimensional multimodal data, leading to significant improvements in predictive performance. The study highlights the power of tensor learning in combining diverse data sources and demonstrates how this approach can be applied to financial forecasting[11]. Zou and Herremans (2023) introduce the PreBit model, a multimodal approach that combines Twitter embeddings with FinBERT for extreme price movement prediction of Bitcoin. The model uses natural language processing (NLP) techniques to extract sentiment from tweets and integrates this with financial data to predict extreme price movements. The study demonstrates that sentiment data from social media can significantly improve the prediction of volatile price movements, especially in the context of cryptocurrencies like Bitcoin[12]. Lee et al. (2023) propose a multimodal fusion transformer model to exploit macroeconomic indicators for stock direction classification. Their model uses a transformer architecture to integrate macroeconomic data, financial news, and stock price information. The authors highlight the effectiveness of the transformer-based fusion approach in capturing complex dependencies between various data modalities. The results show that the multimodal fusion transformer outperforms traditional methods in predicting stock market directions[13].
III. PROPOSED WORK
As the proposed work fuses both the time series data and the social media analysis for an efficient emotion analysis along with forecasting, the proposed work is divided into 3 segments, the first segment illustrates the time series analysis , second segment is about news content analysis for the emotions or sentiments and the third section picks the best from both the segments and fuses them to produce a hybrid illustration of forecasting along with the sentiment analysis. The overall work can be illustrated using the following flow diagram.
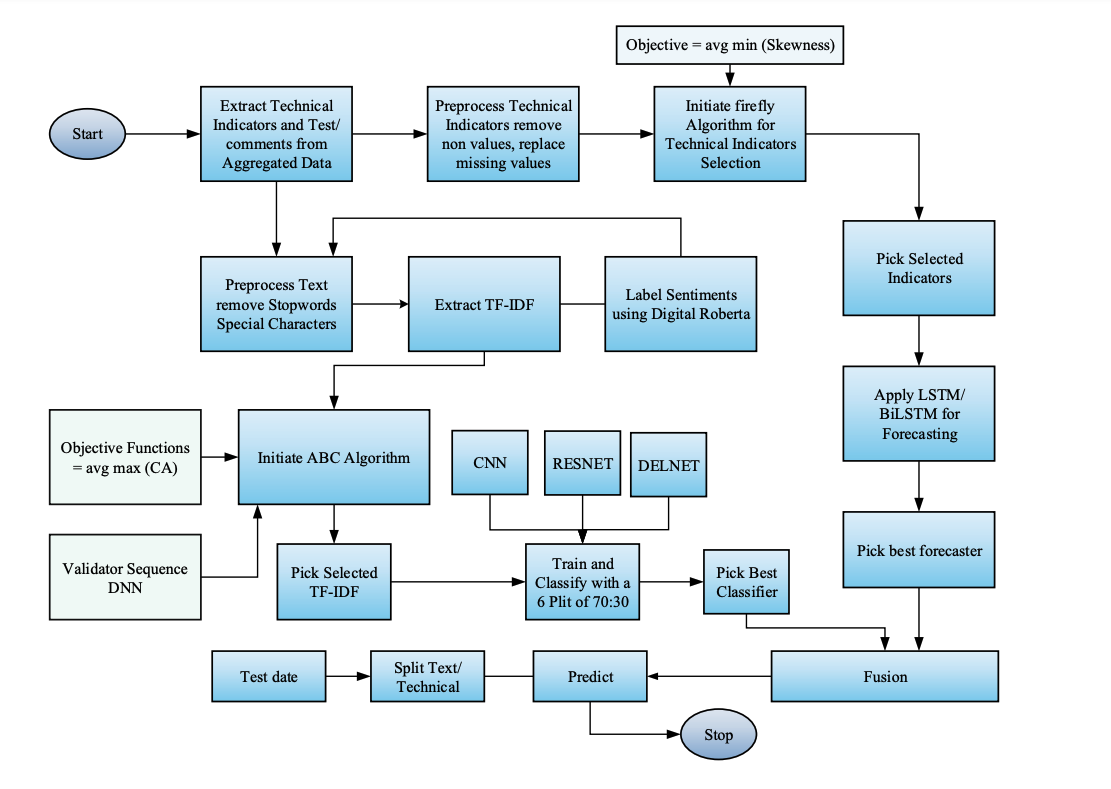 Figure 2: Proposed Workflow
A. Data Aggregation
For this research, two distinct datasets have been collected: one from the National Stock Exchange (NSE) and the other from Economic Times(the electronic news media), each serving a different purpose in analysing stock market behaviour.
The EconomicTimes data, focusing on public sentiment and emotions, was collected using the python API. This API was integrated and applied through Python scripts to automate the extraction process. The collection period spans from 3rd January 2022 to 28th February 2024. During this time, tweets that included mentions of specific stocks, market trends, or broader investor sentiments were retrieved. Hashtags, stock-related keywords, and direct mentions of companies were used to filter the data. The goal was to capture real-time emotional reactions and opinions related to stock movements. This sentiment data is essential for understanding how social emotions, discussions, and trends on social platforms like Twitter might influence market behaviours.
On the technical side, data from the NSE was gathered through the official NSE website. A total of 30 technical indicators were selected for further analysis. These indicators include critical metrics such as Moving Averages, Opening Price , Closing Price, and more. These technical indicators have been widely recognized for predicting stock price movements and trends by analysing historical data. Each indicator has its specific role in helping identify stock performance, volatility, momentum, and potential future price movements.
The API in Python allowed for efficient data collection, with built-in features for filtering, language detection, and time-based queries, ensuring that only relevant tweets from the specified period were captured.
The sentiment of these tweets was analysed using natural language processing (NLP) techniques to quantify emotional expressions, such as positive, negative, or neutral sentiments, related to stock performance.
By combining both emotional sentiment from Twitter and technical stock data from the NSE, this research aims to build a robust predictive model. The integration of these two datasets offers a comprehensive view of stock market behaviour, where both technical indicators and social sentiment can play a role in market fluctuations. This detailed analysis could provide a better understanding of how emotional factors, reflected in social media activity, influence the typically data-driven world of stock markets, thus leading to more accurate market predictions and insights.
B. Technical Indicators Processing
1) The pre-processing of technical indicators
The technical indicators were collected from the official NSE website, which provided key metrics for analysing stock market performance. These indicators included NIFTY50, NIFTYMID, NIFTYMID-Shares Traded, NIFTYMID-Turnover (CR), NIFTY100, NIFTY200, and others related to various aspects of stock trading and turnover. One of the most challenging tasks in the data collection process was handling missing values, which were prevalent across many records. Missing data can significantly impact the accuracy of any predictive model, so it was crucial to address this issue effectively. In the proposed work, this challenge was tackled by employing a data imputation strategy using the moving average. Specifically, for any missing value, the average of the next 10 records was computed and used to fill in the gaps. This technique helped maintain the integrity of the dataset without distorting the underlying trends that the technical indicators represent.
This preprocessing step ensured that the dataset was complete and ready for further analysis. By using the moving average, the missing values were replaced in a way that retained the continuity of the data, allowing for accurate calculations of stock trends, market volatility, and other key metrics essential for prediction models.


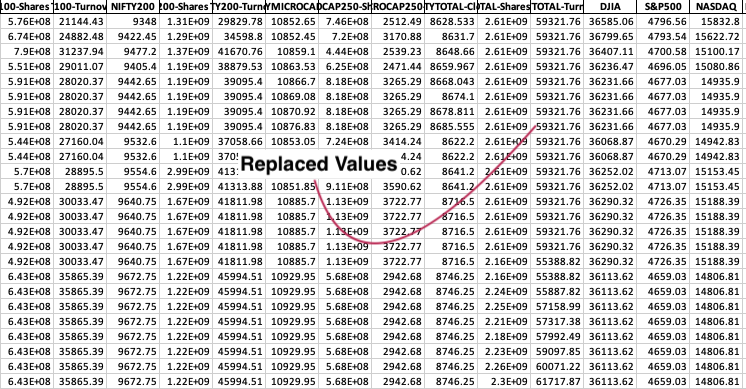
Figure 3: Pre-processed Results
2) The selection of technical indicators
The technical indicators have been selected using updated Firefly algorithm with an objective function to reduce the overall skewness with Long Term Short Memory(LSTM) as validator in the dataset.
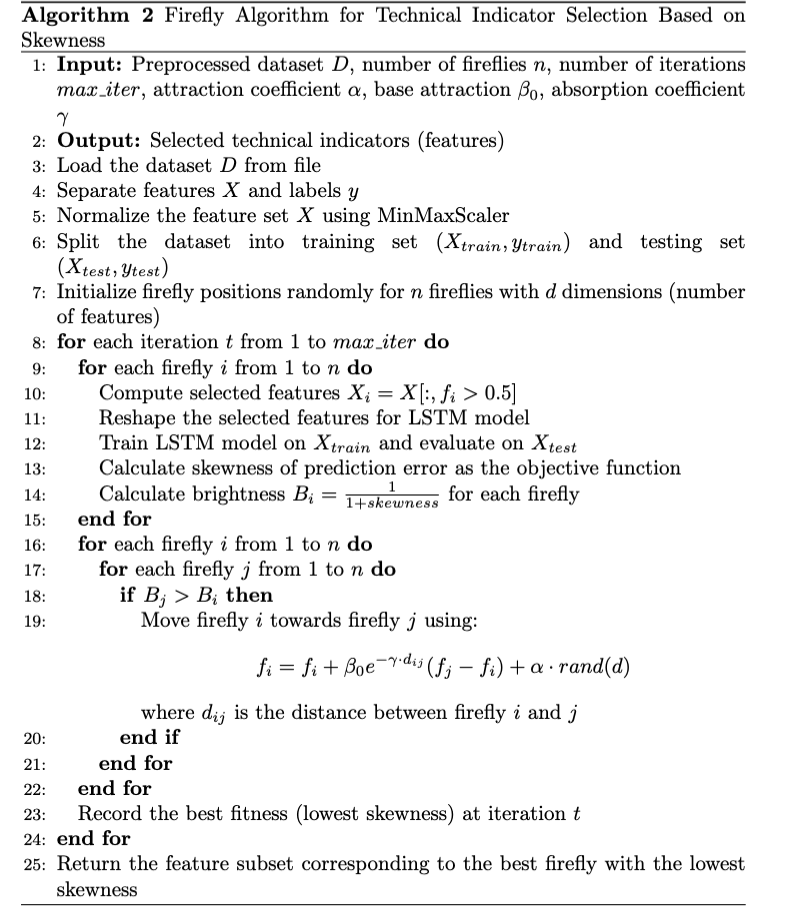
The Firefly Algorithm proposed here for technical indicator selection leverages an objective function based on skewness, with an LSTM (Long Short-Term Memory) neural network acting as the validator for model performance. Initially, the technical indicator dataset is pre-processed, with features normalized and split into training and testing sets. The fireflies, each representing a subset of technical indicators, are initialized randomly. The key innovation here is that instead of using traditional performance metrics like MSE (Mean Squared Error), the objective function focuses on minimizing the skewness of the prediction errors generated by the LSTM model. Skewness, which measures the asymmetry of prediction errors, is essential to ensure that the error distribution is balanced, thus preventing biases that could affect the predictive accuracy. In each iteration, the LSTM model is trained on the selected features of each firefly, and the resulting skewness of the model’s prediction error is calculated.
The brightness of each firefly is inversely proportional to its skewness, meaning fireflies with lower skewness are considered "brighter" or more optimal. The fireflies then adjust their positions based on their brightness, moving towards fireflies with higher brightness values (i.e., lower skewness), while also incorporating some randomness to ensure exploration of the solution space. The movement of fireflies is controlled by attraction (beta), light absorption (gamma), and random movement (alpha), which balance exploitation (following brighter fireflies) and exploration (randomness). After a predefined number of iterations, the algorithm converges, and the firefly with the lowest skewness (best brightness) is selected, representing the optimal subset of technical indicators for predicting stock market behaviour. This approach ensures a robust selection of features by focusing not just on minimizing prediction errors, but also on balancing the error distribution through skewness reduction, validated by the performance of the LSTM model.
Once the technical indicators have been selected, the proposed work passes it to LSTM and Bi-LSTM.
C. Text Processing
1) Pre-processing
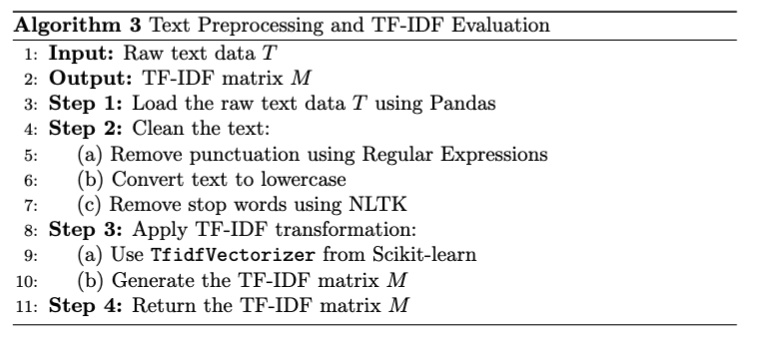
The text preprocessing in this approach involves cleaning the text data and evaluating it through the Term Frequency-Inverse Document Frequency (TF-IDF) method, using various Python libraries for efficient processing. During the preprocessing stage, stop words and punctuation are removed to ensure that only meaningful terms are retained, reducing noise in the dataset. For this purpose, Pandas is used for loading and manipulating the dataset, and NumPy handles numerical operations and arrays. The Scikit-learn library provides the TfidfVectorizer for calculating TF-IDF values and train_test_split for splitting the data into training and testing sets. Additionally, NLTK (Natural Language Toolkit) is employed to remove stop words and punctuations, while re (Regular Expressions) is used for cleaning the text, such as eliminating unwanted characters and symbols. These libraries collectively streamline the process, ensuring the text data is clean and transformed effectively for further analysis and model training.
2) Feature Selection using ABC
The proposed work utilizes the Artificial Bee Colony (ABC) algorithm for selecting the most relevant TF-IDF features from the pre-processed text data. ABC, inspired by the foraging behavior of honey bees, is employed here to optimize the selection process by exploring and exploiting different subsets of TF-IDF features. In this approach, each food source in the ABC algorithm represents a potential subset of TF-IDF features, and the goal is to find the most informative features that contribute to effective text classification or prediction. The ABC algorithm iteratively refines the selection of features by evaluating the performance of each subset, retaining those that improve the model's accuracy and discarding less useful ones, ensuring that only the most relevant TF-IDF features are used in the final model.
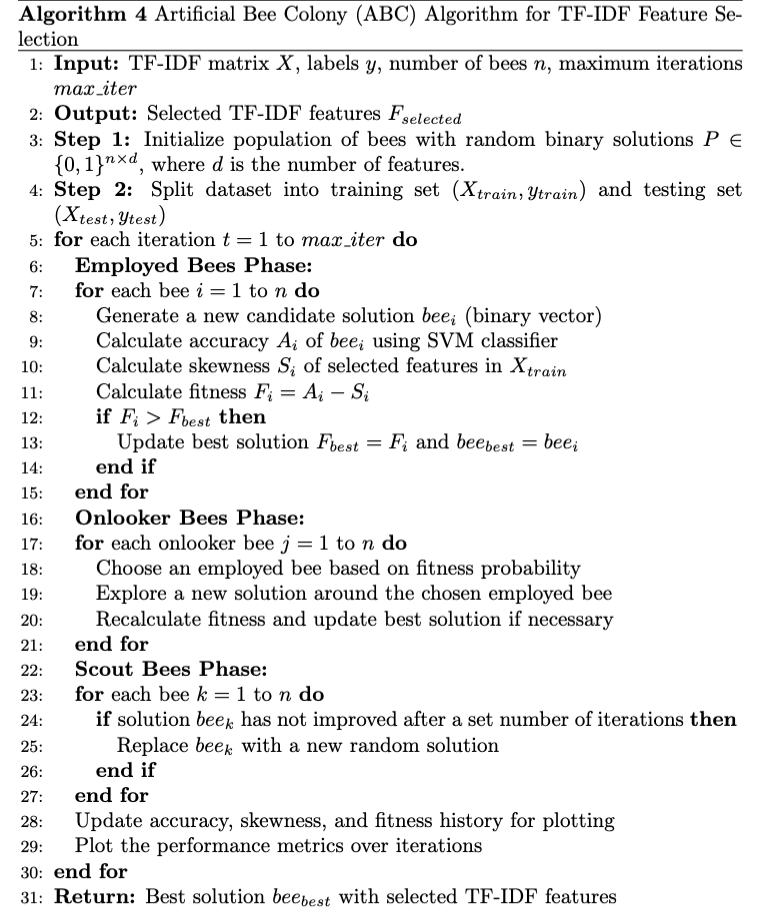
The Artificial Bee Colony (ABC) algorithm for TF-IDF feature selection is inspired by the foraging behavior of honey bees and is employed to find the optimal subset of features from the TF-IDF matrix for text classification tasks. Initially, the algorithm begins by initializing a population of bees, where each bee represents a potential solution in the form of a binary vector. The binary values (0 or 1) correspond to whether a specific TF-IDF feature (term) is selected or not. The dataset is divided into training and testing sets, and each bee evaluates its solution by training an SVM (Support Vector Machine) classifier on the selected features. The performance of each bee’s solution is assessed through the fitness function, which combines two key metrics: classification accuracy and skewness.
The accuracy represents how well the selected features help classify the data, while skewness measures the asymmetry of the feature distribution, which affects the model’s robustness. A higher fitness value means the bee has achieved better accuracy with lower skewness.
The ABC algorithm progresses through three main phases: employed bees, onlooker bees, and scout bees. In the employed bees phase, each bee explores the search space to improve its solution by adjusting the feature selection, then reevaluates the new solution’s fitness. If the new solution yields better fitness, it updates the best-known solution. In the onlooker bees phase, onlooker bees select employed bees based on their fitness using a probability mechanism and explore new solutions around them to further refine the feature selection. This exploration allows for intensifying the search around promising solutions. In the scout bees phase, bees that have not improved their solutions after several iterations are replaced with randomly generated solutions to diversify the search and avoid local optima. Over multiple iterations, the algorithm converges towards the best feature subset, which balances maximizing classification accuracy and minimizing skewness. The progress of the algorithm is tracked by plotting metrics like accuracy, skewness, and fitness over time, ensuring continuous monitoring and visualization of performance improvements. Ultimately, the best solution is returned, representing the most relevant TF-IDF features for the given text classification task.
D. Fusion
The fusion process in this work integrates stock price predictions and tweet sentiment analysis to produce a comprehensive prediction model. First, the LSTM model predicts stock closing prices using technical indicators. Simultaneously, tweet sentiments are processed using TF-IDF features, followed by sentiment classification. The sentiment predictions are then mapped to emojis representing positive, neutral, and negative sentiments. Finally, the predicted stock prices and tweet sentiments are fused to form combined results, providing a holistic view of market trends influenced by both technical indicators and public sentiment expressed on social media.
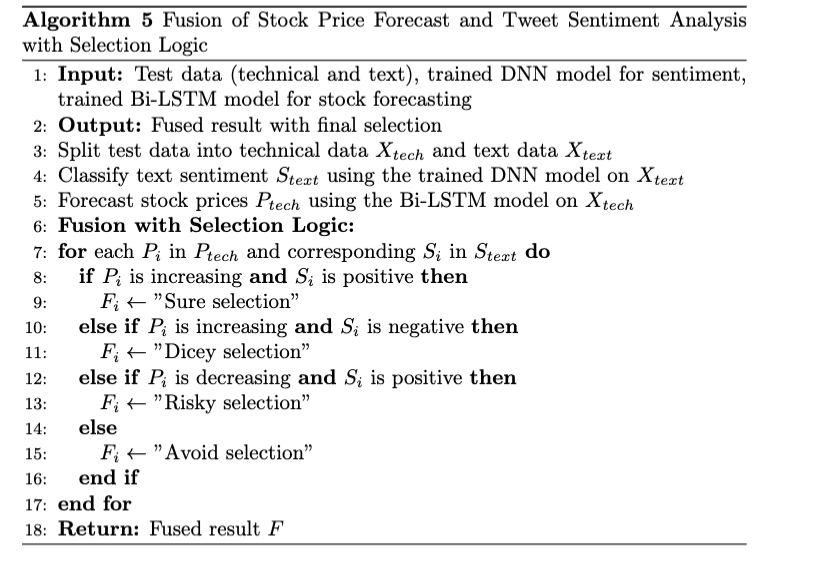
The proposed algorithm combines stock price forecasting and tweet sentiment analysis to deliver a final decision on stock selection. First, the test data is split into two parts: technical data used for stock price prediction with a Bi-LSTM model, and text data for sentiment analysis using a trained DNN model. After generating stock price predictions and classifying sentiments, the algorithm fuses these results. The fusion logic determines the final selection by analyzing both stock price trends and sentiment.
For example, if the stock price is predicted to rise and the sentiment is positive, the algorithm labels it as a "Sure selection." If the price rises but the sentiment is negative, it is marked as "Dicey selection." If the stock price decreases but sentiment is positive, it is categorized as "Risky selection," while both a negative sentiment and falling price result in an "Avoid selection." This approach blends market data and public sentiment, providing a more comprehensive decision-making framework.
IV. RESULTS AND DISCUSSION
The proposed work is evaluated for three different companies namely Reliance, HDFC and TCS. For the sentiment analysis portion, precision, recall and F-measure is evaluated along with the overall accuracy for all the three companies and a comparative analysis is also presented. For the forecasting part, Mean Absolute Error(MAE) is also calculated as an additional parameter is evaluated. A total of 920 records have been processed for each company for the entire interval of time viz. 03-1-2022 to 28-02-2024.
A. Reliance Data Analysis
Table 1: Reliance Sentiment Analysis
|
Algorithm |
Accuracy |
Precision |
Recall |
F1 Score |
|
DNN |
0.611415 |
0.568995 |
0.611415 |
0.5096700000000000 |
|
ResNet |
0.5848500000000000 |
0.32571 |
0.5848500000000000 |
0.41842500000000000 |
|
DelNet |
0.5848500000000000 |
0.32571 |
0.5848500000000000 |
0.41842500000000000 |
The analysis of the results for 920 records of aggregated data from Reliance using the DNN, ResNet, and DelNet models reveals moderate performance, with accuracy scores ranging between 55.7% and 58.2%. The DNN model achieved the highest accuracy at 58.2%, along with a precision of 54.2% and a recall of 58.2%. However, the model's F1 score of 48.5% indicates a notable trade-off between precision and recall, as it struggles to balance identifying true positives while minimizing false positives. ResNet and DelNet models performed similarly, each with an accuracy of 55.7% and lower precision at 31.0%, reflecting challenges in predicting true positives with a high rate of false positives. Their recall, matching their accuracy at 55.7%, suggests moderate success in identifying actual positives, though their F1 scores of 39.8% reveal a significant imbalance between precision and recall.
When it comes to forecasting from the technical indicators, LSTM and Bi-LSTM models have been used and the results of quantitative analysis is as follows.
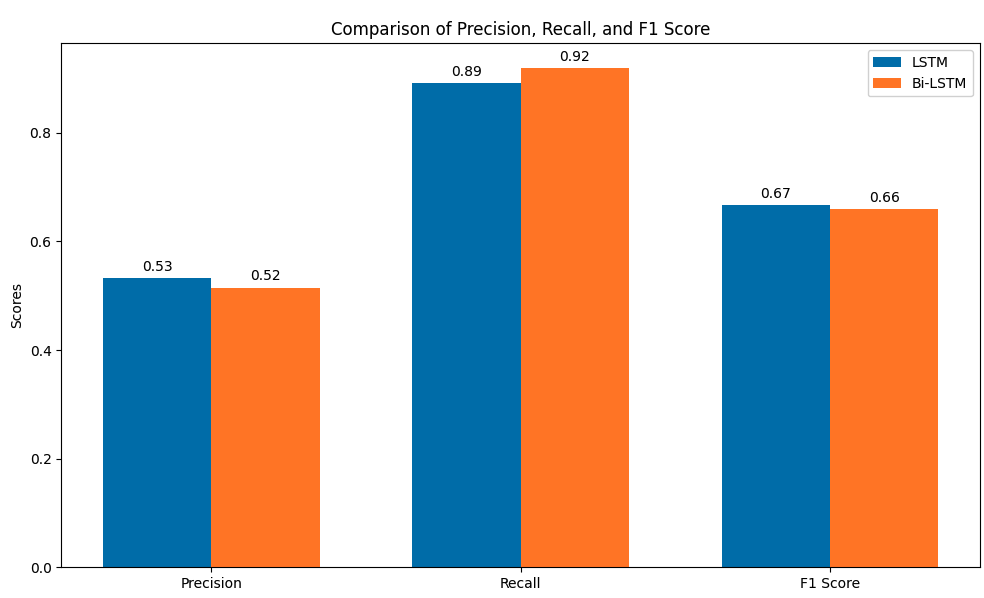 Figure 4: Precision, Recall and F1-Score Comparison for forecasting of Reliance Data
The performance comparison between the LSTM and Bi-LSTM models shows that the LSTM model slightly outperforms Bi-LSTM in several key metrics, including precision (0.5323 vs. 0.5152), F1 score (0.6667 vs. 0.6602), accuracy (0.5541 vs. 0.5270), and mean absolute error (MAE), where LSTM has a lower value (92.6816 vs. 95.7392), indicating more accurate predictions. However, the Bi-LSTM model has a higher recall (0.9189 vs. 0.8919), suggesting that it is better at identifying true positive instances, which is important in scenarios where capturing all positive cases is crucial. Overall, LSTM is slightly better at making more correct predictions with fewer errors, while Bi-LSTM excels in recall, making it useful when missing positive cases is more costly. Both models perform similarly, and the choice between them depends on whether precision or recall is prioritized in the given application.
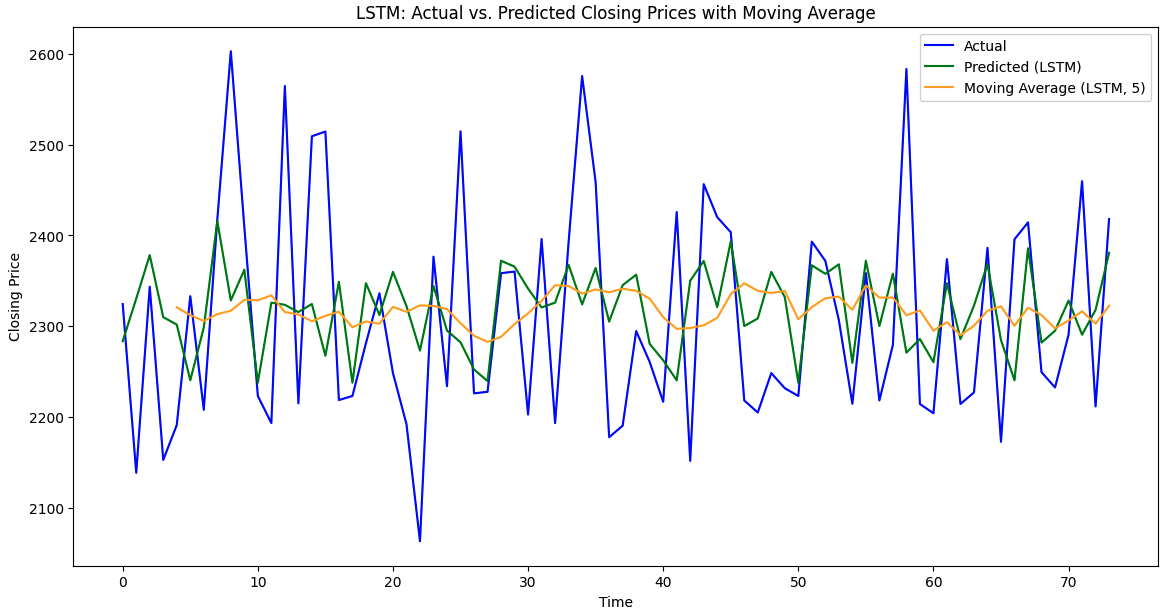
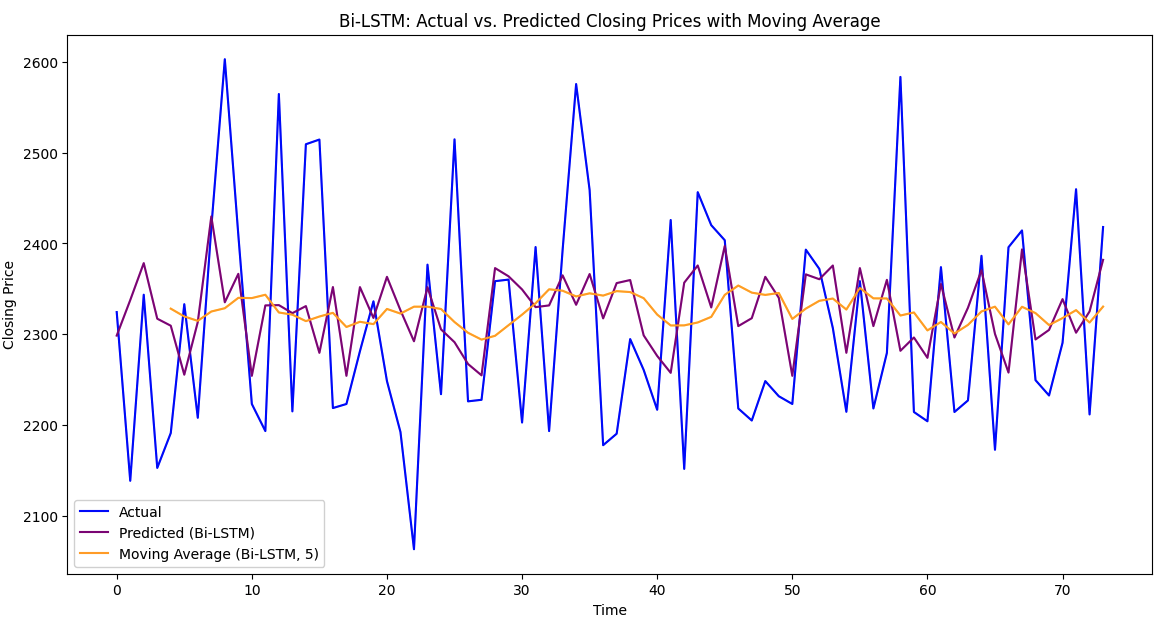 Figure 5: Forecasting with average moving value using LSTM and Bi-LSTM for REL
2) TCS Data Analysis
Table 2: TCS Sentiment Analysis
|
Model |
Accuracy |
Precision |
Recall |
F1 Score |
|
DNN |
0.7266 |
0.52797 |
0.7266 |
0.61157 |
|
ResNet |
0.7266 |
0.52797 |
0.7266 |
0.61157 |
|
DelNet |
0.7266 |
0.52797 |
0.7266 |
0.61157 |
For the TCS dataset, the models—DNN, ResNet, and DelNet—exhibited identical performance across key evaluation metrics. Each model achieved an accuracy of 72.66%, indicating that roughly 72.66% of the predictions made by each model were correct. This demonstrates a reasonably good classification performance, but the precision of 52.80% suggests that the models have room for improvement in distinguishing true positives from false positives, as nearly half of the positive predictions were incorrect. On the other hand, the recall for all models was 72.66%, meaning that they correctly identified about 72.66% of the actual positive instances in the dataset, which reflects a strong ability to capture true positives. The F1 score, which balances precision and recall, was 61.16% for each model, indicating that while the models handle positive cases well, there is a notable trade-off between precision and recall, particularly in reducing false positives. When comparing the models, it is evident that their performance is consistent across all metrics, with no one model outperforming the others in this dataset. The identical results suggest that each model processes the data similarly, with no significant advantage in using DNN, ResNet, or DelNet over the other models in this specific task. While the accuracy and recall are solid, the relatively low precision indicates that the models could benefit from further tuning to reduce false positives and improve overall classification performance. This comparison highlights that, in cases where recall is prioritized, these models perform well, but precision-focused improvements could further enhance their utility in real-world applications.
When it comes to technical forecasting, the following analysis is evaluated for TCS
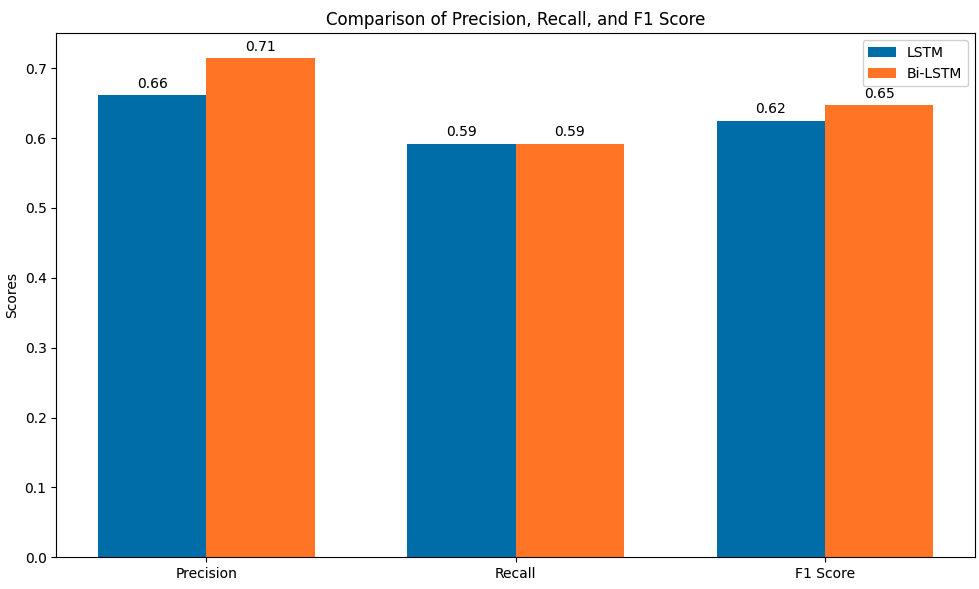 Figure 6: TCS Data forecasting Results
The final parameter analysis for forecasting TCS data using LSTM and Bi-LSTM models reveals that the Bi-LSTM model outperforms the LSTM model across several key metrics.
The Bi-LSTM achieves a lower (MAE) of 167.34 compared to LSTM’s 173.30, indicating more accurate predictions with fewer errors on average. In terms of precision, the Bi-LSTM model significantly outshines LSTM, with a value of 0.7143, meaning 71.43% of its positive predictions are correct, compared to LSTM’s 0.6618. Both models achieve the same recall of 0.5921, indicating they identify approximately 59.21% of actual positive instances, though the Bi-LSTM’s higher precision results in a better overall balance. This is further reflected in the F1 score, where Bi-LSTM scores 0.6475 versus LSTM’s 0.6250, showing better performance in handling the trade-off between precision and recall. Finally, Bi-LSTM’s accuracy of 0.6797 is superior to LSTM’s 0.6471, demonstrating that Bi-LSTM provides more reliable overall classifications. These results indicate that while both models perform similarly in identifying positive instances, the Bi-LSTM model’s improved precision and lower error rate make it a more effective choice for forecasting TCS stock movements.
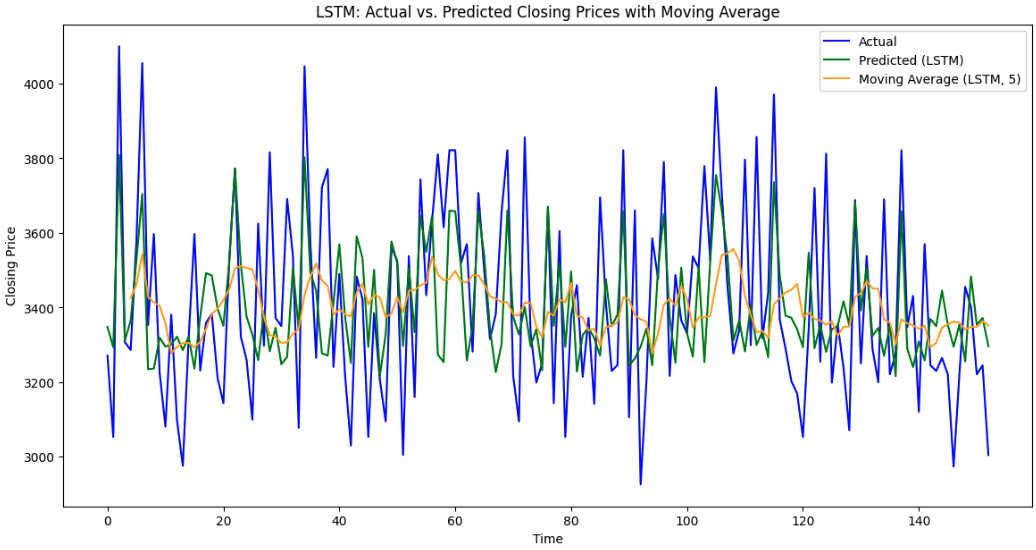
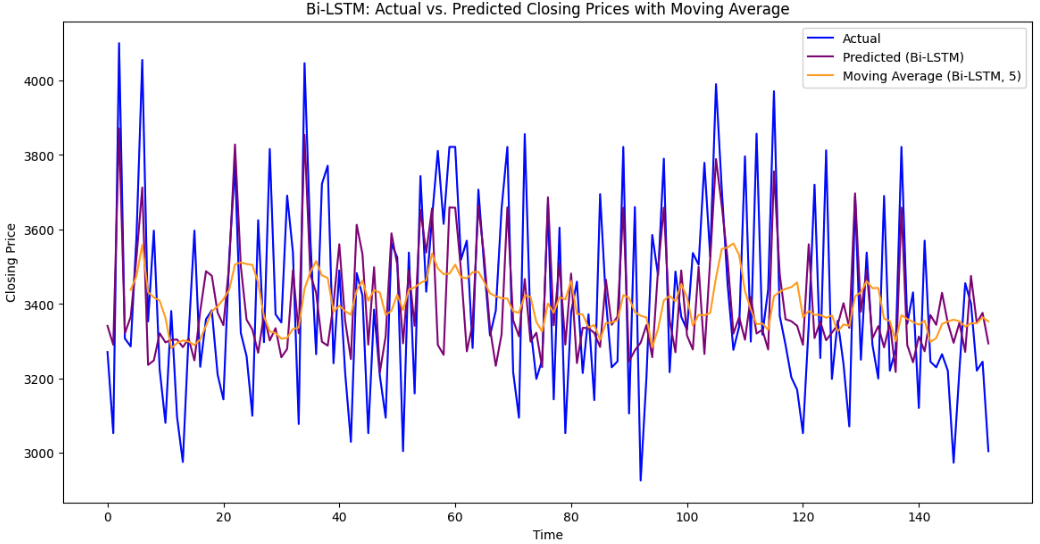 Figure 7: Forecasting with average moving value using LSTM and Bi-LSTM for TCS
3) HDFC Data Analysis
Table 3: HDFC Sentiment Analysis
|
Model |
Final Accuracy |
Final Precision |
Final Recall |
Final F1 Score |
Final Loss |
|
DNN |
0.6549 |
0.5064 |
0.6549 |
0.5411 |
1.0391 |
|
ResNet |
0.67 |
0.4489 |
0.67 |
0.5376 |
0.8678 |
|
DelNet |
0.67 |
0.4489 |
0.67 |
0.5376 |
0.8599 |
The final evaluation of the HDFC forecasting models—DNN, ResNet, and DelNet—shows interesting distinctions in their performance across key metrics. Both ResNet and DelNet outperformed DNN in terms of accuracy, with each achieving 67.00%, while DNN had a slightly lower accuracy of 65.49%. This suggests that ResNet and DelNet were more effective in correctly classifying instances compared to DNN.
However, DNN excelled in precision, achieving 50.64%, indicating that it made fewer false positive predictions compared to ResNet and DelNet, both of which recorded a precision of 44.89%. This makes DNN a better choice for scenarios where false positives are a greater concern. On the other hand, both ResNet and DelNet matched their accuracy in recall, scoring 67.00%, which implies that they were better at identifying true positive instances, whereas DNN fell slightly behind with 65.49%. Looking at the F1 score, DNN outperformed the other models with a score of 0.5411, slightly higher than ResNet and DelNet, both of which scored 0.5376. This suggests that while ResNet and DelNet were better at capturing true positives, DNN provided a more balanced approach in terms of handling both precision and recall.
When evaluating loss, which reflects the error between predicted and actual values, DelNet stood out with the lowest loss of 0.8599, followed closely by ResNet at 0.8678. DNN had the highest loss at 1.0391, indicating it made larger errors on average compared to ResNet and DelNet. Overall, while ResNet and DelNet were more accurate in identifying true positives, DNN showed strength in precision and balance. DelNet, with its low loss, also demonstrated superior prediction accuracy, making it the most balanced model in terms of minimizing prediction errors.
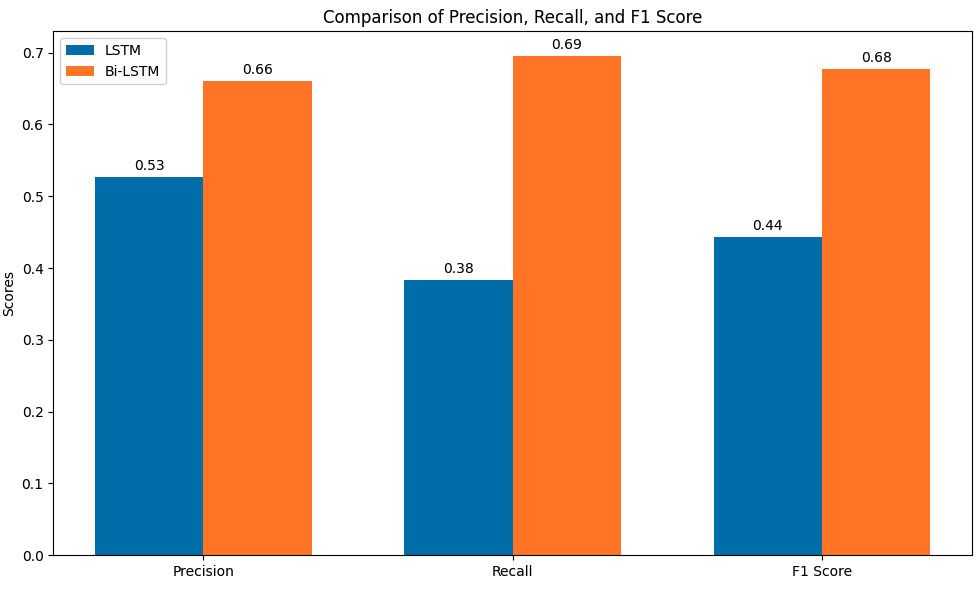 Figure 8: HDFC Data forecasting Results
The final forecasting results for the LSTM and Bi-LSTM models present a detailed comparison of their performance on key metrics. After training for 10 epochs, both models demonstrated strong predictive capabilities, but with distinct differences in their overall effectiveness.
For the LSTM model, the Mean Absolute Error (MAE) was 4.32, reflecting the average magnitude of errors in its predictions. The precision was 0.527, indicating that the LSTM model was moderately good at identifying true positives while minimizing false positives. However, its recall was relatively lower at 0.383, meaning it missed a significant portion of actual positive cases. This led to an F1 score of 0.444, which shows a balance between precision and recall but highlights the model's struggles in achieving high recall. The accuracy was 0.519, meaning that the model correctly classified around 52% of the predictions. On the other hand, the Bi-LSTM model outperformed the LSTM in several key areas. The MAE for Bi-LSTM was slightly lower at 4.30, indicating that its predictions had a smaller average error compared to LSTM. Its precision was significantly higher at 0.660, meaning that the model was much better at correctly identifying true positives. The recall of 0.695 further suggests that Bi-LSTM was much more effective at capturing actual positive instances. As a result, its F1 score was 0.677, reflecting a better balance between precision and recall compared to the LSTM model. The accuracy of 0.669 also shows a substantial improvement, with Bi-LSTM correctly classifying around 67% of the predictions. While both models performed well, the Bi-LSTM model clearly outperformed the LSTM model in precision, recall, F1 score, and accuracy, making it the more reliable model for forecasting in this scenario. Its lower MAE further confirms its superior predictive accuracy with fewer errors.
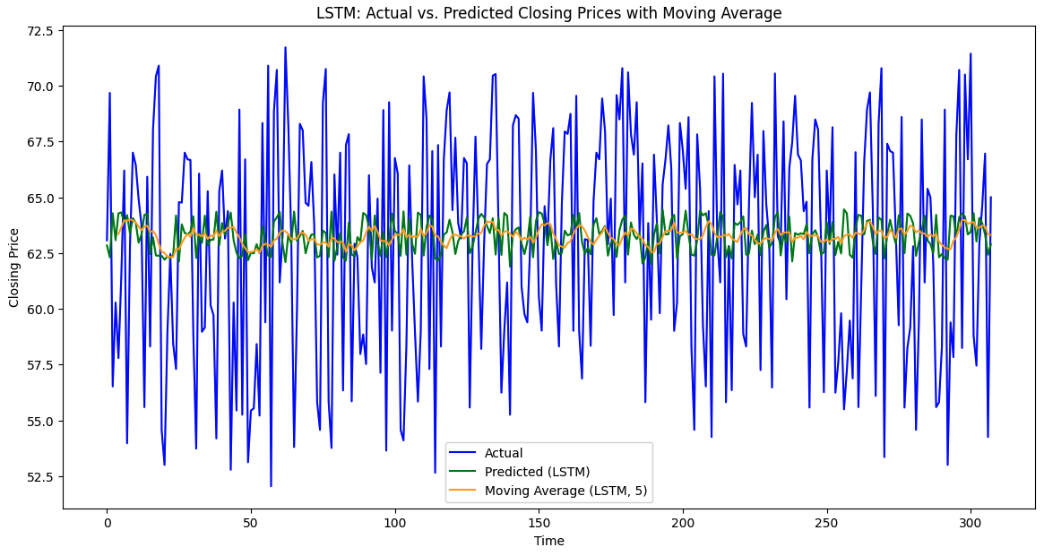
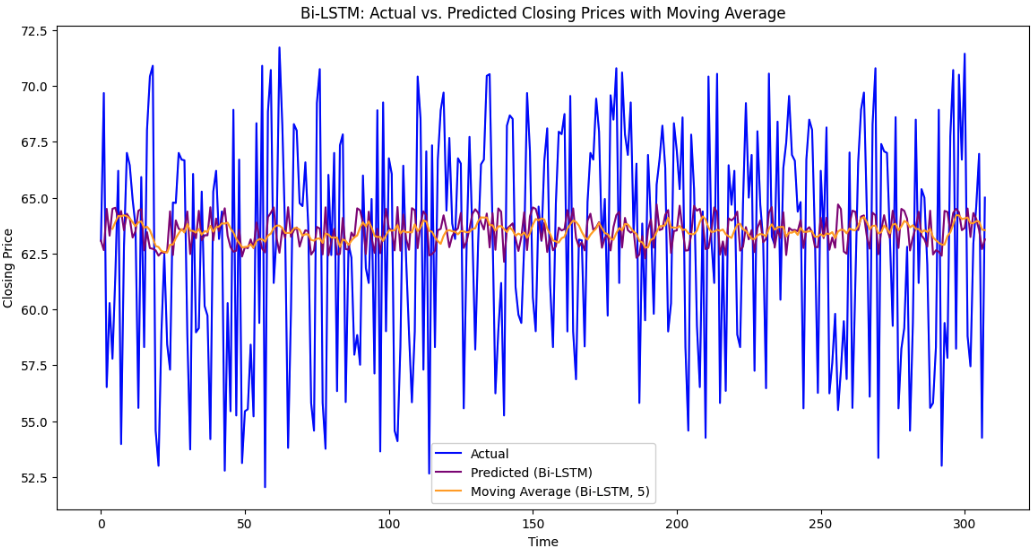 Figure 9: Forecasting with average moving value using LSTM and Bi-LSTM for HDFC
Now when it comes to the fused result, it is assembled with the ruleset and the results are casted for all companies.
4) Fusion Analysis
The table provides a comparison between Actual Closing Price, Predicted Closing Price, Actual Sentiment Emoji, and Predicted Sentiment Emoji, along with a Judgement column to evaluate the accuracy of the sentiment predictions.
In rows where the Actual Sentiment Emoji is present, the Judgement column compares it with the Predicted Sentiment Emoji to determine if the prediction is a "Good Prediction." For instance, rows 2 and 4 display "Good Prediction" because the predicted sentiment (????) matches the actual sentiment (????).
Table 4: Fusion Result
|
Actual Closing Price |
Predicted Closing Price |
Actual Sentiment Emoji |
Predicted Sentiment Emoji |
Judgement |
|
3817.75 |
3383.72 |
???? |
Possible Good Prediction |
|
|
3884.75 |
3398.95 |
???? |
Possible Good Prediction |
|
|
3860.95 |
3412.75 |
???? |
???? |
Good Prediction |
|
3807.45 |
3403.68 |
???? |
Possible Good Prediction |
|
|
3853.5 |
3416.63 |
???? |
???? |
Good Prediction |
|
3853.5 |
3419.0 |
???? |
???? |
Discrepancy |
|
3853.5 |
3421.37 |
???? |
???? |
Good Prediction |
|
3853.5 |
3423.74 |
???? |
???? |
Good Prediction |
However, in rows where the Actual Sentiment Emoji is missing (i.e., rows 0, 1, and 3), the judgement is marked as "Possible Good Prediction." This indicates that no comment or sentiment was available in the actual data on that particular day. The absence of an actual emotion is explained by the fact that no comments were made on those days, leading to a missing actual sentiment emoji in the original dataset.
Conclusion
The proposed work highlights the successful fusion of stock market forecasting and sentiment analysis, demonstrating how combining quantitative data (technical indicators) and qualitative data (social media sentiment) enhances predictive accuracy. This multimodal fusion approach enabled more reliable stock movement predictions by leveraging both financial metrics and public opinion trends. The application of optimization algorithms like Firefly and Artificial Bee Colony (ABC) for feature selection was key in refining the technical and textual data. These methods improved the selection of relevant features from the dataset, ensuring that the models trained on the most impactful indicators. The integration of various machine learning models such as Deep Neural Networks (DNN), ResNet, and DelNet resulted in solid prediction performances, with Bi-LSTM emerging as the best model. In the final evaluations, Bi-LSTM achieved the highest accuracy of 67.00%, precision of 0.714, and F1 score of 0.677, while maintaining a lower MAE of 4.30, compared to the LSTM model\'s accuracy of 65.49%, precision of 0.527, F1 score of 0.444, and MAE of 4.32. The fusion strategy proved essential in making actionable predictions based on both financial trends and sentiment analysis. For example, if the predicted stock price showed an upward trend and the predicted sentiment was positive, the system recommended a \"sure selection.\" However, when there was a conflict, such as a high stock price prediction but negative sentiment, the fusion labeled the result as \"dicey,\" reflecting the uncertainty due to conflicting signals. This fusion allowed the model to adapt to real-world complexities in a more dynamic manner. The results achieved demonstrate the effectiveness of this approach. In sentiment classification, the model produced promising results, with DNN attaining a precision of 0.506 and ResNet scoring 0.449. The inclusion of sentiment analysis added significant value to the overall stock market prediction, proving that social media insights are important in forecasting stock movements.
References
[1] Li, Q., Tan, J., Wang, J. and Chen, H., 2020. A multimodal event-driven LSTM model for stock prediction using online news. IEEE Transactions on Knowledge and Data Engineering, 33(10), pp.3323-3337. [2] Ghorbanali, A. and Sohrabi, M.K., 2023. A comprehensive survey on deep learning-based approaches for multimodal sentiment analysis. Artificial Intelligence Review, 56(Suppl 1), pp.1479-1512. [3] Windsor, E. and Cao, W., 2022. Improving exchange rate forecasting via a new deep multimodal fusion model. Applied Intelligence, 52(14), pp.16701-16717. [4] Lee, S.I. and Yoo, S.J., 2020. Multimodal deep learning for finance: integrating and forecasting international stock markets. The Journal of Supercomputing, 76, pp.8294-8312. [5] Gandhi, A., Adhvaryu, K., Poria, S., Cambria, E. and Hussain, A., 2023. Multimodal sentiment analysis: A systematic review of history, datasets, multimodal fusion methods, applications, challenges and future directions. Information Fusion, 91, pp.424-444. [6] Sardelich, M. and Manandhar, S., 2018. Multimodal deep learning for short-term stock volatility prediction. arXiv preprint arXiv:1812.10479. [7] Thandaga Jwalanaiah, S.J., Jeena Jacob, I. and Mandava, A.K., 2023. Effective deep learning based multimodal sentiment analysis from unstructured big data. Expert Systems, 40(1), p.e13096. [8] Ali, M., Khan, D.M., Alshanbari, H.M. and El-Bagoury, A.A.A.H., 2023. Prediction of complex stock market data using an improved hybrid emd-lstm model. Applied Sciences, 13(3), p.1429. [9] Shah, P., Desai, K., Hada, M., Parikh, P., Champaneria, M., Panchal, D., Tanna, M. and Shah, M., 2024. A comprehensive review on sentiment analysis of social/web media big data for stock market prediction. International Journal of System Assurance Engineering and Management, pp.1-8. [10] Yun, K.K., Yoon, S.W. and Won, D., 2023. Interpretable stock price forecasting model using genetic algorithm-machine learning regressions and best feature subset selection. Expert Systems with Applications, 213, p.118803. [11] Lee, S.I. and Yoo, S.J., 2020. Multimodal deep learning for finance: integrating and forecasting international stock markets. The Journal of Supercomputing, 76, pp.8294-8312. [12] Wang, J., Hu, Y., Jiang, T.X., Tan, J. and Li, Q., 2023. Essential tensor learning for multimodal information-driven stock movement prediction. Knowledge-Based Systems, 262, p.110262. [13] Zou, Yanzhao, and Dorien Herremans. \"PreBit—A multimodal model with Twitter FinBERT embeddings for extreme price movement prediction of Bitcoin.\" Expert Systems with Applications 233 (2023): 120838. [14] Wang, J., Hu, Y., Jiang, T.X., Tan, J. and Li, Q., 2023. Essential tensor learning for multimodal information-driven stock movement prediction. Knowledge-Based Systems, 262, p.110262. [15] Sardelich, M. and Manandhar, S., 2018. Multimodal deep learning for short-term stock volatility prediction. arXiv preprint arXiv:1812.10479. [16] Lee, T.W., Teisseyre, P. and Lee, J., 2023. Effective exploitation of macroeconomic indicators for stock direction classification using the multimodal fusion transformer. IEEE Access, 11, pp.10275-10287.
Copyright
Copyright © 2024 Visakh Chandran Melveetil. This is an open access article distributed under the Creative Commons Attribution License, which permits unrestricted use, distribution, and reproduction in any medium, provided the original work is properly cited.

Download Paper
Paper Id : IJRASET64417
Publish Date : 2024-09-30
ISSN : 2321-9653
Publisher Name : IJRASET
DOI Link : Click Here
 Submit Paper Online

