Ijraset Journal For Research in Applied Science and Engineering Technology
- Home / Ijraset
- On This Page
- Abstract
- Introduction
- Conclusion
- References
- Copyright
Analytical Method Development and Validation of RP-HPLC Method for Estimation of Venetoclax in Pharmaceutical Dosage Form
Authors: Shubham Rasal, Vijay Kumar Munipalli, Sayali Warde, Smita Nayak, Bhaskar Vaidhun
DOI Link: https://doi.org/10.22214/ijraset.2024.64136
Certificate: View Certificate
Abstract
A simple and new isocratic high-performance liquid chromatography (HPLC) method was developed for the quantitative determination of Venetoclax in its tablet dosage form. The chromatographic separation was achieved on Perkin C8 (15cm x 4.6mm id, 5µ) column. The mobile phase selected was buffer (25 mm ammonium acetate) adjusted to pH 3.0 with orthophosphoric acid and acetonitrile in the ratio of (55:45) v/v at a flow rate of 0.7ml/min with column temperature maintained at 400C and 10µl injection volume. The detection was carried out at 286nm by a UV-visible detector. The retention time of Venetoclax was found to be 4.19 minutes. The proposed method was linear over the range of 5-50µg/ml with a correlation coefficient (R2) of 0.9998. The limits of detection and quantification values were found to be 0.53µg/ml and 1.62µg/ml respectively. All validation parameters were within the limits as per the ICH guidelines. The results of validation parameters indicate that the developed HPLC method was specific, accurate, precise, rapid, reliable and reproducible, therefore it can be applied for routine quality control analysis of Venetoclax in its tablet dosage form.
Introduction
I. INTRODUCTION
Venetoclax is a medication used to treat adults with chronic lymphocytic leukemia (CLL), small lymphocytic lymphoma (SLL) and acute myeloid leukemia (AML). Venetoclax attaches to a protein called Bcl-2. This protein is present in high amounts in the CLL cancer cells, where it helps the cells survive for longer in the body and makes them resistant to cancer medicines. By attaching to Bcl-2 and blocking its actions, Venetoclax causes the death of cancer cells and thereby slows down the progression of disease. The chemical name of Venetoclax is 4-(4-{[2-(4-Chlorophenyl)-4,4-dimethyl-1-cyclohexen-1-yl]methyl}-1-piperazinyl)-N-({3-nitro-4-[(tetrahydro-2H-pyran-4-ylmethyl)amino]phenyl}sulfonyl)-2-(1H-pyrrolo[2,3-b]pyridin-5-yloxy)benzamide (Figure 1). Its molecular formula is C45H50ClN7O7S having molecular weight 868.45 g/mol [1].
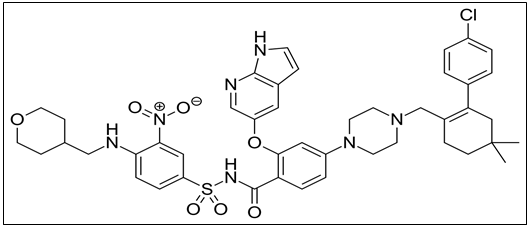
Figure 1 : Chemical Structure of Venetoclax
A. Literature Survey
Literature survey revealed only one UHPLC-MS/MS method for Venetoclax in rat plasma. No reliable or satisfactory RP-HPLC method was found for Venetoclax in pharmaceutical dosage forms. Hence attempts were made to develop a simple, rapid, precise, and accurate reverse phase chromatographic method to estimate Venetoclax in its tablet dosage form. The proposed method was optimized and validated as per ICH guidelines. The main objective is to give an overview of the mechanism of Reversed-Phase High Performance Liquid Chromatography and to explain the basis of the retention mechanism and achieve high-speed separation without loss of reproducibility.
II. INSTRUMENTATION WORK
A. Chemicals and Reagents
Venetoclax reference standard of defined potency 99.9% was procured from Central Drugs Testing Laboratory, Mumbai and Venclyxto (Venetoclax) 100mg film coated tablets manufactured by AbbVie Inc. were provided by Central Drugs Testing Laboratory, Mumbai. Acetonitrile (HPLC grade) from Merk Life science, methanol (HPLC grade) from Molychem, triethylamine from Rankem and orthophosphoric acid was from Avra. Ultra purified HPLC grade water was obtained from the Milli - Q® system (Millipore, Milford, MA, USA) water purification unit. The mobile phase was filtered using 0.45μ nylon filters by Axiva Sischem Pvt. Ltd. and was sonicated and degassed using a sonicator.
B. Instrumentation Work
Chromatographic research work was performed on Perkin Elmer HPLC System and Thermo Scientific Ultimate 3000 HPLC system equipped with a UV-visible detector. Data analysis and report generation were carried out using chameleon 7.4.2 software with LC instrument control. The wavelength of Venetoclax was determined on a Lab India UV visible spectrophotometer using UV Win software. Chromatographic separation was achieved on Perkin C8 (15cm x 4.6mm id, 5µ) column. For all weighing requirements a Sartorius Analytical Balance was used.
C. Determination of Wavelength
The standard solution 10 µg/ml of Venetoclax was scanned in the range of 400-200 nm against diluent as a blank. Venetoclax showed maximum absorbance at 286 nm as shown in Figure 2. So, the suitable wavelength selected for HPLC analysis was 286nm.
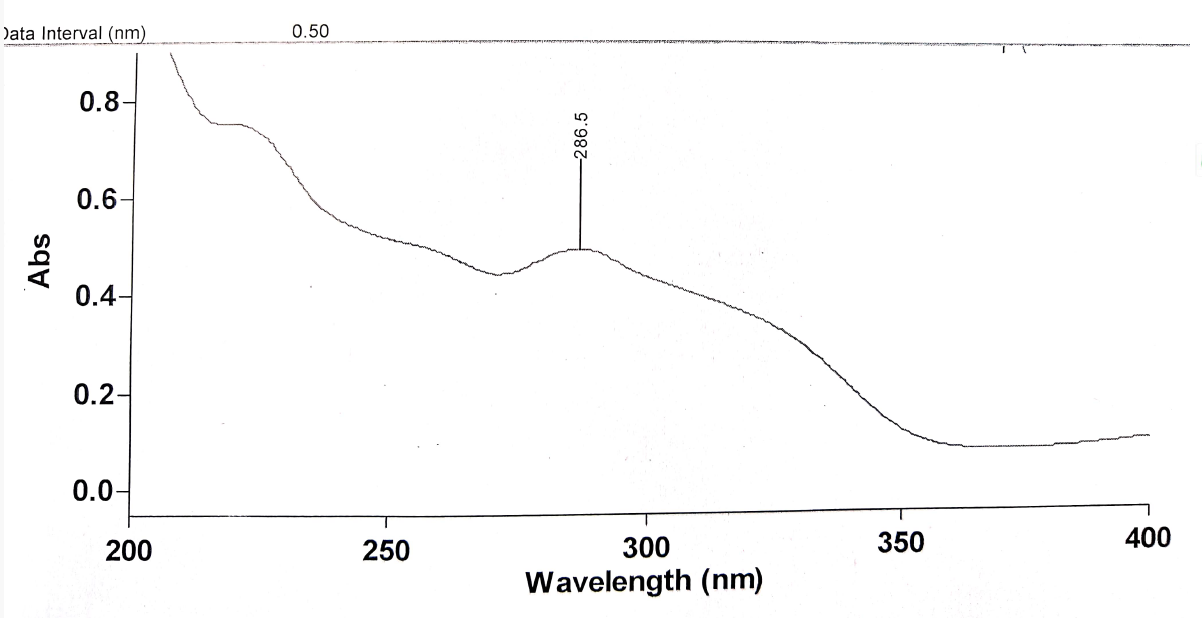 Figure 2 : UV Spectra of Venetoclax
D. Mobile Phase Preparation
Acetate Buffer (25 mM) and acetonitrile in a ratio of 55:45 v/v were used as a mobile phase for the present study. Two different ports were used for running of the mobile phase in isocratic form. Acetate buffer was prepared by dissolving 1.926 gm of Ammonium Acetate into 1000 ml HPLC grade water followed by adjusting pH to 3 with orthophosphoric acid. The mobile phase was sonicated for 10 minutes and degassed using an ultra sonicator. This preparation was then filtered by a 0.45µ mobile phase filter and thus used for the further chromatographic analysis.
E. Diluent Preparation
A mixture of acetonitrile and water in the ratio of 1:1 v/v was used for the preparation of the standard solutions and sample solutions of Venetoclax.
F. Preparation of Standard Solution
A standard stock solution of 100 µg/ml was prepared by accurately weighing 10.0 mg of Venetoclax and transferring it into a 100 ml volumetric flask. To this add 50.0 ml of diluent and dissolve the drug properly by sonicating for about 5 min, make up the solution to 100 ml with the diluent. Working standard solution of concentration 25 µg/ml of Venetoclax was obtained by pipetting out 5.0 ml of standard stock solution and transferring it into 20.0 ml volumetric flask and making up to the mark with the diluent.
G. Preparation of Sample Solution
About 5 film coated tablets of Venclyxto 100mg containing Venetoclax were weighed, and the average weight was calculated. The tablets were then crushed with the help of mortar pestle to create a fine powder that would dissolve quickly in the diluent. The powder equivalent to 100mg of drug was taken (around 1124.3 mg) and transferred into a 200ml volumetric flask making up to the mark with the diluent. This resulted in a 500 µg/ml sample stock solution. Final Sample solution of concentration 25 µg/ml of Venetoclax was obtained by pipetting out 5.0 ml of the above solution and transferring it into 100.0 ml volumetric flask and making up to the mark with the diluent.
H. Chromatographic Conditions
The mobile phase consisted of 25 mm (Approx 1.927gm) of Ammonium acetate adjusted to pH 3 with orthophosphoric acid and acetonitrile in the ratio of 55:45 v/v. The mobile phase was pumped through the column at a flow rate of 0.7 ml/min. Perkin C8 (15cm x 4.6mm id, 5µ) column was used for analysis at a column temperature maintained at 400 C. The sample injection volume was 10 µl. The UV detector was set to 286 nm for detection and the chromatographic runtime was kept for 10 minutes.
III. METHOD OPTIMIZATION
Based on the chemical nature of Venetoclax, different mobile phase systems and HPLC columns were tried to obtain a proper separation of the molecule. The initial trials were carried out on Perkin Elmer HPLC system using Inertsill C18 (4.6 x 250mm x 5 µm) column with a mobile phase consisting of 25mm KH2PO4 and Acetonitrile in the ratio of 70:30 v/v with an injection volume of 10µL and flow rate of 1ml/min. However, Broad peak shape was observed, and the theoretical plates were not in the acceptable limits. So for this reason this particular trial was rejected.
Further trials were carried out on Zorbax eclipse C8 (4.6 x 150mm x 5uL) column using 0.1% trifluroacetic acid and acetonitrile (50:50 v/v) as a mobile phase with a flow rate of 1ml/min and 10µL injection volume. However, poor peak shape was observed even after changing the column and varying the ratio of the mobile phase components. Thus, this specific trial was dismissed for this purpose.
Additional trials were carried out on Thermo Scientific Ultimate 3000 HPLC system on Perkin C8 (15cm x 4.6mm id, 5µ) column with a mobile phase consisting of 25 mm Ammonium acetate and Acetonitrile in the ratio of 70:30. With a flow rate of 0.8ml/min and 10µL injection volume. In this situation the peak was sharp but retention time of peak exceeded for about 10 minutes. For this reason the current trial was not taken into consideration.
The final trial was conducted by keeping all the conditions similar and slightly changing the mobile phase ratio of Acetate Buffer and Acetonitrile to 55:45. Including a flow rate of 0.7ml/min. Under these conditions, the peak was eluted with a good peak shape and acceptable system suitability parameters.
IV. METHOD VALIDATION
The developed RP-HPLC method was validated for system suitability testing, specificity, linearity, precision, accuracy and recovery, LOD, LOQ, and robustness as per ICH guidelines.
A. System Suitability Studies
System suitability is a set of pre-defined criteria that evaluate the performance of the HPLC system, encompassing factors such as resolution, peak symmetry, tailing factor, retention time, and peak area. This criteria is essential for consistent and precise analysis, as it confirms that the instrument is operating optimally and is capable of generating dependable data [2].
System suitability parameters were evaluated and analysed to check the system performance by injecting a working standard solution (six replicate) of concentration 25µg/ml and blank preparation (single injection) into the HPLC. The chromatograms were recorded to evaluate SST parameters like %RSD of Retention time, Tailing factor, Theoretical plates. Data of system suitability study is summarized in Table 1.
|
SYSTEM SUITABILITY STUDIES |
||||
|
Sr No. |
Peak Area |
Retention Time |
Theoretical Plates |
Tailing Factor |
|
1 |
14334.41 |
4.19 |
5109 |
0.770 |
|
2 |
14350.00 |
4.19 |
5105 |
0.770 |
|
3 |
14329.93 |
4.19 |
5129 |
0.770 |
|
4 |
14334.68 |
4.19 |
5065 |
0.770 |
|
5 |
14342.68 |
4.19 |
5109 |
0.770 |
|
6 |
14344.36 |
4.20 |
5160 |
0.770 |
|
Average |
143396.34 |
4.1928 |
51128.33 |
0.770 |
|
Std Deviation |
362565.28 |
0.0041258 |
31.19 |
0.00 |
|
%RSD |
0.55 |
0.10 |
0.61 |
0.00 |
|
Limit |
NMT 2.0 % |
NMT 1.0% |
NMT 2.0% |
NMT 2.0% |
Table No. 1 : System Suitability Data of Venetoclax.
B. Specificity
Specificity is the ability of the analytical method to distinguish between the analyte(s) and the other components in the sample matrix. In case of an HPLC method, it is assured by complete separation of peak(s) of analyte(s) from other peaks originated from the sample matrix. Specificity evaluation was done by injecting separately 25 µl solution of standard, sample, placebo, and blank into the chromatographic system. their chromatograms were recorded as represented in Figure 3,4,5 respectively [3].
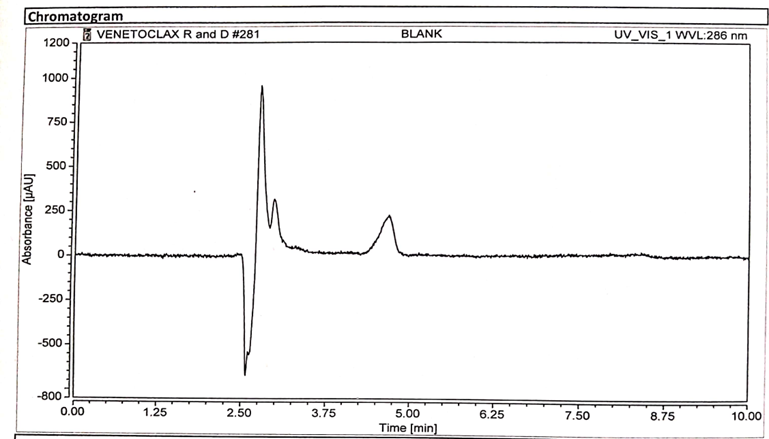
Figure 3 : Chromatogram of Blank Solution
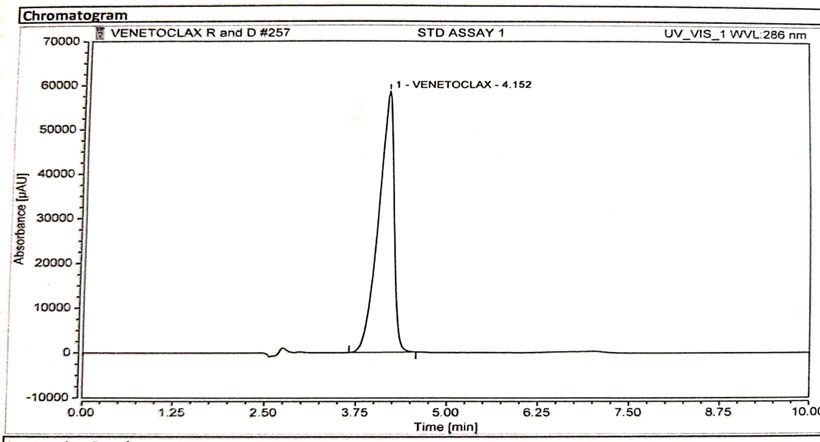
Figure 4 : Chromatogram of Standard Solution.
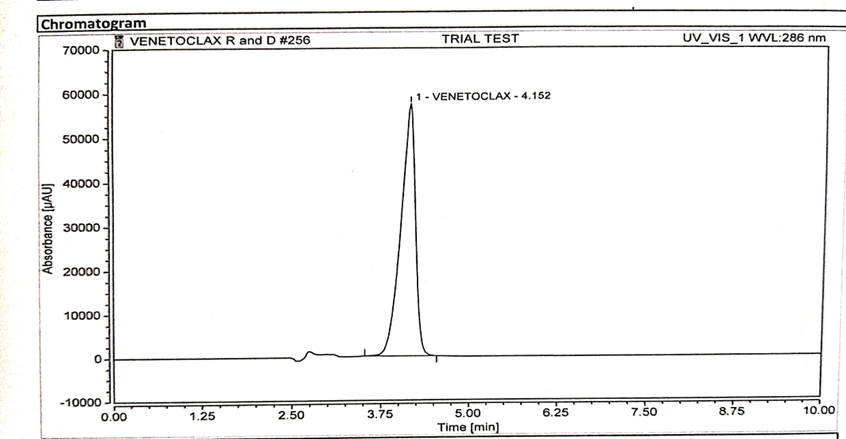
Figure 5 : Chromatogram of Sample Solution
C. Linearity
Linearity of a method is its ability to obtain test results that are directly proportional to the sample concentration over a given range. The capacity of an analytical process to produce test results that are directly proportional to the concentration of analyte in the sample (within a certain range) is referred to as linearity. If the method is linear, the test findings are proportional to the concentration of analyte in sample within a given range, either directly or through a well-defined mathematical transformation [4].
The linearity studies on Venetoclax were carried out in the concentration range of 5-50μg/mL and the correlation coefficient was found to be 0.9998. The regression equation obtained was found to be y=996.73x+607.34. The linearity graph was plotted by taking the concentration of the drug on the X-axis and the corresponding peak area on the Y-axis as shown in Fig 6.
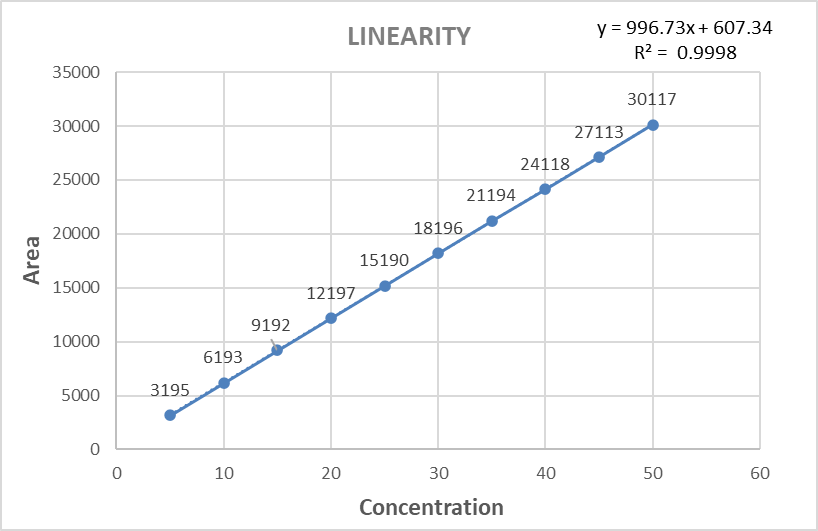
Figure. 6 : Calibration Curve of Venetoclax
D. Limit of Detection and Limit of Quantitation
Sensitivity of the proposed method was estimated in terms of LOD and LOQ. Limit of detection is the lowest concentration in a sample that can be detected, but not necessarily quantified, under the stated experimental conditions. Limit of quantification is the lowest concentration of analyte in a sample that can be determined with acceptable precision [5].
The ICH indicates that LOD (which they call DL, the detection limit) can be calculated as LOD = 3.3σ / S, and the limit of quantification (which they call QL, the quantitation limit) LOQ = 10σ / S. Where ‘s’ is the slope of the calibration curve and ‘σ’ is the standard deviation of the regression response. The values of the detection limit and quantification limit are calculated from calibration curve data. LOD and LOQ values are presented in Table No. 2.
|
Regression Statistics |
|
|
Linear Range |
5–50µg/ml |
|
Regression Equation |
y = 996.73× + 607.34 |
|
Slope |
996.73 |
|
Intercept |
607.34 |
|
R2 |
0.9998 |
|
Standard Deviation |
106.36 |
|
LOD |
0.53µg/ml |
|
LOQ |
1.62µg/ml |
Table No.2 : Sensitivity Data of Venetoclax .
E. Precision
Precision is the agreement between replicate measurements of the same sample. The precision of analytical procedure expresses the closeness of agreement between series of measurements obtained from multiple sampling of the same homogenous samples under the prescribed conditions. It is expressed as relative standard deviations of replicate measurements [6].
1) System Precision
The system precision evaluates the reliability of the analytical system to precisely measure the component while the method precision takes into account also the variability of the sample preparation. This parameter was performed by injecting six replicate injections of a standard solution (25 μg/mL) . The mean, SD, and %RSD of peak areas of six replicate injections were calculated and studied as per the ICH guidelines acceptance criteria. The results are summarized in Table No. 3.
2) Method Precision (Assay Repeatability)
Six replicate injections of 25µg/ml of standard solution and six replicate injections of 25µg/ml of sample solution were injected into the HPLC system. The %assay, mean, S.D., and %RSD were calculated and studied as per the ICH guidelines acceptance criteria. The results are summarized in Table No. 3.
|
System Precision |
Method Precision |
||
|
Sr. No. |
Area |
Sr. No. |
Assay |
|
1. |
14334.40 |
1. |
100.61 |
|
2. |
14349.99 |
2. |
100.57 |
|
3. |
14339.93 |
3. |
100.58 |
|
4. |
14334.68 |
4. |
100.14 |
|
5. |
14342.68 |
5. |
100.80 |
|
6. |
14344.35 |
6. |
100.06 |
|
Mean |
14339.34 |
Mean |
100.62 |
|
S.D. |
7.541 |
S.D. |
0.291 |
|
% RSD |
0.053 |
% RSD |
0.289 |
|
Limit |
NMT 2% |
Limit |
NMT 2% |
Table No. 3 : Precision Data of Venetoclax
3) Intra Day Precision
This was performed on day one at two different time intervals . Six replicate injections of 25µg/ml of standard solution and six replicate injections of 25µg/ml of sample solution were injected into the HPLC system. The assay, mean, S.D and %RSD were calculated and studied as per the ICH guidelines acceptance criteria. The data of Intra Day Precision summarised in Table. No.4.
|
Sr. No |
% Assay (11:00 AM) |
% Assay (3:00 PM) |
|
1. |
100.61 |
100.77 |
|
2. |
100.57 |
100.67 |
|
3. |
100.58 |
100.55 |
|
4. |
100.14 |
100.72 |
|
5. |
100.80 |
100.87 |
|
6. |
101.01 |
100.66 |
|
Mean |
100.62 |
100.71 |
|
S.D |
0.290 |
0.109 |
|
% RSD |
0.288 |
0.108 |
|
Limit |
NMT 2% |
NMT 2 % |
Table No. 4 : Intra-Day Precision Data of Venetoclax
4) Intermediate Precision
This was performed on two different days and different HPLC instruments. Six replicates of standard solution (25µg/ml) and three sample preparation (25µg/ml) in triplicates were injected into the HPLC system. Its % Assay, average, SD, %RSD were calculated and reported. Results are summarized in Table No. 5.
|
Sr. No |
% Assay Day 1 |
% Assay Day 2 |
% Assay Analyst 1 |
% Assay Analyst 2 |
|
1. |
101.36 |
100.52 |
99.81 |
99.72 |
|
2. |
100.95 |
99.57 |
99.67 |
99.58 |
|
3. |
101.06 |
101.2 |
99.88 |
99.46 |
|
4. |
101.33 |
98.51 |
99.68 |
99.71 |
|
5. |
101.12 |
101.00 |
99.62 |
99.68 |
|
6. |
101.33 |
100.06 |
99.79 |
99.75 |
|
Mean |
101.19 |
100.08 |
99.64 |
99.73 |
|
S.D. |
0.172 |
0.130 |
0.100 |
0.140 |
|
% RSD |
0.170 |
0.998 |
0.100 |
0.120 |
|
Limit |
NMT 2 % |
NMT 2 % |
NMT 2% |
NMT 2% |
Table No. 5 : Intermediate Precision Data of Venetoclax
F. Accuracy and Recovery
The accuracy of an analytical procedure expresses the closeness of the agreement between the value which is accepted either as a conventional true value or an accepted reference value and the value found. The accuracy of the method is the closeness of the measured value to the true value for the sample7.
Accuracy was determined with the help of standard addition method, by calculating of % mean recovery of the sample at Four different levels 100, 110, 120, 130%. At each level, three determinations were performed, the amount recovered, % recovery, and % RSD were taken into consideration. Accuracy results at various levels of concentration are summarized in Table No. 6
|
Level |
Amount of Std Spiked (ml) |
Amount Recovered (mg) |
% Assay |
% Recovery |
Average |
S.D. |
% RSD |
Mean % Recovery |
|
100% |
0 |
100.98 |
99.98 |
100.98 |
100.90 |
0.091 |
0.091 |
100.60 % |
|
0 |
100.82 |
99.80 |
100.8 |
|||||
|
0 |
100.91 |
99.91 |
100.91 |
|||||
|
110% |
0.5 |
110.84 |
100.84 |
100.76 |
101.28 |
0.051 |
0.051 |
|
|
0.5 |
111.94 |
111.94 |
101.76 |
|||||
|
0.5 |
112.46 |
113.46 |
101.33 |
|||||
|
120% |
1 |
121.36 |
121.36 |
101.13 |
100.41 |
0.068 |
0.068 |
|
|
1 |
119.72 |
125.72 |
99.77 |
|||||
|
1 |
120.48 |
128.42 |
100.33 |
|||||
|
130% |
1.5 |
129.46 |
130.46 |
99.58 |
100.50 |
0.079 |
0.079 |
|
|
1.5 |
131.46 |
131.46 |
101.12 |
|||||
|
1.5 |
130.73 |
130.73 |
100.56 |
Table No. 6 : Accuracy Data of Venetoclax
G. Robustness
The robustness of an analytical procedure is a measure of its capacity to remain unaffected by small, but deliberate variations in method parameters and provides an indication of its reliability during the normal usage. Robustness testing was performed by a change in flow rate (± 0.2 ml/min), change in column temperature (± 20C), change in wavelength (± 2nm), Change in mobile phase (± 2). One sample of 25µg/ml was prepared and injected in triplicate along with five replicate injections of a standard solution of 25µg/ml under different chromatographic conditions. Its % assay, average, SD, %RSD were calculated and reported, results are summarized in Table. No.7.
|
Parameters |
Change In Parameters |
% Assay Estimation |
Mean |
S.D |
% RSD |
Limit |
|
Flow Rate (± 0.2 ml/min) |
0.5 ml |
100.25 |
99.88 |
0.1517568 |
0.1517568 |
NMT 2 % |
|
0.7 ml |
101.00 |
|||||
|
0.9 ml |
99.81 |
|||||
|
Column Temperature (± 0.20C) |
380C |
101.79 |
100.26 |
0.1753985 |
0.1754768 |
|
|
400C |
101.55 |
|||||
|
420C |
102.40 |
|||||
|
Wavelength (± 2nm) |
284nm |
100.88 |
99.68 |
0.9875645 |
0.9874435 |
|
|
286 nm |
101.25 |
|||||
|
288 nm |
102.45 |
|||||
|
Mobile Phase (± 2) |
53:43 |
100.33 |
100.44 |
0.6435296 |
0.6438673 |
|
|
55:45 |
100.56 |
|||||
|
57:47 |
100.88 |
Table No. 7 : Robustness Data of Venetoclax
H. Analysis of Formulation
The optimized method was applied on tablets having a label claim of Venetoclax 100 mg. The assay was performed on the above solution wherein five replicate injections of standard preparation 25 µg/ml and six sample preparation of 25 µg/ml in triplicate were injected into the HPLC system. Its % assay, average, SD, %RSD were calculated and reported, results are summarized in Table. 8
|
Sample No |
Weight of Standard (mg) |
Sample weight (equivalent to 100 mg of Venetoclax) |
Mean Area of the standard at 286 nm |
Area of sample at 286 nm |
% Assay |
|
1. |
10.54 |
112.43 |
11845.42 |
15678.07 |
100.78 |
|
2. |
112.55 |
16982.83 |
99.02 |
||
|
3. |
112.64 |
19876.54 |
100.01 |
||
|
4. |
112.78 |
11487.33 |
99.22 |
||
|
5. |
112.84 |
17645.21 |
100.52 |
||
|
6. |
112.43 |
14649.35 |
100.83 |
||
|
Mean |
100.35 |
||||
|
S.D. |
0.4732 |
||||
|
% RSD |
0.3865 |
||||
Table No. 8 : Assay results of Venetoclax
V. FORCED DEGRADATION STUDIES
Chromatograms of acidic and alkaline degradation showed extra peaks indicating mild degradation, i.e. 2.96 % degradation in acidic conditions and 11.56 % in basic conditions. Venetoclax was found to be stable to water hydrolytic, oxidative, thermal and photolytic stress conditions and hence no degradation was observed. Degradation products formed were well separated under-developed conditions. The peak purity of the main peak was found to be 100 %, as the peaks of degradation. Products were successfully separated from the main peak of Venetoclax without any interference. The acceptance limit of peak purity is not less than 99 %. This confirms the stability indicating nature of the proposed method. The data of forced degradation studies is summarized in Table No.9 .
|
Sr. No |
Degradation |
Conditions |
Duration |
Retention time of Degradation products (min) |
% Residual Drug |
Observed peak purity (%) |
|
1. |
Acid Degradation |
1ml of 2N HCL at 600C |
1h |
3.42 |
98.05 |
100.51 |
|
2. |
Alkali Degradation |
1 ml of 0.1N NaOH at 600C |
1h |
4.13 |
88.33 |
100.42 |
|
3. |
Oxidative Degradation |
1ml of 3% H2O2 at 600C |
1h |
4.15 |
100.00 |
100.76 |
|
4. |
Water Hydrolysis |
1ml of Water at 600C |
1h |
4.19 |
100.00 |
100.88 |
|
5. |
Thermal Degradation |
Hot water bath at 1000C |
1h |
4.11 |
100.00 |
100.93 |
|
6. |
Photolytic Degradation |
UV lamp (254nm) |
24h |
4.18 |
100.00 |
100.12 |
Table No. 9 : Forced Degradation Data of Venetoclax.
VI. RESULTS AND DISCUSSION
A simple, rapid, isocratic method was developed for determination of Venetoclax in pharmaceutical tablet dosage form. Optimization of method was done by the choice of mobile phase composition selection of column, selection of wavelength, injection volume, temperature, flow rate. The observed chromatogram of Venetoclax standard and sample solution gives sharp peak with retention time of 4.19 min. Linearity is observed over a concentration range of 5-50 µg/ml for Venetoclax. The correlation coefficient was found to be 0.9998. The relative standard deviation for system suitability testing and system precision studies were found to be less than 2%. Theoretical plates were found to be greater than 2000, also the tailing factor was reported to be less than 2. In Method precision (assay repeatability) studies of Venetoclax average assay percentage were found to be 100.35% which was within the limit i.e., between 98% to 102%. The relative standard deviation for all intermediate precision parameters was found to be within the limit. The accuracy studies were shown as % recovery at 100% to 130% level for Venetoclax. The mean percent recovery was found to be 100.60 % which was within the limit. Hence the method was found to be accurate. The present method can detect and quantify the analyte at a lower concentration. Limit of detection and limit of quantification values were estimated as following, LOD = 0.53 µg/ml, LOQ = 1.62 µg/ml where standard deviation (106.36) and slope (s = 996.73) values were obtained by the calibration curve method. By analyzing robustness, resultant values were found to be within a limit that is less than 2%, thus the developed method was confirmed to be robust. The results obtained from the assay show that the percentage recoveries were high, and SD values are very low, which confirms that the method is suitable for routine analysis of Venetoclax in its pharmaceutical preparation.
Conclusion
The present RP-HPLC method was developed for quantitative and qualitative estimation of Venetoclax in its pharmaceutical tablet dosage form. The proposed method was successfully validated for parameters such as system suitability, linearity, accuracy, precision, robustness, LOD & LOQ and assay as per the ICH Q2(R2) guidelines. The results for all validation parameters were within the acceptable limits. The developed RP-HPLC method was found to be simple, selective, precise and accurate. Also, this method uses lesser mobile phase, simple reagents with minimum preparations and shorter duration for analysis. The present RP-HPLC method can be used for routine analysis and quality control of Venetoclax in tablet dosage form in the pharmaceutical industry.
References
[1] Rajendra A, Sengar M. Venetoclax: A narrative drug review. Cancer Research, Statistics, and Treatment. 2022 Jul 1;5(3):519-32. [2] Le TH, Phung TH, Le DC. Development and validation of an HPLC method for simultaneous assay of potassium guaiacolsulfonate and sodium benzoate in pediatric oral powder. Journal of analytical methods in chemistry. 2019;2019(1):6143061. [3] Sadapha P, Dhamak K. Review article on high-performance liquid chromatography (HPLC) method development and validation. International Journal of Pharmaceutical Sciences Review and Research. 2022;74(03):23-9. [4] Kalal DJ, Redasani VK. Stability-indicating RP-HPLC method development and validation for estimation of Mupirocin calcium in bulk and in pharmaceutical formulation. Future Journal of Pharmaceutical Sciences. 2022 Mar 28;8(1):21. [5] Ganji S, Dhulipala S, Nemala AR. Development and validation of RP HPLC method for the estimation of Sofosbuvir and related impurity in bulk and pharmaceutical dosage form. Future journal of pharmaceutical sciences. 2021 Dec;7:1-0.Sangeetha M, Reichal CR, Indulatha VN, Thirumoorthy N. Development and Validation of RP-HPLC Method: An Overview. Research and Reviews: Journal of Pharmaceutical Analysis. 2014;3(4):8-14.
Copyright
Copyright © 2024 Shubham Rasal, Vijay Kumar Munipalli, Sayali Warde, Smita Nayak, Bhaskar Vaidhun. This is an open access article distributed under the Creative Commons Attribution License, which permits unrestricted use, distribution, and reproduction in any medium, provided the original work is properly cited.

Download Paper
Paper Id : IJRASET64136
Publish Date : 2024-08-31
ISSN : 2321-9653
Publisher Name : IJRASET
DOI Link : Click Here
 Submit Paper Online

