Ijraset Journal For Research in Applied Science and Engineering Technology
- Home / Ijraset
- On This Page
- Abstract
- Introduction
- Conclusion
- References
- Copyright
Application of Computational Analysis to Identify Housing Discrimination in 21st Century United States
Authors: Aditi Ghosh, Alexander Suen, Dr. Phil Mui
DOI Link: https://doi.org/10.22214/ijraset.2023.54883
Certificate: View Certificate
Abstract
Redlining is a term for race-based discriminatory acts in real estate. While this practice has been outlawed in modern America, the effects remain evident today’s society. The importance of this research is to determine if redlining is still prevalent in America and causing some racial groups to be more likely to be denied home loans over others. This paper analyzes the lasting impacts of housing discrimination in the United States by using data science applications and uses machine learning models to predict whether a loan request will be accepted or denied. We are analyzing loan approval and denial over the past decade by utilizing census data provided by the Home Mortgage Disclosure Act from the United States government. We are determining whether Black Americans and other ethnic minorities are disproportionately denied loans even with similar loan applications as other races. In other words, are they still being redlined and discriminated against based on their race. Our research revolves around the entire nation, from California to Alabama to Illinois to Michigan to determine if redlining is continuously occurring in such places and to predict loan acceptance. We determined that race was not a major factor in home loan decisions, and applicant income, along with loan amount, took precedence.
Introduction
I. INTRODUCTION
The term “redlining” was coined in the 1930s when the United States government graded neighborhoods on a scale from A-D to see who would qualify for their home loan programs. The D-ranked neighborhoods were deemed “unsafe” and “hazardous,” making them unable to qualify for many of the home loans backed by the government [1]. Unfortunately, many families living in these communities were ethnic minorities, primarily Black Americans. While this practice has been outlawed in modern America, the effects remain evident in today’s society, and the singling out of low-income African American families can make it much harder for them to obtain home loans that can potentially assist them in escaping the cycle of poverty [2]. Predominantly white neighborhoods experience the privileges of having simple access to mortgage loans for homes. Although outlawed, this deliberate–de facto–practice under the phrase “Redlining” has left lasting scars on communities [3]. The real estate market is a perilous and fluctuating domain, making it difficult for individuals to spend money on their properties [4]. Despite this common trend, 99% of banks satisfy have continued to satisfy inspection under the Community Reinvestment Act, a law designed to reverse rampant redlining [5]. The analysis of redlined neighborhoods and the effect it has on their habitants in modern times through data science is a highly novel and novice topic, and although there has been some entry-level exploration on the topic, it is incredibly vague, so this paper delves deeper into the issue. We are utilizing census data such as race and income from the Consumer Financial Protection Bureau (CFPB) and mortgage data publicly disclosed by the Home Mortgage Disclosure Act (HMDA) [6]. Our team first separated ethnic groups and analyzed the impact of redlining on these groups in California, then went to Alabama, Illinois, and finally in Michigan. These were included in UC Berkeley’s study on the most and least segregated cities in America [7].
II. METHODS
A. Data Collection
Each year, the government releases all data about home mortgages due to the Home Mortgage Disclosure Act. Each annual dataset comprises both mortgage and relevant information to each loan case: applicant income, racial identity, loan amount, and others. For this research, we utilized data from 2012 to 2017 from Michigan, Illinois, Alabama, and California. We felt a five-year span would be enough for us to have enough data to pinpoint a conclusion to our research question accurately.
After downloading the annual data for each state, we needed to extract only data from the cities and counties we decided to focus on. From there, we used a series of Unix grep commands to extract data for the cities or counties we wanted to use. Alabama: Birmingham/Shelby County, Michigan: Detroit/Wayne County, Illinois: Chicago/Cook County, California: San Jose/Santa Clara County. We additionally used an extra grep command (grep -m 1 "" current.csv >> new.csv) to include the column headers for each component of the loan case, such as: year, loan to debt ratio, applicant income, the loan amount etc. After extracting the necessary data, we placed it all in state-specific CSV files to use as our data.
B. Data Cleaning
After data gathering was complete, we utilized Jupyter Notebook & Python libraries such as Pandas, Seaborn, Matplot, and scikit-learn to manipulate the data and create various machine learning models to predict approval chances based on individual characteristics. First, we started off by preparing the data for analysis by removing empty and null data such as components like the loan amount, application income, population, minority population, and number of owner-occupied units. We then selected features to add to our X (input) dataset: 'as_of_year', 'loan_type_name', 'loan_type', 'property_type_name', 'property_type', 'loan_purpose_name', 'loan_purpose', 'owner_occupancy_name', 'owner_occupancy', 'loan_amount_000s', ‘preapproval_name', 'preapproval', 'action_taken_name', 'action_taken', 'applicant_ethnicity_name', 'applicant_ethnicity', 'co_applicant_ethnicity_name', 'co_applicant_ethnicity', 'applicant_race_name_1', 'applicant_race_1', 'co_applicant_race_name_1', 'co_applicant_race_1', 'applicant_sex_name', 'applicant_sex', 'co_applicant_sex_name', 'co_applicant_sex', 'applicant_income_000s', 'purchaser_type_name', 'purchaser_type', 'denial_reason_name_1', 'denial_reason_1', 'rate_spread', 'hoepa_status_name', 'hoepa_status', 'population', 'minority_population', 'hud_median_family_income', 'number_of_owner_occupied_units', 'number_of_1_to_4_family_units'.
C. Data Visualization
Then, we graphed the approval vs. race ratio and denied vs. race ratio to determine whether race was indeed a factor in determining whether a loan was accepted or denied. This also went to show whether certain race groups were disproportionately being accepted or denied loan requests. We also calculated the standard error of each approval & denied ratio to gauge the error in our data analysis.
D. Machine Learning Model
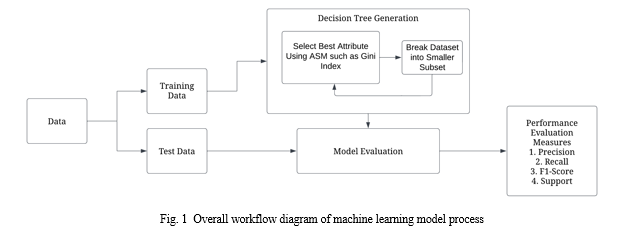
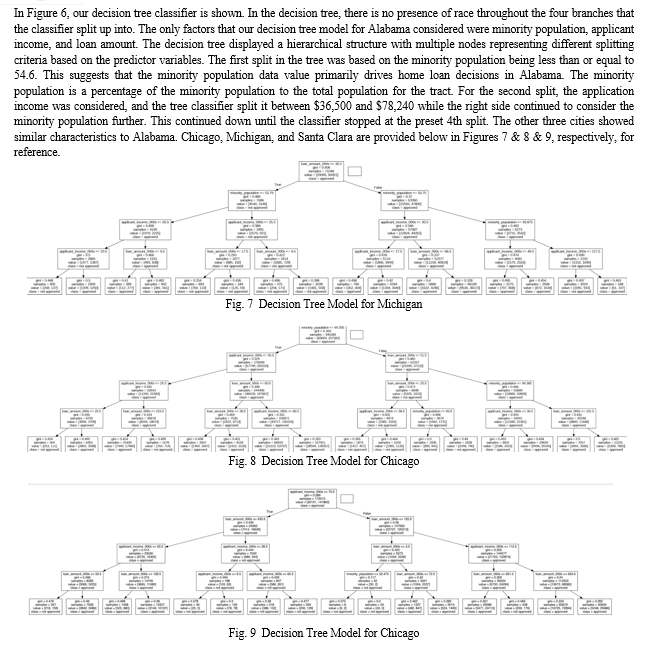
Next, we utilized machine learning (ML) models to predict approval based on personal characteristics. We focused our model training on three primary races: White, Asian, and Black. In addition, we focused on certain traits like loan amount, applicant income, and minority population. We first utilized the one-hot encoding technique for the races and separated the city’s data into a 30% test & 70% train ratio, using a stratified shuffle split. The random state was set at 42, and the number of re-shuffling & splitting iterations at 1. After training the model, we used the scikit-learn’s Decision Tree Classifier to be able to visually see the choices the model was making through each test case. We set the random state to zero and had it at a maximum depth of four. The workings of a decision tree model are shown above in Figure 1. Afterward, we printed the classification report of each tree to gauge the accuracy.
III. RESULTS
A. Superficial Data Analysis
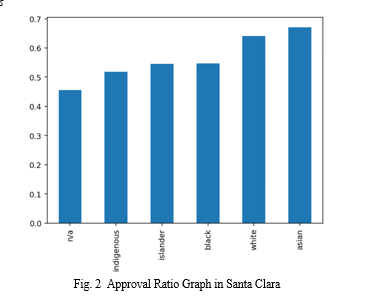
As stated above, Figure 1 provides a visual representation of the approval ratios versus race. To generate this figure, we focused on the "action taken" column in the overall Pandas data frame and created a new data frame by splitting it based on the values in the column. A value of 1 indicated loan approval, while any other number represented a denial.
Analyzing the approval rates in Santa Clara, we observed that Asian applicants had the highest approval rates, followed by white, black, island, indigenous, and n/a (not applicable), in descending order. It is important to note that Santa Clara has a predominantly Asian population. Therefore, it becomes challenging to confidently determine whether loan approvals or denials are solely based on race. The high approval rates among Asians could be influenced by other factors, such as their financial standing or creditworthiness, rather than solely race.
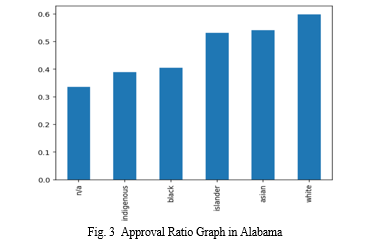
This pattern was reflected in the analysis of other cities as well, as shown in Figures 3 & 4 & 5 below, each having their own respective ethnic majorities. The loan approval ratios varied across different racial groups in these cities, likely influenced by a combination of factors such as local economic conditions, housing markets, and socioeconomic disparities. Therefore, it is crucial to consider the broader context of each city's demographics and lending environment when interpreting these results.

IV. ACKNOWLEDGMENT
We would like to express our deepest gratitude to our advisor, Dr. Mui, for his invaluable guidance, support, and expertise throughout this research project. He has given us tremendous amounts of insightful feedback, constructive criticism, and dedication that has been instrumental in shaping our research and refining our methodologies. We would also like to thank the Aspiring Scholars Directed Research Program (ASDRP) for providing the tools necessary for us to carry out our research and providing us with a wonderful support staff.
Conclusion
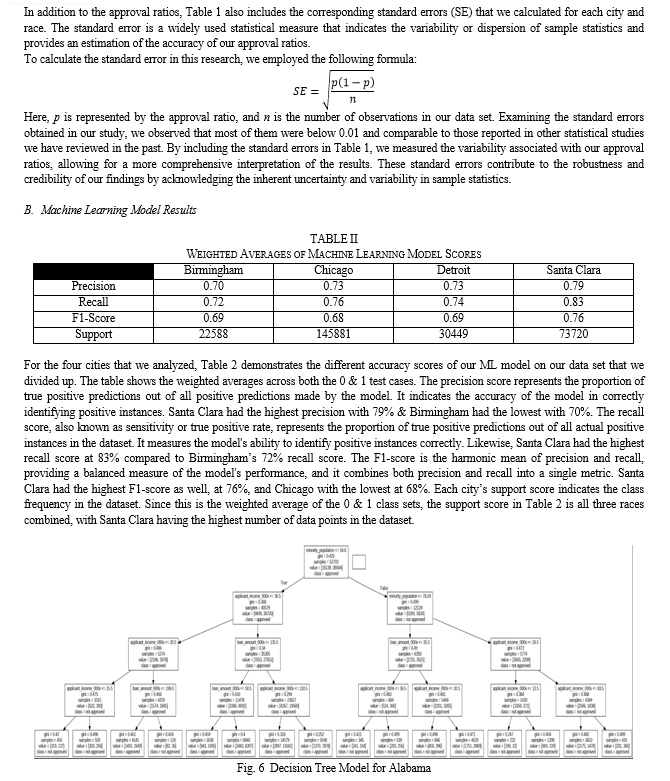
Our research with the superficial data analysis suggests a correlation between race and approval rates. Whites consistently were near the top in approval rates across all cities around the United States, while races like indigenous and blacks often were near the bottom. Blacks had approval rates in the 40’s in 3 out of the 4 cities, and the Indigenous group also matched this trait as well. However, our findings with the ML model indicate that there is no significant correlation between race and home loan approval/denial. The tree classifier, trained on the dataset using the one-shot hot encoding approach, did not identify race as a crucial factor in predicting loan approval or denial. As shown in Figures 2-4, the tree classifier only displayed minority population, applicant income, and loan amount to be deciding factors in its determination. The findings from the classification report further support the robustness of our analysis. The precision scores, ranging from 0.7 to 0.79, indicate the model\\\'s accuracy in correctly identifying positive instances across different racial groups. Similarly, the recall scores, ranging from 0.72 to 0.83, demonstrate the model\\\'s ability to capture a high proportion of actual positive instances. Additionally, the F1-scores, varying from 0.68 to 0.76, highlight a balanced precision & recall performance in terms of the various races in our analysis. The findings of this study contribute to the understanding of fair lending practices in America. The decision tree analysis demonstrated that loan decisions in different states are primarily driven by financial factors rather than race. This suggests that the lending practices, as represented by the dataset used in this research, do not exhibit racial bias regarding home loan approval. It is important to acknowledge the limitations of this study. The analysis was conducted using a specific dataset from three cities, which may not be representative of lending practices in other regions or time periods. The results should be interpreted within the context of the dataset and geographical area studied. Additionally, the decision tree model employed in this research may be sensitive to parameter selection, and other machine learning algorithms may yield different results. While this study found no direct correlation between race and home loan approval in these three cities, it does not discount the possibility of systemic biases or other forms of discrimination in lending practices. Factors such as socioeconomic status, credit history, employment, and debt-to-income ratio could still influence loan approval decisions and should be considered in future studies. Moving forward, it is recommended that further research be conducted using diverse datasets from various regions and with different methodologies to validate these findings. Additionally, exploring additional factors beyond race and incorporating other machine learning techniques may provide a more comprehensive understanding of the complex dynamics involved in home loan approval decisions. Overall, this research contributes to the broader discussion on fair lending and highlights the importance of considering financial factors rather than race in determining loan approval outcomes. By identifying the critical predictors associated with loan approval, policymakers, and lending institutions can work towards ensuring equitable lending practices that prioritize financial indicators and reduce potential biases in the decision-making process.
References
[1] Jackson, C. (2021, August 17). What is redlining?. The New York Times. https://www.nytimes.com/2021/08/17/realestate/what-is-redlining.html. [2] Angwin, J., Larson, J., Mattu, S., & Kirchner, L. (2021, June 17). Racial bias in noisy data: Credit scores, mortgage loans, and fairness in machine learning. MIT Technology Review. Retrieved from https://www.technologyreview.com/2021/06/17/1026519/racial-bias-noisy-data-credit-scores-mortgage-loans-fairness-machine-learning/ [3] Blumenstock, J., Krieger, N., & Mortensen, K. (2022, April 12). How flawed data aggravates inequality: Credit. Stanford Institute for Human-Centered Artificial Intelligence. Retrieved from https://hai.stanford.edu/news/how-flawed-data-aggravates-inequality-credit. [4] Primary Care Development Corporation. (n.d.). New findings: Historic redlining drives health disparities for New Yorkers. Retrieved from https://www.pcdc.org/new-findings-historic-redlining-drives-health-disparities-for-new-yorkers/. [5] Tach, L., & Hernandez, D. J. (2022, November 22). For people of color, banks are shutting the door to homeownership. Reveal. Retrieved from https://revealnews.org/article/for-people-of-color-banks-are-shutting-the-door-to-homeownership. [6] Consumer Financial Protection Bureau. (n.d.). Historic HMDA Data. Retrieved from https://www.consumerfinance.gov/data-research/hmda/historic-data/. [7] University of California, Berkeley - Haas Institute for a Fair and Inclusive Society. (n.d.). The most and least segregated cities in America. Retrieved from https://belonging.berkeley.edu/most-least-segregated-cities.
Copyright
Copyright © 2023 Alexander Suen, Aditi Ghosh. This is an open access article distributed under the Creative Commons Attribution License, which permits unrestricted use, distribution, and reproduction in any medium, provided the original work is properly cited.

Download Paper
Paper Id : IJRASET54883
Publish Date : 2023-07-21
ISSN : 2321-9653
Publisher Name : IJRASET
DOI Link : Click Here
 Submit Paper Online

