Ijraset Journal For Research in Applied Science and Engineering Technology
- Home / Ijraset
- On This Page
- Abstract
- Introduction
- Conclusion
- References
- Copyright
Assessing Riparian Wetland Health Using Machine Learning: Analyzing Vegetation and Hydrological Correlations
Authors: Sudith Thota, Sahasra Gangineni , Vikrant Ganesan, Anish Ummadi, Dr. Kontham Shivaram Reddy
DOI Link: https://doi.org/10.22214/ijraset.2024.64251
Certificate: View Certificate
Abstract
Riparian wetlands are vital ecosystems that provide essential services, including biodiversity support, water quality improvement, and flood mitigation. Despite their importance, these ecosystems face numerous threats, such as habitat loss, pollution, and climate change. Monitoring the health of riparian wetlands is complex due to the intricate interactions between vegetation and hydrological processes. This study addresses these challenges by using machine learning techniques to analyze the relationships between key ecological indicators, including hydrophyte cover, species richness, and hydrological features like water cover and litter accumulation. Using data from the BLM Natl AIM Riparian and Wetland Indicators Hub, various machine learning models—Random Forest, Gradient Boosting, Extra Trees, and Ridge Regression—were applied to predict wetland health outcomes. The results revealed strong correlations between hydrophyte cover and composite wetland value, as well as between species richness and native vegetation cover, underscoring the importance of these variables in maintaining ecosystem integrity. The models effectively captured the complex relationships within riparian wetlands, providing accurate predictions of ecological health. These findings highlight the potential of integrating vegetation and hydrological data with advanced analytical techniques to enhance wetland conservation and management. This research contributes to a better understanding of riparian wetland dynamics and offers valuable insights for developing targeted conservation strategies to preserve these crucial ecosystems.
Introduction
I. INTRODUCTION
Riparian wetlands are ecologically significant areas located alongside rivers, streams, and lakes, characterized by the presence of water and unique plant communities. These ecosystems are vital for maintaining biodiversity and providing a range of ecosystem services[1]. Both vegetation and hydrology play crucial roles in sustaining the health and functionality of riparian wetlands[2]. Vegetation is a key factor in supporting biodiversity within riparian wetlands. Diverse plant communities offer habitat and food resources for various species, thereby enhancing the ecological richness and stability of these ecosystems[3]. Healthy vegetation not only supports a wide range of wildlife but also contributes to ecosystem services such as carbon sequestration and soil stabilization[4]. Moreover, vegetation plays a critical role in improving water quality[5]. Plants act as natural filters, absorbing nutrients and trapping sediments and pollutants, which helps maintain the ecological integrity of the wetland ecosystem. Hydrology is equally important in maintaining the health of riparian wetlands[6]. Hydrological processes, such as nutrient cycling and groundwater recharge, are essential for sustaining plant growth and soil fertility[7]. Nutrient cycling involves the movement and transformation of nutrients within the wetland, supporting plant growth and maintaining soil health[8]. Groundwater recharge, the process through which water infiltrates the soil and replenishes underground aquifers, is another critical hydrological function[9]. This process ensures a consistent supply of freshwater, which is essential for both the ecosystem and human use[9,10]. Despite their importance, riparian wetlands face numerous challenges that hinder their health. The inherent complexity of these ecosystems, with their diverse plant and animal species, makes it difficult to manage and maintain their ecological balance[11,12]. The introduction of new species, changes in land use, and climate variability can disrupt the delicate interplay between vegetation and hydrology, posing threats to the health of these wetlands[12]. Additionally, challenges in data collection further complicate efforts to monitor wetland health. Limited access to remote areas, lack of standardized monitoring protocols, and resource constraints result in insufficient data, making it challenging to accurately assess the health of riparian wetlands and implement effective conservation strategies[12,13]. This study aims to address these challenges by employing machine learning techniques to analyze the correlations between vegetation characteristics and hydrological indicators. By leveraging advanced predictive modeling, the study seeks to provide accurate assessments of riparian wetland health and identify key areas for conservation and restoration. Understanding these correlations is essential for developing effective management strategies that enhance the resilience and sustainability of riparian wetlands. The insights gained from this research will contribute to the development of targeted conservation efforts and restoration practices that ensure the long-term health and functionality of riparian wetland ecosystems.
II. METHODOLOGY
A. Study Location & Data Collection
The study is conducted nationwide across the United States, with all data collected and monitored by the Bureau of Land Management (BLM) Assessment. The BLM Assessment refers to the Assessment, Inventory, and Monitoring (AIM) Strategy. The AIM strategy utilizes probability and targeted sampling designs, standardized methods, and indicators, and integrates electronic data capture with remote sensing technologies. Each record in the dataset represents a sample visit at a specific plot on BLM land, where various riparian and wetland AIM methods are applied. The locations of these plots are marked by their central point geometry, as documented in the Plot Characterization form. Data collection and management are performed by BLM Field Offices, BLM Districts, or affiliated field crews, with all data stored in a centralized database at the BLM National Operations Center.
B. Data Cleaning & Preprocessing
The dataset utilized in this research was sourced from the BLM Natl AIM Riparian and Wetland Indicators Hub dataset, developed by the Department of the Interior and published by the Bureau of Land Management. This dataset comprises many ecological and environmental variables, such as vegetation characteristics, hydrological features, ground covers, and structural complexity. A rigorous data cleaning process was applied, utilizing robust scaling techniques to reduce the influence of outliers and exclude insignificant data points.
???????C. Feature Selection
- AH_HydrophyteCover: This feature represents the percentage of ground cover provided by hydrophytic plants, which are crucial indicators of wetland hydrological conditions and health. Hydrophytes are essential for maintaining water quality, providing habitat for aquatic organisms, and supporting nutrient cycling.
- SppInv_Richness_Cnt: Species richness is a fundamental measure of biodiversity. A high species count often correlates with a healthy and resilient ecosystem capable of withstanding environmental changes and pressures.
- LPI_SiteWetlandValue_CWM: This composite metric integrates multiple site characteristics, providing a holistic measure of the overall ecological value of a wetland site. It reflects the ability of the wetland to perform essential ecological functions.
- AH_NativeCover: Native plant cover indicates the presence of indigenous species, which contribute to ecosystem stability and prevent the dominance of invasive species.
- AH_WaterCover: The percentage of area covered by water is a direct measure of the wetland's hydrological status, critical for supporting wetland functions and maintaining ecological balance.
- BareSoilCover: High levels of bare soil can indicate erosion or disturbance, which are critical factors affecting the physical integrity and ecological health of wetlands.
???????D. Model Descriptions & Selection
- Random Forest: This ensemble learning method is highly effective for handling large datasets and capturing complex interactions between various types of data. It operates by constructing multiple decision trees during training and outputting the mode of the classes or mean prediction for regression.
- Gradient Boosting: This ensemble technique is known for its iterative learning process, which sequentially builds models to correct errors made by previous ones, thereby reducing prediction errors. It combines weak predictive models, typically decision trees, to create a strong predictive model.
- Extra Trees: This ensemble method, also known as Extremely Randomized Trees, is designed to enhance model generalization by randomly sampling features and thresholds. It effectively captures diverse patterns in the data and provides robust correlation structures.
- Ridge Regression: This linear regression model with L2 regularization is particularly effective in managing multicollinearity among features. It helps prevent overfitting by penalizing large coefficients, thus ensuring more accurate and stable predictions.
???????E. Evaluation Metrics
- R^2: R², or the coefficient of determination, is a statistical measure that indicates the proportion of the variance in the dependent variable that is predictable from the independent variables. In other words, it tells us how well the independent variables explain the variability of the dependent variable. An R² value ranges from 0 to 1, where a value closer to 1 indicates a model that explains a high proportion of the variance. In the context of riparian wetland health monitoring, a high R² value indicates that the model is effectively capturing the relationship between vegetation and hydrological features (such as hydrophyte cover) and the overall health of the ecosystem. This measure helps determine the accuracy and reliability of the predictive models being used, providing confidence in the model's ability to explain the underlying ecological processes.
- MAE: MAE measures the average magnitude of the errors between the predicted values and the actual values, without considering their direction (positive or negative). It is calculated by taking the average of the absolute differences between predicted and observed values. MAE provides a straightforward interpretation of prediction accuracy. In the study of riparian wetlands, it quantifies how much the predicted values deviate from the actual observations on average. A lower MAE value indicates that the model's predictions are closer to the observed values, which is crucial for accurately assessing the health and ecological status of wetlands. MAE is particularly useful because it gives equal weight to all errors, making it sensitive to all deviations from actual values.
- RMSE: RMSE is a measure of the differences between predicted and actual values, calculated as the square root of the average of squared differences. RMSE gives a higher weight to larger errors due to the squaring process, making it sensitive to outliers. RMSE is valuable in the context of riparian wetland health monitoring because it provides a measure of how well the model predicts values while penalizing large errors more heavily than MAE. This sensitivity to larger errors makes RMSE an important metric for ensuring that the model does not just perform well on average but also minimizes significant prediction errors. A lower RMSE indicates that the model can reliably predict the health indicators of riparian wetlands, providing a robust tool for ecological monitoring and management.
III. RESULTS & DISCUSSION
A. Overview of Model Performance
Key Feature Model Performance
|
Target Variable(s) |
Regression Method |
R^2 |
MAE |
RMSE |
|
AH_HydrophyteCover |
Random Forest |
0.938 |
5.870 |
7.717 |
|
AH_HydrophyteCover |
Gradient Boosting |
0.943 |
5.486 |
7.360 |
|
AH_HydrophyteCover |
Extra Trees |
0.927 |
6.143 |
8.324 |
|
AH_HydrophyteCover |
Ridge Regression |
0.876 |
8.105 |
10.903 |
|
SppInv_Richness_Cnt |
Random Forest |
0.857 |
4.708 |
6.103 |
|
SppInv_Richness_Cnt |
Gradient Boosting |
0.856 |
4.651 |
6.110 |
|
SppInv_Richness_Cnt |
Extra Trees |
0.858 |
4.706 |
6.068 |
|
SppInv_Richness_Cnt |
Ridge Regression |
0.819 |
5.449 |
6.844 |
|
LPI_SiteWetlandValue_CWM |
Random Forest |
0.893 |
4.239 |
5.627 |
|
LPI_SiteWetlandValue_CWM |
Gradient Boosting |
0.892 |
4.356 |
5.646 |
|
LPI_SiteWetlandValue_CWM |
Extra Trees |
0.907 |
3.939 |
5.238 |
|
LPI_SiteWetlandValue_CWM |
Ridge Regression |
0.863 |
4.649 |
6.343 |
|
AH_NativeCover |
Random Forest |
0.932 |
3.651 |
5.758 |
|
AH_NativeCover |
Gradient Boosting |
0.938 |
3.706 |
5.526 |
|
AH_NativeCover |
Extra Trees |
0.942 |
3.469 |
5.333 |
|
AH_NativeCover |
Ridge Regression |
0.933 |
4.060 |
5.770 |
|
AH_WaterCover |
Random Forest |
0.908 |
3.452 |
5.952 |
|
AH_WaterCover |
Gradient Boosting |
0.903 |
3.503 |
6.105 |
|
AH_WaterCover |
Extra Trees |
0.915 |
3.387 |
5.711 |
|
AH_WaterCover |
Ridge Regression |
0.904 |
3.830 |
6.091 |
|
BareSoilCover |
Random Forest |
0.795 |
2.353 |
4.127 |
|
BareSoilCover |
Gradient Boosting |
0.813 |
2.142 |
3.941 |
|
BareSoilCover |
Extra Trees |
0.844 |
2.060 |
3.591 |
|
BareSoilCover |
Ridge Regression |
0.773 |
3.016 |
4.340 |
Key Features Regression Model Results
B. Correlation Analysis
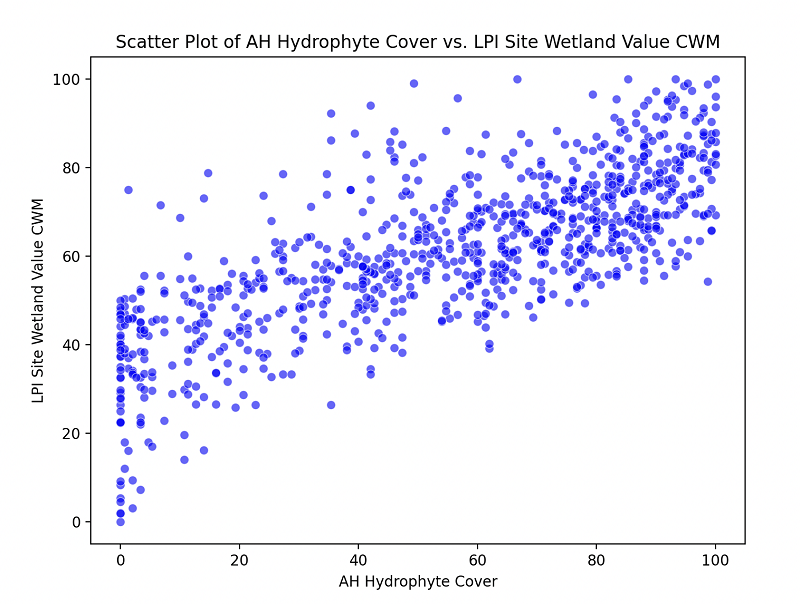
This graph illustrates a strong positive correlation between hydrophyte cover—plants that are highly water-dependent—and the composite wetland value. This relationship suggests that variations in hydrophyte cover significantly influence ecological indices, highlighting the composite wetland value's importance in assessing ecosystem integrity. Hydrophytes play a crucial role in maintaining hydrological balance, enhancing water quality, and providing habitat for aquatic species. The strong positive correlation indicates that areas with greater hydrophyte cover are likely to exhibit higher wetland values, reflecting healthier and more resilient ecosystems. This emphasizes the role of hydrophytes as key bioindicators for monitoring wetland health and ecological stability. These findings demonstrate that the machine learning model can accurately predict the ecological health of wetlands based on the link between hydrophyte cover and composite wetland value. By capturing this relationship, the model can provide reliable predictions about the state of wetland ecosystems, allowing for early detection of ecological changes or potential degradation. Predicting wetland health using hydrophyte cover enables proactive management strategies, where interventions can be directed at areas at risk of decline. This type of predictive modeling is invaluable for conservation, supporting the preservation of biodiversity and the essential ecosystem services wetlands offer.
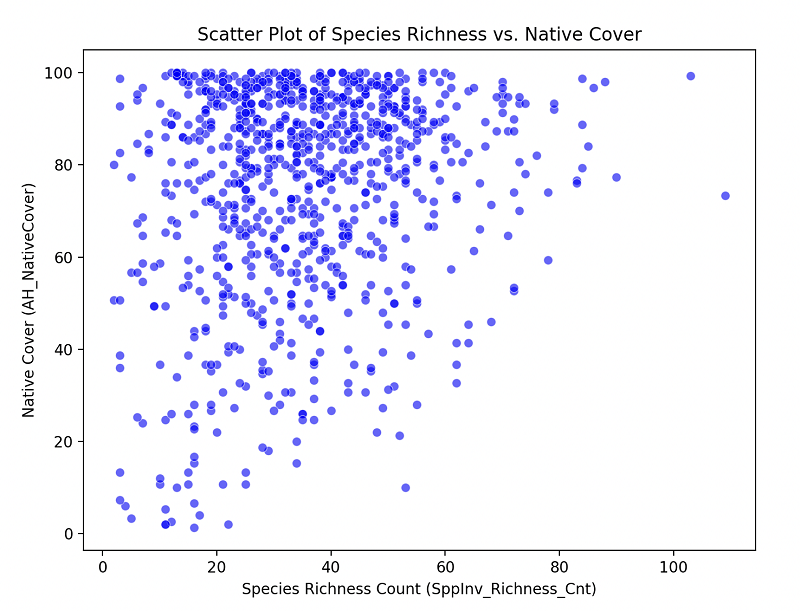
This graph shows a strong positive correlation between Species Richness and Native Cover, indicating that areas with a higher diversity of plant species often have a greater proportion of native plants. This relationship suggests that biodiversity in riparian wetlands is closely tied to the presence of native species, which play a vital role in maintaining ecological balance and resilience. Native plants have well-established interactions with local fauna and other flora, contributing to a more stable and sustainable ecosystem. The correlation between species richness and native cover underscores the importance of preserving native vegetation to support biodiversity and overall ecosystem health. These findings highlight how machine learning models can predict key vegetation patterns, capturing and quantifying complex ecological relationships. By accurately modeling the connection between species richness and native cover, these models provide valuable insights into vegetation structure, composition, and health. This capability is especially useful for conservation and management efforts, where understanding and forecasting changes in vegetation can guide interventions to protect and restore riparian ecosystems. Using machine learning models allows for the integration of various ecological indicators, enabling more comprehensive assessments of vegetation dynamics and their impact on wetland health.
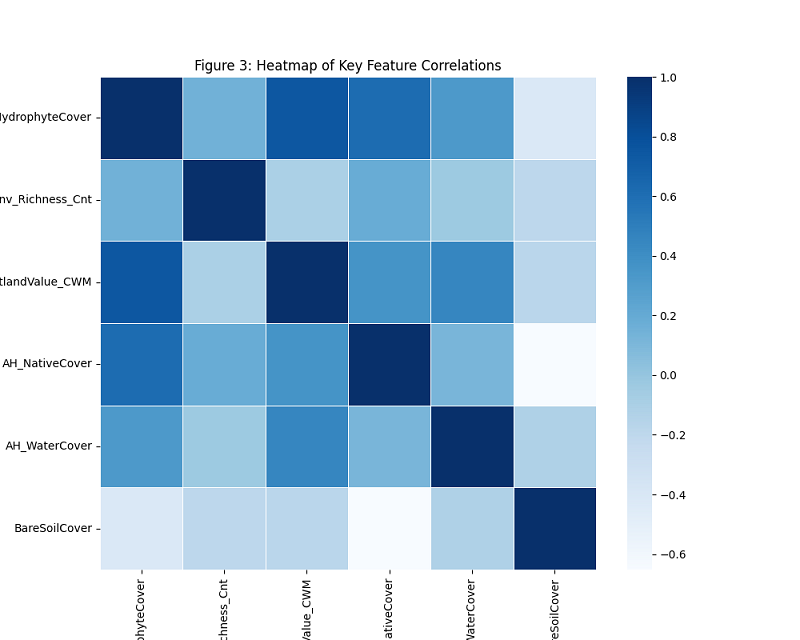
Heatmap of all Key Features
C. Residual Analysis
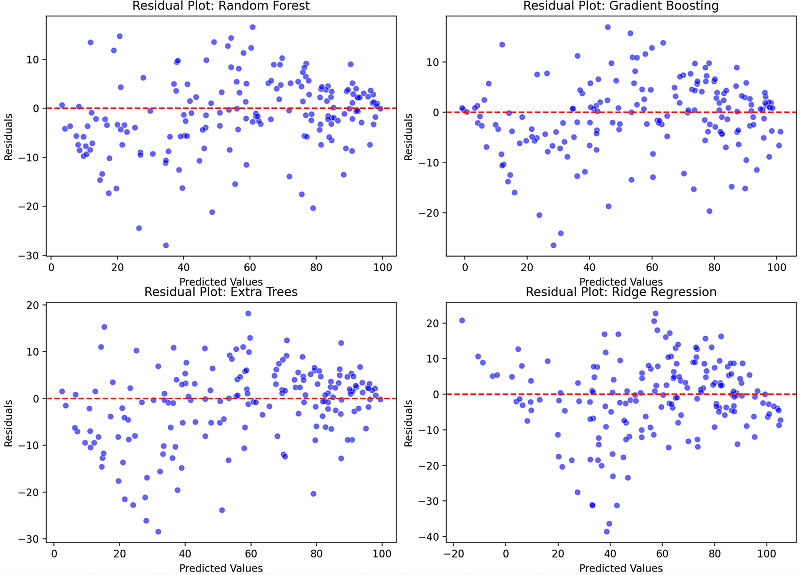
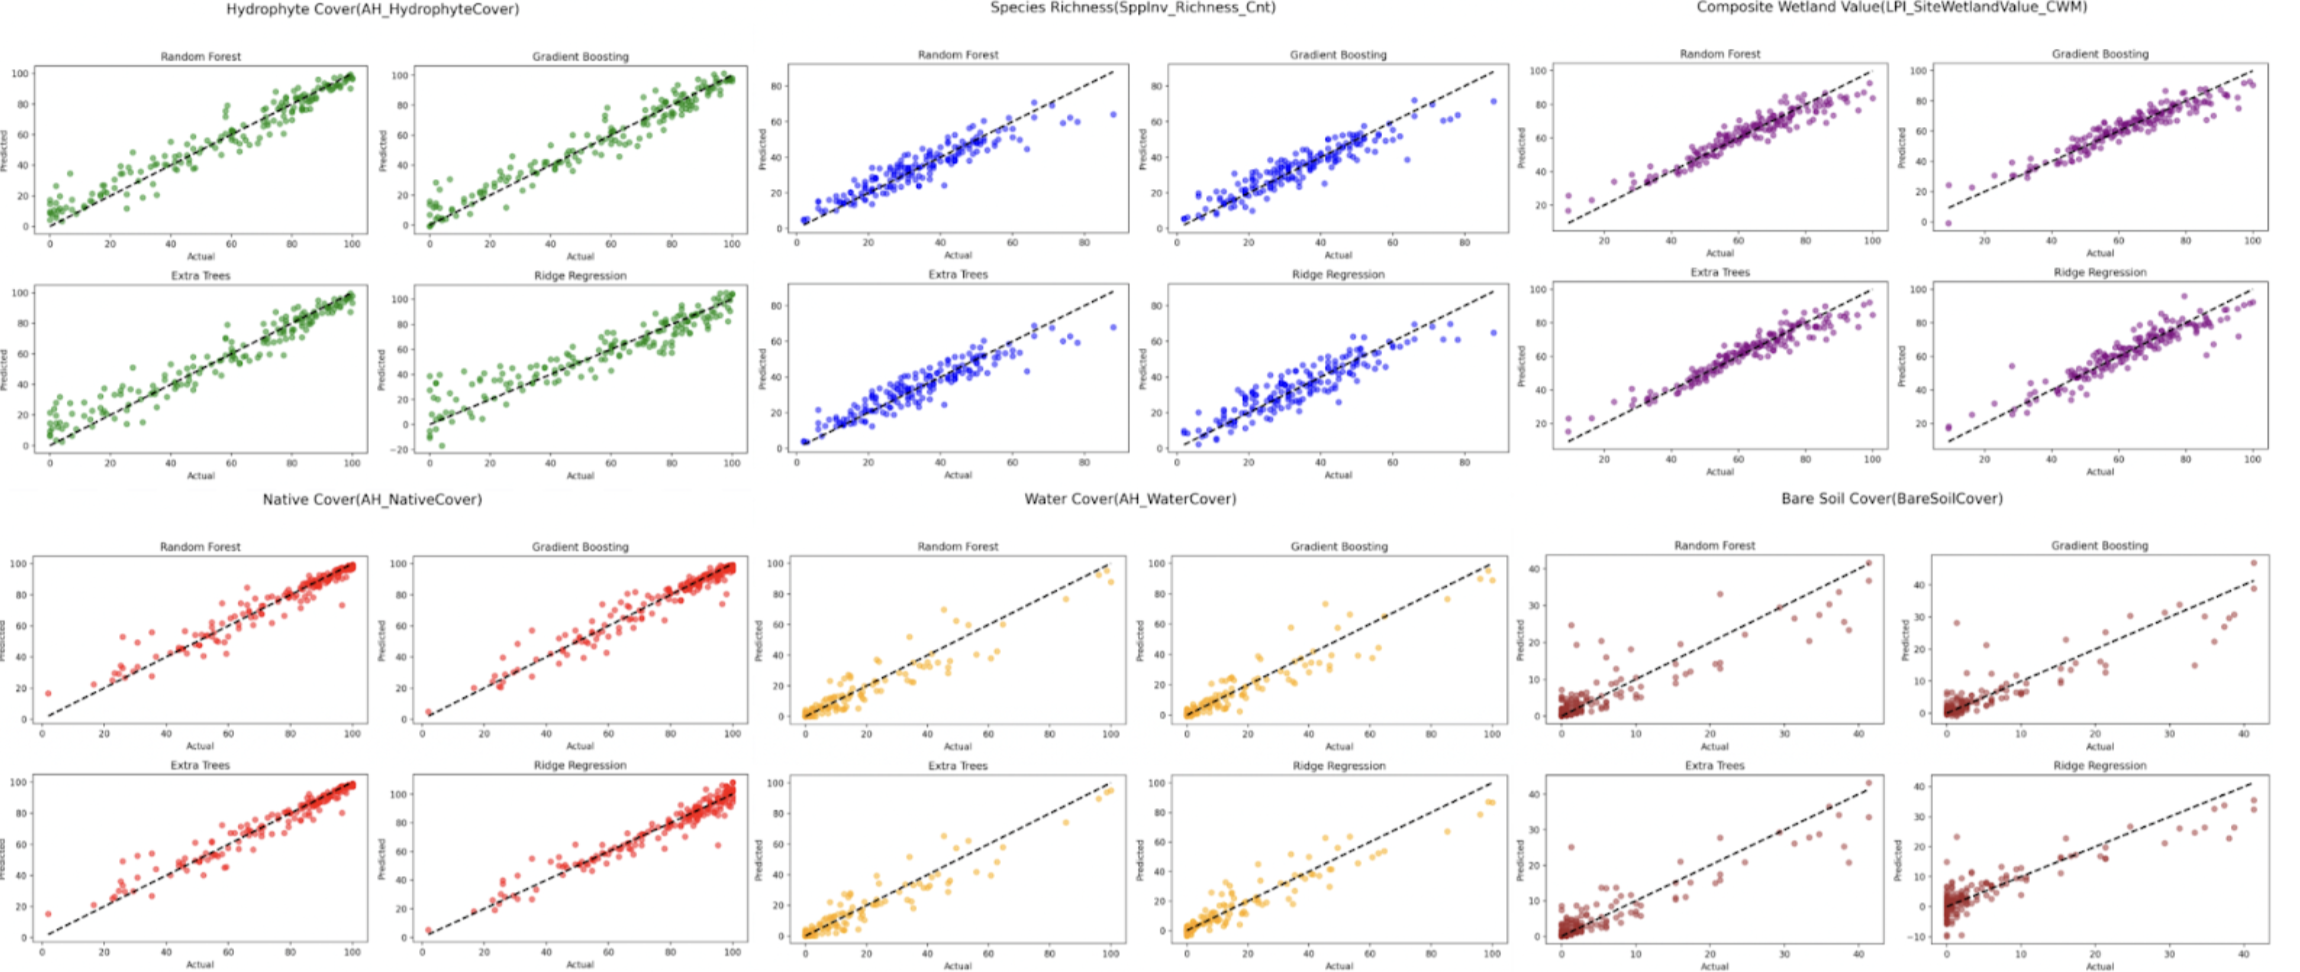
The residual plots for the target variable AH_HydrophyteCover reveal that all four models—Random Forest, Gradient Boosting, Extra Trees, and Ridge Regression—perform well, with residuals clustering closely around zero. This indicates a good fit, suggesting that these models are accurately capturing the relationship between hydrophyte cover and other ecological factors. The narrow spread of residuals around the zero line points to minimal systematic bias, meaning the models effectively account for the variability in hydrophyte cover. This finding is important for understanding how hydrophyte plants influence both vegetation and hydrological conditions in riparian wetlands. Hydrophytes, being water-loving plants, are key indicators of wetland health, reflecting the moisture status and the wetland's capacity to support diverse plant species. The models’ accurate predictions of hydrophyte cover not only validate their effectiveness but also underscore the significance of hydrophyte cover as a crucial variable in monitoring wetland ecosystem health. The strong performance of these models in predicting hydrophyte cover also emphasizes the link between vegetation structure and hydrological dynamics in riparian wetlands. As hydrophyte cover increases, it can improve soil moisture retention and reduce soil erosion, helping to stabilize the wetland environment. Conversely, changes in water levels can directly affect the distribution and abundance of hydrophyte species, impacting overall vegetation cover.
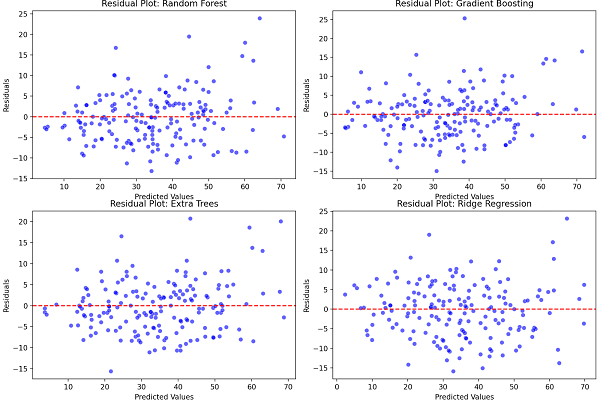 ???????
The residual plots for the target variable, SppInv_Richness_Cnt, show that all four models—Random Forest, Gradient Boosting, Extra Trees, and Ridge Regression—perform well, with most residuals clustering closely around zero. This suggests a good fit, indicating that these models effectively capture the relationship between species richness and other ecological features. The narrow distribution of residuals around the zero line points to minimal systematic bias, highlighting these models' ability to account for the variability in species richness. This finding is crucial for understanding how species richness influences vegetation structure and ecological health in riparian wetlands. Species richness, which reflects the diversity of plant species present, is a key indicator of ecosystem resilience and stability. By accurately predicting species richness, these models not only demonstrate their effectiveness but also emphasize the importance of species diversity in monitoring wetland health. The success of these models in predicting species richness also underscores the interdependence between vegetation diversity and environmental conditions in riparian wetlands. Higher species richness can increase habitat complexity, promote ecological interactions, and enhance the overall functionality of the ecosystem. On the flip side, changes in environmental factors, such as water availability and soil nutrients, can directly impact the distribution and abundance of plant species, ultimately affecting overall species diversity.
Conclusion
This study found significant correlations between hydrophyte cover and overall wetland value, as well as between species richness and native plant cover. These relationships highlight the critical role of hydrophytes in maintaining the health of riparian wetland ecosystems. The strong positive link between hydrophyte cover and wetland value suggests that wetlands with more hydrophyte presence are not only more ecologically resilient but also healthier overall. This finding points to enhancing hydrophyte cover as a priority for conservation efforts. Future research should explore how changes in the environment, like climate variability or land-use shifts, might affect these relationships. Understanding how wetlands adapt under different conditions could provide valuable insights into their long-term sustainability. Additionally, investigating similar patterns in other ecosystems could broaden our ecological perspective. Interestingly, the outliers observed in the Ridge Regression model signal a need for more sophisticated modeling techniques to fully capture the complexities of ecological data. These results underscore the value of predictive models in identifying key indicators of wetland health, guiding effective conservation strategies. By focusing on these aspects, we can support the sustainability of riparian wetlands and the essential services they provide.
References
[1] Wantzen, Karl M., et al. “7 - Riparian Wetlands of Tropical Streams.” Tropical Stream Ecology, edited by David Dudgeon, Academic Press, 2008, pp. 199–217. [2] Nilsson, Christer, et al. “The Role of Hydrochory in Structuring Riparian and Wetland Vegetation.” Biological Reviews, vol. 85, no. 4, Nov. 2010, pp. 837–58. [3] Dunea, Daniel, et al. “Effects of Riparian Vegetation on Evapotranspiration Processes and Water Quality of Small Plain Streams.” Ecohydrology & Hydrobiology, vol. 21, no. 4, Oct. 2021, pp. 629–40. [4] Kiss, Tímea, and István Fehérváry. “Increased Riparian Vegetation Density and Its Effect on Flow Conditions.” Sustainability, vol. 15, no. 16, Jan. 2023, p. 12615. [5] Tabacchi, Eric, et al. “Impacts of Riparian Vegetation on Hydrological Processes.” Hydrological Processes, vol. 14, no. 16–17, Nov. 2000, pp. 2959–76. [6] Yao, Siyang, et al. “Combining Process-Based Model and Machine Learning to Predict Hydrological Regimes in Floodplain Wetlands under Climate Change.” Journal of Hydrology, vol. 626, Nov. 2023, p. 130193. [7] Pace, G., et al. “Remote Sensing Indicators to Assess Riparian Vegetation and River Ecosystem Health.” Ecological Indicators, vol. 144, Nov. 2022, p. 109519. [8] Hupp, Cliff R., and W. R. Osterkamp. “Riparian Vegetation and Fluvial Geomorphic Processes.” Geomorphology, vol. 14, no. 4, Jan. 1996, pp. 277–95. [9] Loheide, Steven P., and Steven M. Gorelick. “Riparian Hydroecology: A Coupled Model of the Observed Interactions between Groundwater Flow and Meadow Vegetation Patterning.” Water Resources Research, vol. 43, no. 7, July 2007, p. 2006WR005233. [10] Holland, Kate L., et al. “Effectiveness of Artificial Watering of a Semi?arid Saline Wetland for Managing Riparian Vegetation Health.” Hydrological Processes, vol. 23, no. 24, Nov. 2009, pp. 3474–84. [11] Hogan, Dianna M., and Mark R. Walbridge. “URBANIZATION AND NUTRIENT RETENTION IN FRESHWATER RIPARIAN WETLANDS.” Ecological Applications, vol. 17, no. 4, June 2007, pp. 1142–55. [12] Vidon, Philippe G., et al. “Twenty Years of Riparian Zone Research (1997–2017): Where to Next?” Journal of Environmental Quality, vol. 48, no. 2, Mar. 2019, pp. 248–60. [13] Schneider, Christof, et al. “Hydrological Threats to Riparian Wetlands of International Importance – a Global Quantitative and Qualitative Analysis.” Hydrology and Earth System Sciences, vol. 21, no. 6, June 2017, pp. 2799–815.
Copyright
Copyright © 2024 Sudith Thota, Sahasra Gangineni , Kontham Reddy. This is an open access article distributed under the Creative Commons Attribution License, which permits unrestricted use, distribution, and reproduction in any medium, provided the original work is properly cited.

Download Paper
Paper Id : IJRASET64251
Publish Date : 2024-09-16
ISSN : 2321-9653
Publisher Name : IJRASET
DOI Link : Click Here
 Submit Paper Online

