

Ijraset Journal For Research in Applied Science and Engineering Technology
Empowering Lives through Water Sustainability: Assessing the Impact of Limited Access on Irula Women in Thethampakkam, Pondicherry
Authors: R. Arunkumar, Vihaan Sriram, Gautham. G, Hemasri Shakthi. C, Dharshan. V, Rejina. M
DOI Link: https://doi.org/10.22214/ijraset.2025.66547
Certificate: View Certificate
Abstract
This study investigates the challenges of water sustainability in Thethampakkam, Pondicherry, with a focus on the daily lives of 117 Irula women residing in the village. The research highlights the significant difficulties these women face in accessing clean drinking water, as the majority rely on public standposts located 101-150 meters from their homes. Limited water access disrupts their daily routines, causing delays in cooking, late arrivals at school or work, and exacerbating physical violence. These challenges underscore the critical role water access plays in the socio-economic and physical well-being of the Irula community. The findings emphasize the urgent need for sustainable water management solutions to improve the quality of life for the women and their families, fostering equity and resilience within the community.
Introduction
I. INTRODUCTION
The village of Thethampakkam is in the latitude 11°59'58.0"N and longitude 79°40'53.0"E. The total population of the village is 298 people which consists of 145 women and 153 men. The study was conducted among 117 women in the Irula community of Thethampakkam who were above the age of 18. Water is a fundamental human right, and access to clean drinking water is essential for human survival. However, many communities around the world, including Thethampakkam, Pondicherry, face significant challenges in accessing clean drinking water. This study aims to explore the impact of limited water access on the daily lives of women in Thethampakkam, with a focus on the social, economic, and environmental implications.
In Thethampakkam, the reliance on public stand posts for drinking water is common, with women bearing the brunt of the burden. The daily struggle to fetch water from these stand posts, often located at a considerable distance from their homes, has an impact on their daily lives. The time spent fetching water means delayed cooking, late arrivals at school or work for the rest of the family, and increased physical violence, ultimately affecting their overall well-being and that of their families.
Furthermore, lack of access to clean drinking water can cause nutritional problems. Women often have to spend a lot of time getting water instead of preparing meals, which means their families, especially children, don't get enough nutritious food. As a result, they become more prone to malnutrition.
Objectives:
- To assess the current water access and usage patterns among Irula women in Thethampakkam.
- To identify the challenges, they face in accessing clean water.
- To identify the impact of limited water access on the daily lives of Irula women, including their health, education, and economic opportunities.
- To develop a comprehensive plan to enhance water sustainability in Thethampakkam, Pondicherry, and improve the daily lives of Irula women.
- To promote the adoption of sustainable water practices among Irula women and the wider community in Thethampakkam, Pondicherry.
II. METHODOLOGY
A comprehensive survey was conducted among 117 women from the Irula community residing in Thethampakkam, with most of them being from nuclear families and working. The survey aimed to gather information on their daily water usage, including the distance and time taken to fetch water, as well as the impact of limited water access on their daily routines.
The survey also included questions on the social and economic implications of limited water access, including the impact on cooking, school, work, and family relationships.
Table 1: The distribution of the Irula women based on their age
|
Age Group |
Sum of Frequency |
|
18-25 |
24 |
|
26-40 |
31 |
|
41-50 |
18 |
|
51-60 |
28 |
|
>60 |
16 |
|
Grand |
|
|
Total |
117 |
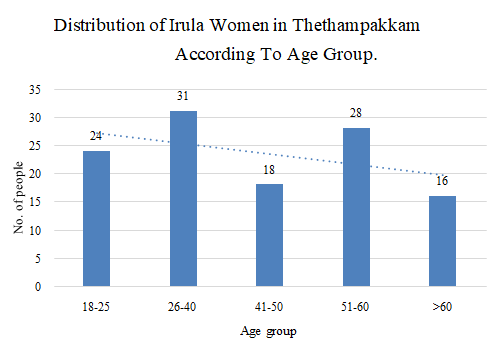
Graph 1: Distribution of Irula Women in Thethampakkam
The distribution of Irula women in Thethampakkam in (Graph 1) according to age group reveals a diverse age distribution among the community. Out of the 117 Irula women surveyed, the largest age group is 26-40 years, comprising 26% (31 women) of the total sample. This age group is likely to be in their prime working years, with many of them being responsible for managing household chores, including water collection and management. The next largest age group is 18-25 years, comprising 21% (24 women) of the total sample, followed by 51-60 years, comprising 24% (28 women) of the total sample. The 41-50 year age group accounts for 15% (18 women) of the total sample, while the 18-25 year age group accounts for 20% (24 women) of the total sample. The smallest age group is above 60 years, comprising 14% (16 women) of the total sample. This distribution suggests that the Irula women in Thethampakkam have a relatively balanced age distribution, with a significant proportion of women in their prime working years and a smaller proportion of older women.
Table 2: Distribution of Irula women according to socio-economic profiles
|
1 |
|
Type of house |
No. |
|
Thatched |
102 |
||
|
Tiled |
9 |
||
|
RCC* |
6 |
||
|
2 |
|
Type of family |
|
|
Nuclear family |
85 |
||
|
Joint family |
23 |
||
|
Broken family |
9 |
||
|
3 |
|
Educational status |
|
|
Illiterate |
51 |
||
|
Up to secondary |
32 |
||
|
Up to higher secondary |
26 |
||
|
Postgraduate |
8 |
||
|
4 |
|
Working status |
|
|
Working |
86 |
||
|
Non-working |
31 |
||
|
5 |
Monthly income(Rs.) |
||
|
1000 – 1999 |
13 |
||
|
2000 – 2999 |
38 |
||
|
3000 – 3999 |
17 |
||
|
4000 – 4999 |
34 |
||
|
5000 – above |
15 |
||
|
6 |
|
Food habits |
|
|
Non-vegetarian |
91 |
||
|
Vegetarian |
26 |
||
|
7 |
|
Illness suffered from disease |
|
|
Fever |
68 |
||
|
Cough |
71 |
||
|
Dysentery |
22 |
||
|
Dental caries |
41 |
||
|
Stomach ache |
67 |
||
|
Skin disease |
28 |
||
|
Jaundice |
6 |
||
|
Asthma |
15 |
||
|
Ortho problem |
11 |
||
|
Cardiac disease |
19 |
||
|
Diabetic |
9 |
||
|
Visual problem |
11 |
||
|
|
|
Hearing Problem |
14 |
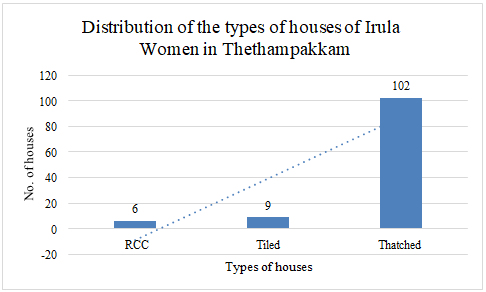
Graph 2: Types of houses
The distribution of the types of houses of Irula women in Thethampakkam in (Graph 2) reveals a significant disparity in the types of houses among the community. Out of the 117 Irula women surveyed, the majority (87%, or 102 women) live in houses with thatched roofs, which are traditional and common in rural areas. This is likely because thatched roofs are often less expensive and easier to construct than other types of roofs. The next largest group is those with tiled roofs, comprising 8% (9 women) of the total sample. This may indicate that some Irula women are adopting more modern and durable roofing materials. The smallest group is those with RCC (Reinforced Cement Concrete) roofs, comprising 5% (6 women) of the total sample.
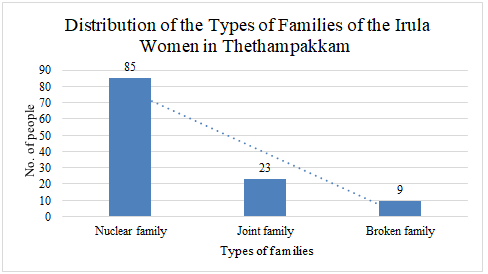
Graph 3: Types of families
The distribution of the types of families of the Irula women in Thethampakkam in (Graph 3) reveals a significant trend in the family structures among the community. Out of the 117 Irula women surveyed, the majority (73%, or 85 women) come from nuclear families. This is likely due to the fact that nuclear families are becoming increasingly common in modern society, and may be influenced by factors such as urbanization and changing social norms. The next largest group is those from joint families, comprising 20% (23 women) of the total sample. Joint families are traditional and common in many Indian communities, where multiple generations of a family live together under one roof. The smallest group is those from broken families, comprising 8% (9 women) of the total sample.
The distribution of the educational qualification of Irula women in Thethampakkam in (Graph 4) reveals a significant trend in education among the community. Out of the 117 Irula women surveyed, the majority (44%, or 51 women) are illiterate, meaning they have not received any formal education. The next largest group is those who have studied till secondary school, comprising 27% (32 women) of the total sample. This may indicate that some Irula women have had access to education but may not have pursued higher education due to various reasons. The third largest group is those who have studied till higher secondary, comprising 22% (26 women) of the total sample. This may suggest that some Irula women have had access to higher education but may not have pursued post-graduate studies due to various reasons such as financial constraints or lack of opportunities.
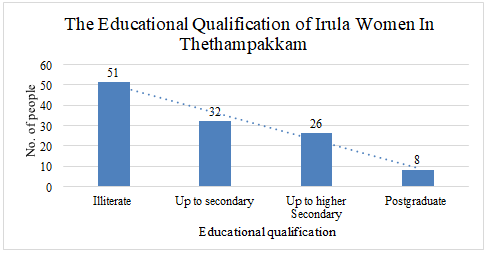
Graph 4: Educational qualifications
The smallest group is those who have done post-graduation, comprising 7% (8 women) of the total sample. This may indicate that a small proportion of Irula women have had access to higher education and have pursued postgraduate studies, possibly due to their academic ability, financial resources, or access to educational opportunities.
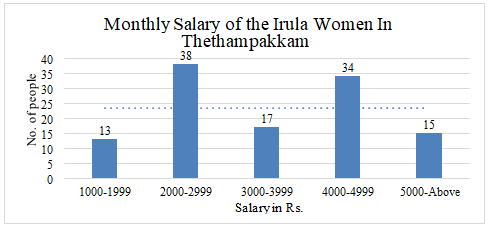
Graph 5: Monthly income
The monthly salary of the Irula women in Thethampakkam in (Graph 5) reveals a significant trend in the income levels among the community. Out of the 117 Irula women surveyed, the majority (29%, or 34 women) have a monthly salary ranging from 4000-4999. This may indicate that many Irula women are engaged in occupations that provide a stable income. The next largest group is those who have a monthly salary ranging from 2000-2999, comprising 32% (38 women) of the total sample. This may suggest that some Irula women are engaged in occupations that provide a moderate income, such as casual labour or small-scale business. The third largest group is those who have a monthly salary ranging from 3000-3999, comprising 15% (17 women) of the total sample. This may indicate that some Irula women are engaged in occupations that provide a higher income, such as skilled labour or small-scale entrepreneurship. The smallest group is those who have a monthly salary above 5000, comprising 13% (15 women) of the total sample. This may suggest that a small proportion of Irula women are engaged in occupations that provide a high income. The group with the lowest income, ranging from 1000-1999, comprises 11% (13 women) of the total sample. This may indicate that some Irula women are engaged in occupations that provide a low income.
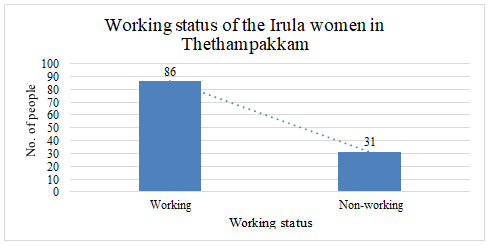
Graph 6: Working status
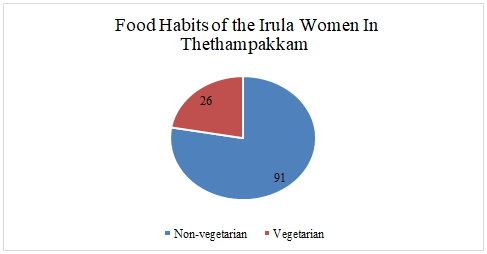
Graph 7: Food habits
The food habits of the Irula women in Thethampakkam in (Graph 7) reveals a significant trend in the dietary preferences among the community. Out of the 117 Irula women surveyed, the majority (78%, or 91 women) are non-vegetarian, indicating that many Irula women consume meat, fish, and other animal products as part of their diet. This may be due to various factors such as cultural and traditional practices, availability of meat and other animal products in the community, or personal preferences. The remaining 22% (26 women) are vegetarian, which may be due to various reasons such as religious beliefs, health concerns, or personal preferences.
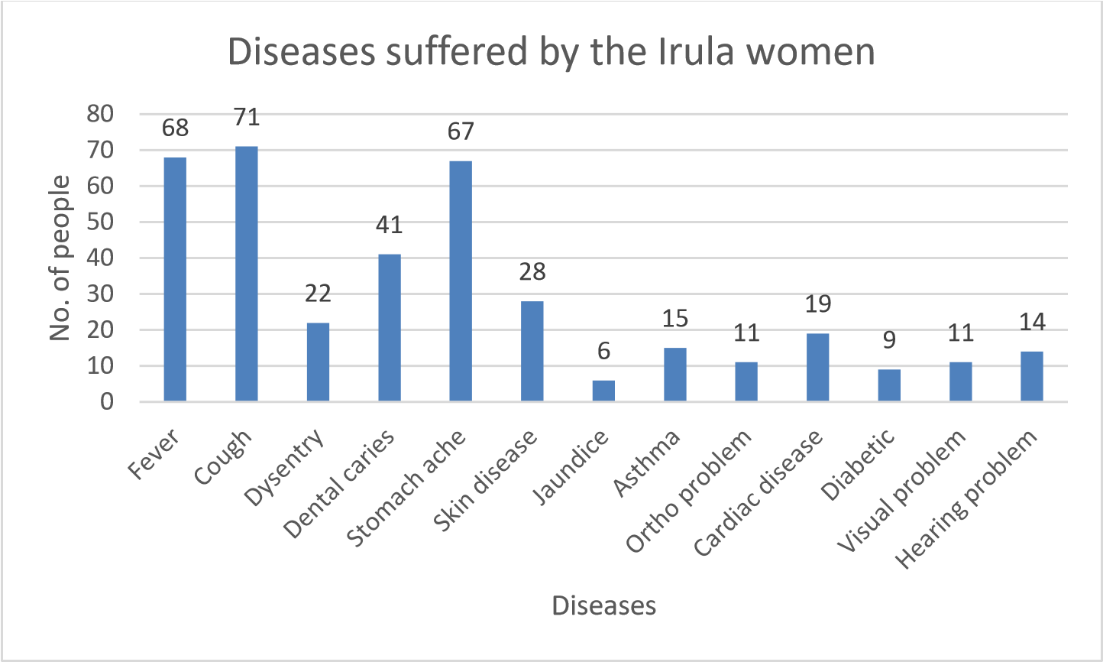
Graph 8: Illness suffered from diseases
The diseases that Irula women suffer with reveals a significant trend in the health issues among the community. Out of the 117 Irula women surveyed, the majority (60%, or 71 women) have cough, indicating that respiratory issues are a common health problem among Irula women. The next most common health issue is fever, which affects 58% (68 women) of the sample. Other common health issues include stomach ache (57%, or 67 women), dental caries (35%, or 41 women), and dysentery (19%, or 22 women). Skin diseases, asthma, and ortho problems are less common, affecting 24%, 13%, and 9% of the sample, respectively. Cardiac diseases, diabetes, visual problems, and hearing problems are relatively rare, affecting 16%, 8%, 9%, and 12% of the sample, respectively. Jaundice is the least common health issue, affecting only 5% (6 women) of the sample. The high prevalence of respiratory issues, fever, and stomach ache among Irula women highlights the need for healthcare initiatives that focus on preventing and managing these conditions.
Table 3: Distribution of sources of drinking water for Irula women in Thethampakkam.
|
Source of drinking water Within premises |
No. |
|
0 |
|
|
Outside premises |
117 |
(Table 3) shows that distribution of sources of drinking water for Irula women in Thethampakkam reveals a significant trend in the sources of drinking water among the community. Out of the 117 Irula women surveyed, 100% (117 women) reported that they obtain their drinking water from outside their premises. This indicates that none of the Irula women in Thethampakkam obtain their drinking water from within their premises, such as a well or a bore well. Instead, they rely on external sources. This may be due to various reasons such as lack of access to clean water within their premises, lack of infrastructure for water collection and storage, or cultural and traditional practices.
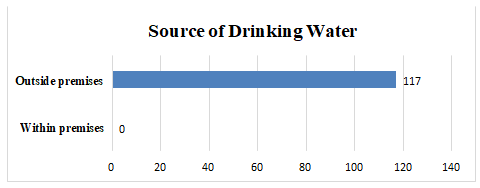
Graph 9: Source of Drinking Water
Table 4: Distribution of access to safe and unsafe water sources for Irula women in Thethampakkam.
|
Access to safe and unsafe drinking |
|
|
water |
No. |
|
Safe drinking water |
117 |
|
Unsafe drinking water |
0 |
(Table 4) shows that distribution of access to safe and unsafe water sources for Irula women in Thethampakkam reveals a significant trend in the access to safe and unsafe water sources among the community. Out of the 117 Irula women surveyed, 100% (117 women) reported that they have access to safe drinking water sources. This indicates that all Irula women in Thethampakkam have access to clean and safe drinking water, which is essential for their health and well-being. The high percentage of Irula women having access to safe drinking water highlights the importance of maintaining and improving access to safe water sources in the community.
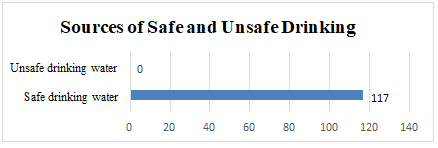
Table 5: Sources of safe water for Irula women.
|
Sources of safe drinking water |
No. |
|
Public stand posts |
117 |
|
Well |
0 |
|
Hand pump |
0 |
|
Tap water |
0 |
(Table 5) shows that sources of safe water for Irula women reveals a significant trend in the sources of safe water among the community. Out of the 117 Irula women surveyed, 100% (117 women) reported that they get their safe drinking water from public stand post this indicates that all Irula women in Thethampakkam rely on public stand posts as their primary source of safe drinking water. This may be due to various reasons such as the availability of public stand posts in the community, the convenience of accessing water from these sources, or the lack of alternative sources of safe drinking water.
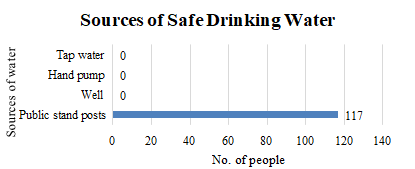
Table 6: Distance covered by women from the Irula community in fetching water
|
Distance covered in fetching water |
No. |
|
0 - 50 m |
23 |
|
51 - 100 m |
29 |
|
101 - 150 m |
38 |
|
151 - 200 m |
27 |
The statistics presented in (Table 6) show that the distance covered by women from the Irula community in fetching water reveals a significant trend in the distance covered by women to fetch water. Out of the 117 Irula women surveyed, 20% (23 women) reported that they have
Public stand posts within 50-100 meters, 21% (29 women) reported that they have public stand posts within 51-100 meters, 32% (38 women) reported that they have public stand posts within
101-150 meters, and 23% (27 women) reported that they have public stand posts within 151-
200 meters. This indicates that the majority of Irula women have to cover a distance of at least 100 meters to fetch water from public stand posts.
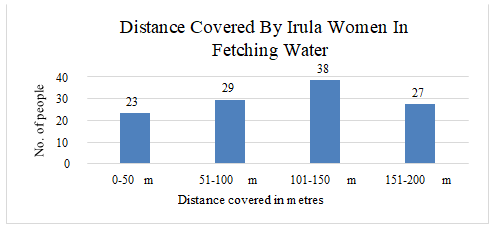
Table 7: Information on fetching water by women from the Irula community
|
Fetching of water |
No. |
|
Average number of times bringing water |
4 |
|
Average time per trip to fetch water (in mins.) |
15.5 |
|
Average distance covered to fetch water (in meter) |
100.5 |
The evidence and statistics in (Table 7) on fetching water by women from the Irula community reveals a significant trend in the frequency, time, and distance covered by women in fetching water. Out of the 117 Irula women surveyed, the average number of times they bring water per day is 4 times, indicating that they have to fetch water multiple times a day. The average time taken to fetch water is 15.5 minutes, which may be due to various reasons such as the distance covered, the availability of water sources, or the physical demands of fetching water. The average distance covered is 100.5 meters, which may be due to the location of public stand posts, the availability of alternative sources of water, or the lack of infrastructure for water collection and storage. Fetching water multiple times a day, taking a significant amount of time, and covering a considerable distance can be physically exhausting and time-consuming.
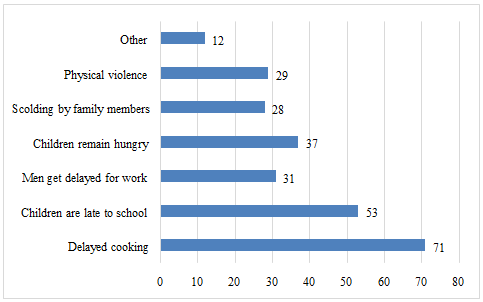
Table 8: Problems faced by the women from the Irula community when fetching water is delayed
|
Variables |
No. |
|
Delayed cooking |
71 |
|
Children are late to school |
53 |
|
Men get delayed for work |
31 |
|
Children remain hungry |
37 |
|
Scolding by family members |
28 |
|
Physical violence |
29 |
|
Other |
12 |
(Table 8) shows the problems faced by the women from the Irula community when fetching water is delayed reveals a significant trend in the problems faced by women when they are delayed in fetching water. 71 women reported that they are delayed in cooking, which can lead to food insecurity and malnutrition. 53 women reported that their children are late to school, which can impact their education and future prospects. 31 women reported that their men are delayed for work, which can impact their livelihoods and financial stability. 37 women reported that their children remain hungry, which can lead to malnutrition and other health problems. 28 women reported that they are scolded by family members, which can lead to feelings of guilt and shame. 29 women reported that they face physical violence, which is a cause for concern and highlights the need for initiatives that address the root causes of violence against women. 12 women reported that they face other problems, which suggests that there may be other issues that are not being addressed.
Overall, this data highlights the significant impact that delayed water fetching has on the daily lives of Irula women and the need for initiatives that address the root causes of delayed water fetching and provide support to Irula women in their daily lives.
III. RESULTS
The survey revealed that many of the women in the Irula community rely on public stand posts for their drinking water needs, with an average distance of 101-150 meters from their homes. The average time taken to fetch water was 15 minutes, and the average distance covered was 100 meters. The results also showed that:
- 71 people were delayed in cooking due to the lack of access to clean drinking water.
- 53 people were late to school or work due to the time spent fetching water.
- 31 people were late to work due to the lack of access to clean drinking water.
- 37 children remained hungry due to the lack of access to clean drinking water.
- 28 people were scolded by family members due to the lack of access to clean drinking water.
- 29 women faced physical violence due to the lack of access to clean drinking water.
IV. DISCUSSION
The findings of this study highlight the significant impact of limited water access on the daily lives of the Irula women in Thethampakkam. The reliance on public stand posts for drinking water leads to significant delays in daily routines, including cooking, school, and work. The results also suggest that the lack of access to clean drinking water contributes to increased physical violence and hunger among children. The study also highlights the social and economic implications of limited water access, including the impact on family relationships and the overall well-being of the women and their families.
Social awareness:
We distributed posters highlighting the importance of boiling water and other safe ways of consuming and using potable water. We also conducted a presentation to educate the community about the risks associated with consuming water that is not safe, such as water-borne diseases and health complications. Out of the 117 people who attended the activity, 67 (57%) reported that they had not been aware of the importance of boiling water before the activity. However, after the activity, 42 (36%) of these individuals reported that they had started boiling their water regularly. Additionally, 15 (13%) reported that they had started using other safe ways of consuming and using water, such as using water filters or purifiers. The campaign was successful in raising awareness about the importance of boiling water and other safe ways of consuming and using water among the community members. The results indicate that a significant number of people were able to adopt safe water habits after the activity, which is a positive step towards enhancing water sustainability in Thethampakkam.
Conclusion
The study highlights the need for improved water sustainability in Thethampakkam, Pondicherry for the Irula community. The reliance on public stand posts for drinking water is unsustainable and has significant impacts on the daily lives of the Irula women. Women in the village face numerous challenges while fetching water, including long queues, limited availability of water, and physical strain due to carrying heavy water containers. This not only consumes a significant amount of their time, but also hinders their ability to engage in other important activities such as education, employment, and personal care. Further, the lack of proper sanitation and hygiene facilities near the public stand posts poses a significant risk to their health and well-being. To address this issue, the village administration and local authorities should prioritize the installation of individual water connections and improve the maintenance of public stand posts. Additionally, education and awareness programs should be implemented to promote water conservation and efficient use of this precious resource. Furthermore, the village administration should also consider providing alternative solutions such mobile water tankers to reduce the burden on women and ensure equal access to clean drinking water. By addressing these issues, the village can improve the overall quality of life for its residents, particularly women, and promote a more sustainable and equitable future.
References
1) R ArunKumar, M.Tech., B.Ed., MISTE., MIAENG, TGT Physics, Shree Bharath Vidyaashram CBSE Senior Secondary School, Agaram, Ossudu, Pondicherry. Arunkumareee91@yahoo.com 2) Vihaan Sriram Shree Bharath Vidyaashram CBSE Senior Secondary School, Agaram, Ossudu, Pondicherry. Vihaanaadira11@gmail.com 3) Gautham. G Shree Bharath Vidyaashram CBSE Senior Secondary School, Agaram, Ossudu, Pondicherry. preethikagoutham@gmail.com 4) Hemasri Shakthi. C Shree Bharath Vidyaashram CBSE Senior Secondary School, Agaram, Ossudu, Pondicherry. Crdhesh2007@gmail.com 5) Dharshan. V Shree Bharath Vidyaashram CBSE Senior Secondary School, Agaram, Ossudu, Pondicherry. dharshanmurugan@gmail.com 6) Rejina. M Shree Bharath Vidyaashram CBSE Senior Secondary School, Agaram, Ossudu, Pondicherry. mmariyappan@yahoo.in
Copyright
Copyright © 2025 R. Arunkumar, Vihaan Sriram, Gautham. G, Hemasri Shakthi. C, Dharshan. V, Rejina. M. This is an open access article distributed under the Creative Commons Attribution License, which permits unrestricted use, distribution, and reproduction in any medium, provided the original work is properly cited.

Download Paper
Paper Id : IJRASET66547
Publish Date : 2025-01-16
ISSN : 2321-9653
Publisher Name : IJRASET
DOI Link : Click Here
 Submit Paper Online