Ijraset Journal For Research in Applied Science and Engineering Technology
- Home / Ijraset
- On This Page
- Abstract
- Introduction
- Conclusion
- References
- Copyright
Assessment of Traffic at Selected Intersection of Porbandar City
Authors: Niralee Lakhana , Shekhar Parmar
DOI Link: https://doi.org/10.22214/ijraset.2024.62406
Certificate: View Certificate
Abstract
Transportation is the most important aspect for the development of urban areas and also country’s economy relies on it. In this project, traffic at intersections of Porbandar city is studied. Owing to tremendous growth in population, vehicle growth and concentrated development resulted into traffic congestion which calls for the demand of changing the geometry especially at the intersections which are not controlled appropriately and it has also decreased the facilities of pedestrian. Due to lack of enough land, adding new lanes or constructing a grade separator to increase capacity or improving the traffic flow is not an easy task. However, efficient usage of the existing infrastructure which doesn’t cost much could be a proper solution to overcome the congestion issue. The main aim of my project is to give safe and speedy movement of vehicles within the city. As now a day’s traffic issues and accidents are the main problem within the city. By providing necessary solutions to these issues, I am trying to reduce accidental as well as traffic issue So that people can reach at particular place within short time and with safety. By this project, after surveying various area of city i will give possible solutions to certain problems related to traffic so that citizens can enjoy their ride with joy without much fear of accidental issues. By providing modern ideas for traffic and accidental issues, I will try to give ideas for the speed reduction of vehicles within specified limit, which is the main problem of city after construction of new concrete road.
Introduction
I. INTRODUCTION
Traffic engineering is that part of engineering which manages the improvement of traffic execution on street system and terminals through methodical traffic studies, logical examination and designing applications. Traffic engineering incorporates arranging and geometric plan on one hand and guideline and control on other hand. Traffic designing along these lines manages the use of logical standards devices, systems and discoveries for sheltered, fast, affordable and productive development of vehicles and people on foot.
The traffic in India and many developing countries of the world is heterogeneous in nature. The available road space is occupied by different classes of vehicle with widely varying characteristics. The study of vehicular characteristics is an essential part. The different vehicular qualities influencing the street configuration might be delegated static and dynamic attributes of the vehicles. Static qualities of vehicles influencing the street configuration are the important measurements, greatest turning point and the all-out weight of vehicle.
The height of driver seat affects the visibility distance. Dynamic characteristics of vehicles that affect the road design are speed, acceleration/deceleration and braking characteristics. Traffic clashes between vehicular developments are made when at least two streets crossed one another. Such clashes may cause postponement and traffic clogs with the likelihood of street mishaps. Along these lines every convergence requires traffic control. It is managed with traffic lights, stop signs, indirect and so forth. The regular kind of convergence is the non-signalized crossing point, which is utilized to control low volume of traffic stream among major and minor lanes.
Controlling traffic flow is one of the most import components of Traffic Engineering. Traffic flow control can be achieved by limiting number of vehicles through a certain section of roadways by providing alternative road and also by diverging traffic to one direction.
The methods used to control flow depends on the type of roads, the community it is running through, public demand, business demand, volume or traffic etc. Traffic clashes between vehicular developments are made when at least two streets crossed one another. Such clashes may cause postponement and traffic blockages with the likelihood of street mishaps. India has primarily four noteworthy periods of transportations: Road transportation, railroad transportation, water transportation and air transportation.
II. PROBLEM STATEMENT
Traffic congestion at intersections is a major problem in urban areas. It leads to increased travel time, fuel consumption, and air pollution. The problem is caused by a variety of factors such as poor traffic signal timing, inadequate road infrastructure, and increasing vehicle volumes. The objective of this project is to develop a solution that can effectively reduce traffic congestion at intersections. The solution should be cost-effective, feasible, and easy to implement.”
A. Objective Of Study
To assess and evaluate the existing traffic constraints, problems and issues due to road intersection as well as railway crossings at the selected study area. To suggest improvement measures for selected intersection of Porbandar city.
B. Aim Of Study
The aim of this research is to find out the different traffic and pedestrian related problems arising at road intersections. To identify and reduce the several conflict points at selected intersections of study area. To study several traffic calming measures for controlling the speed of vehicles. To study several methods for reducing the traffic congestion problems at intersection. To provide suggestions for the necessary modifications for the improvement of the vehicular movement at road intersection.
C. Need Of Project
The design of at grade intersection when it is in close proximity with railway crossing is more complex and problematic. Intersections are critical locations in the road network in terms of capacity, level of service and safety. Intersections are high risk locations for road crashes because road users on conflicting paths in intersection are required to use the same space. To decrease the number of crashes or accidents at road intersections. To minimize the conflict areas at the intersection. To determine adequacy of traffic control devices at Rail-road grade crossings of selected study area. To reduce the traffic related problems in a particular area as I’m taking area of MG road in Porbandar. To satisfy the present need and fulfill future demands of the traffic.
III. Fundamentals
All paragraphs must be indented. All paragraphs must be justified, i.e. both left-justified and right-justified.
A. Conflict Points On Intersection
- A conflict point is the point at which a highway use crossing, merging with, or diverging from a road or driveway conflicts with another highway user using the same road or driveway.
- It is any point where the ways of two through or turning vehicles diverge, merge, or cross.
- Conflicts points can be decreased by overseeing following things;
- By restricting the quantity of contention focuses that a vehicle may involvement in its movement venture.
- By isolating clash focuses however much as could be expected (in the event that they can't be totally disposed of)
- By evacuating slower turning vehicles that expect access to nearby destinations from the through traffic paths as proficiently as would be prudent
B. Traffic Engineering Studies And Analysis
The traffic engineering studies carried out for collecting traffic data are also called traffic survey. Traffic engineering studies are carried out to analyses the traffic characteristics and their movements along the identified roads. The results of these studies are used for the design of geometric features and traffic control measures for safe and efficient traffic movement. The analyses of results of these studies are also useful for assessing the need of the proposed rad project with justifications.
The different traffic engineering studies generally carried out are:
- Traffic volume studies
- Spot speed studies
- Speed and delay studies
- Origin and destination (O & D) studies
- Parking studies
- Accident studies
a. Traffic volume is a measure to evaluate the traffic stream.
b. Traffic volume or traffic stream is communicated as the quantity of vehicles that go over given transverse line of the street amid unit time.
c. As the carriageway width of the streets may differ, the traffic volume is commonly communicated as number of vehicles every hour out of each day, per traffic path
Though the roadway width including the number of lanes decided based on the design traffic flow or volume, all the vehicles do not keep moving during the entire day. Some portion of traffic will need to stop or park at the desired locations for different durations
IV. literature review
- Examining traffic crash injury severity at unsignalized intersections.
Authors: Kirolos Haleem
Summary: In this examination, crash damage seriousness is broken down. The fundamental target of this investigation is to recognize the noteworthy elements that add to damage seriousness at unsignalized crossing points. This distinguishes those geometric, traffic, and driver-related components prompting serious accidents at those crossing points. Scientists have utilized numerous factual procedures to break down driver damage seriousness, and those systems have been utilized broadly in rush hour gridlock wellbeing investigation. Instances of those procedures are the multinomial logit, settled logit, and requested probit models. Despite the fact that the work directed in this investigation has demonstrated that the double and requested probit models are more fitting than the settled logit show for breaking down accident damage seriousness at unsignalized crossing points. In spite of the fact that the work completed in this examination gave valuable data about different geometric, traffic, and driver factors influencing crash wounds at three-and four-legged unsignalized convergences. This outcome proposes that spatial relationship between convergences exists, and unsignalized crossing points ought not be treated as disengaged areas.
2. Traffic management project in Phnom Penm
Authors: Seiya Matsuoka
Summary: The project covers the installation of traffic signals at intersections. Video vehicle detectors also are to be installed. The renewal of pavement markings, provision for median dividers, and installation of traffic signs and repair of damaged pavement are also included in project. Objectives of the project are: - 1) To improve road traffic conditions. 2) To transfer the technology of traffic engineering and management to local counterparts. Traffic is caused due to improper parking, lack of discipline, poor driving behavior, etc. Traffic safety are not obtained by traffic engineering works only, education and enforcement are equally important. Various safety considerations in signal design are: 1) two sets of lanterns for each movement 2) left turn phase 3) additional left turn lane at intersection 4) pedestrian lantern.
Features of the system are 1) high reliability local controller with redundant tail sate functions 2)use of vehicle detector 3) extensive use of adaptive control 4) improved pavement marking. Due to this system there will be advantages like: -stop education –delay reduction –crash reduction. Traffic was counted by playing the video. The actual count was converted into PCU (passenger car units). Road survey was done and measurements were taken
3. Managing traffic congestion in the Accra Central Market, Ghana
Authors: Frances Agyapong, Thomas
Summary: The investigation looked to survey the administration of traffic clog in the Accra Central Market. The impacts of traffic blockage are diminishing deals and efficiency and cause pressure. Measures to be set up to oversee traffic clog in the Accra Central market are multifaceted. The investigation utilized an exploratory plan to test 300 respondents through the organization of surveys. Top to bottom meetings were led with four authorities of the board establishments in Accra.
From the examination, it very well may be inferred that the positioned reasons for traffic blockage in the Accra Central market are the awful frame of mind of dealers, tight streets, awful behavior of drivers, poor street plan, terrible disposition of people on foot and mishaps. The authorities of the Motor Transport and Traffic Department (MTTD) of the Ghana Police Service or prepared traffic superintendent or team ought to coordinate the progression of traffic.
Likewise, no halting/stopping sign ought to be mounted on the ways to the market. Guilty parties are to captured and indicted by the portable court. Show of products by dealers/sellers on person on foot walkway ought to be disheartened and wrongdoers are to be fined or their products seized by the Ghana Police.
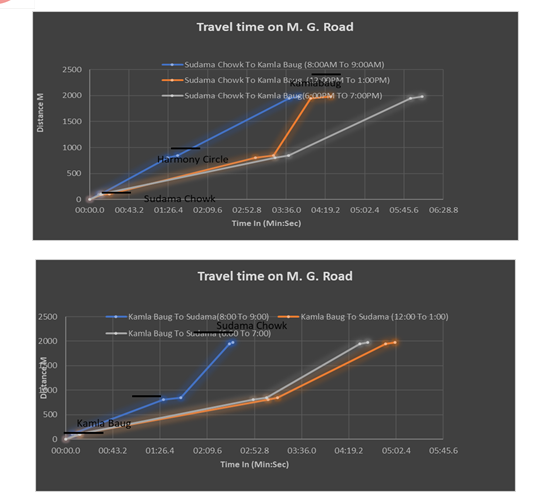
VII. RECOMMENDATIONS
- Establish/setting up of a traffic engineering and management unit in Municipal Corporation..
- Unauthorized stalls, parking, hawkers at footpath forces pedestrians to walk on carriage way exposing themselves to traffic stream leading to traffic congestion. So it should be removed from the both intersections. This can be done by installing NO PARKING and NO WAITING signs at intersection to discourage parking at sidewalks.
- As per Roadside Interview Survey, it is observed that there is no strict police enforcement which encourages unauthorized trading and hawking at intersections. So it is suggested to provide better police enforcement at the both intersections. Also road-side hawking and trading should be restricted up to a distance of 200 m from the intersection.
- The use of sidewalks as parking area is encouraged by the low height of kerbs.
VIII. ACKNOWLEDGEMENT
Research brings about dramatic changes in the traditional lookout of science and technology. It has widened our vision, opened up newer avenues and lightened the dark obscure facts of mysterious universe. Behind every success there are lot many efforts, but efforts are fruitful due to hands making the passage smoother. I express my deep sense of gratitude for hands, people extended to me during my work.
I would like to express my sincere gratitude and appreciation to all those who contributed to the successful completion of my project thesis report, titled "Assessment of traffic at selected intersection of Porbandar..."I extend my heartfelt thanks to my dedicated project guide, Mr. Shekhar H. Parmar (Assistant professor), for their invaluable guidance, unwavering support, and insightful feedback throughout the course of this project. Their expertise has been instrumental in shaping and refining my work. I am also thankful to Mr. Bonny M. Bhut (Assistant Professor) for their constructive critiques and valuable suggestions that have enriched the quality of this thesis. Special thanks to my peers and colleagues for their collaborative spirit and for sharing their knowledge and experiences, which significantly contributed to the overall development of this project. I would like to acknowledge the support of my family and friends, whose encouragement and understanding have been a constant source of motivation. Last but not least, I express my gratitude to the academic institution for providing the necessary resources and environment conducive to research and learning. This project has been a journey of growth and learning, and the contributions of each individual mentioned above have played a crucial role in its successful completion. Thank you for being an integral part of this academic endeavor.
Conclusion
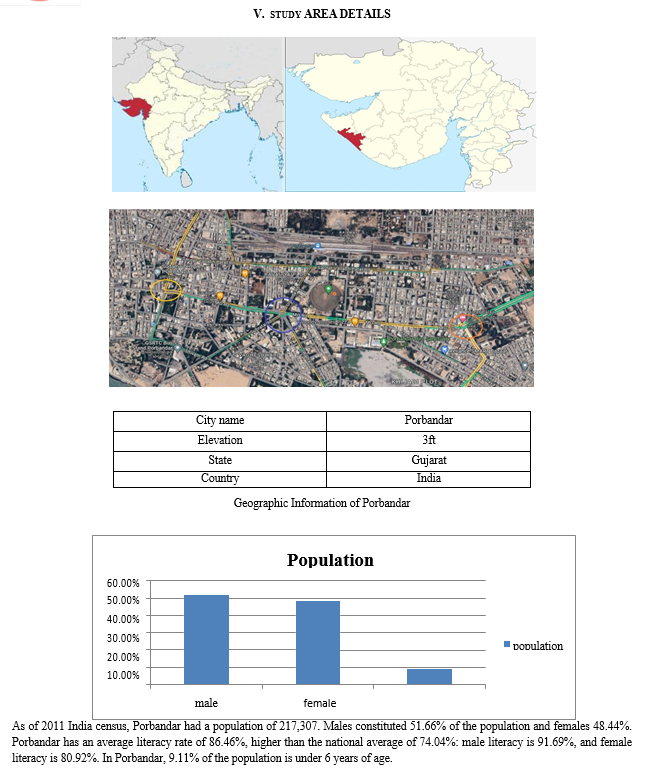
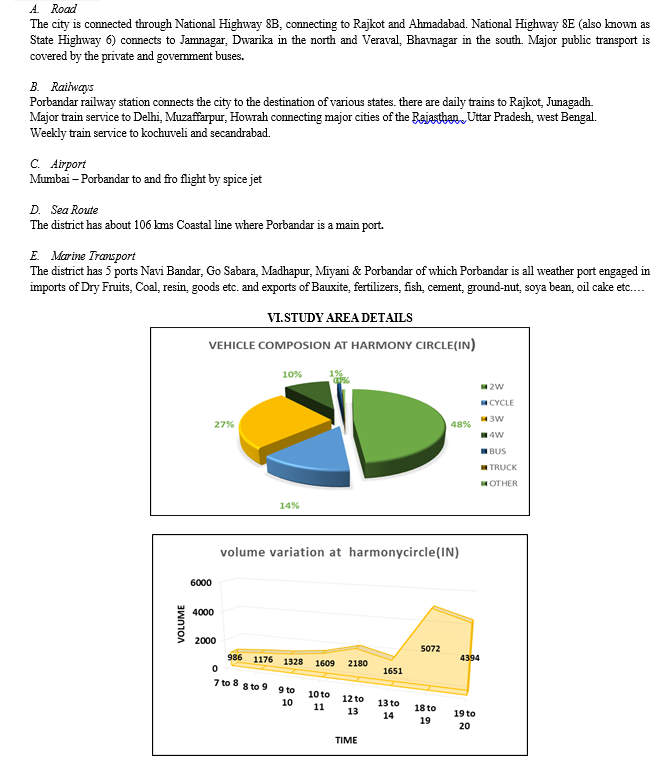
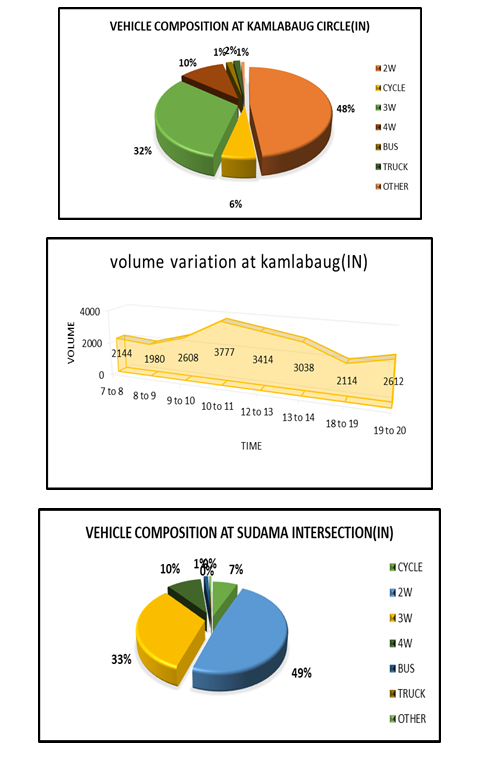
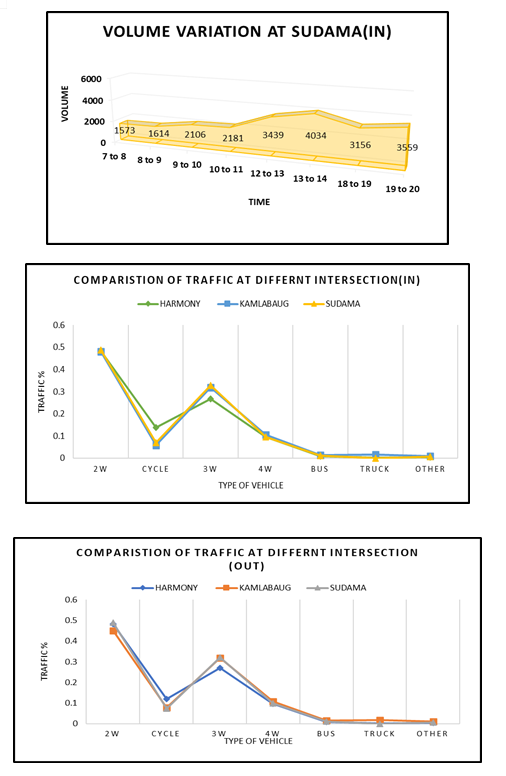
A. Harmony Intersection 1) Based on the traffic data collected at Harmony Circle, here are some conclusions 2) Two-wheelers (2W) constitute the majority of the traffic, accounting for 48.41% of the total. This indicates a significant reliance on motorcycles and scooters for commuting and transportation in the area. 3) Three-wheelers (3W) also have a considerable presence, contributing 26.80% of the total traffic. This suggests a reliance on auto-rickshaws or similar vehicles for short-distance travel. 4) Four-wheelers (4W) represent 9.51% of the total traffic, indicating the presence of cars and other personal vehicles. The contribution of buses, trucks, and other vehicles is minimal, collectively accounting for less than 1% of the total traffic. 5) Similar to Kamlabaug Circle, there are distinct peak periods during the morning and evening rush hours, with higher traffic volumes observed between 7:00 to 8:00 and 18:15 to 19:00. This pattern suggests that traffic at Harmony Circle is influenced by commuting patterns associated with typical work schedules. 6) The data does not explicitly mention cycles, but it\'s assumed they are included in the category \"CYCLE.\" However, their contribution seems relatively low compared to motorized vehicles. 7) The peak factor is calculated to be 0.92, indicating that during the peak hour, approximately 92% of the time the road is occupied by vehicles. This suggests high congestion levels and a significant demand for road space during peak traffic hours. 8) The V/C ratio is calculated to be 3.75, which is substantially higher than the ideal capacity of the road (1500 PCU for a two-lane arterial road according to IRC standards). A V/C ratio exceeding 1 indicates that the traffic volume exceeds the road\'s capacity, leading to congestion and potential traffic delays. 9) The high peak factor and V/C ratio suggest that the Harmony Intersection experiences severe congestion during peak hours, with traffic demand surpassing the road capacity. This congestion can result in traffic jams, delays, increased travel times, and decreased overall efficiency of the road network. 10) The findings highlight the need for infrastructure improvements and effective traffic management strategies to alleviate congestion and improve traffic flow at Harmony Intersection. Possible measures may include road expansion, lane addition, traffic signal optimization, implementation of traffic management systems, and promotion of alternative transportation modes. 11) The findings underscore the importance of integrating transportation planning with urban development initiatives to ensure sustainable and efficient mobility solutions. Future development projects should prioritize transportation infrastructure enhancements to accommodate growing traffic volumes and improve overall transportation efficiency in the area. 12) In conclusion, the findings emphasize the pressing need for proactive measures to address congestion and enhance traffic management at Harmony Intersection to improve the overall quality of transportation and mobility for commuters and residents. B. Sudama chock Intersection Here are some conclusions based on the traffic data collected at Sudama Intersection: 1) Two-wheelers (2W) dominate the traffic at the Sudama Intersection, comprising nearly half (48.74%) of the total vehicles observed. This suggests a high reliance on motorcycles and scooters for commuting and transportation in the area. 2) Three-wheelers (3W) also have a considerable presence, accounting for 32.88% of the total traffic. This indicates the reliance on auto-rickshaws or similar vehicles for short-distance travel and public transportation needs. 3) Four-wheelers (4W) represent 9.64% of the total traffic, indicating the presence of cars and other personal vehicles. Buses contribute 1.19%, suggesting public transportation services are available but not as widely used as two-wheelers and three-wheelers. 4) Trucks and other vehicles collectively contribute less than 1% to the total traffic volume. This indicates that the area may not be heavily industrialized, and commercial transportation activities are relatively low. 5) Similar to other intersections, there are distinct peak periods during the morning and evening rush hours, with higher traffic volumes observed between 7:00 to 8:00 and 18:15 to 19:00. This cyclic pattern suggests that traffic flow at Sudama Intersection is influenced by typical work schedules and commuting patterns. 6) The traffic flow follows a cyclic pattern throughout the day, with fluctuations corresponding to peak hours and changes in traffic density. 7) Given the significant presence of two-wheelers and three-wheelers, infrastructure planning should consider dedicated lanes or parking spaces for these types of vehicles. Additionally, measures to manage peak-hour congestion and improve traffic flow, such as signal optimization and road widening, may be necessary. 8) The peak hour factor is calculated to be 0.86, indicating that during the peak hour, approximately 86% of the time, the intersection is occupied by vehicles. This suggests a high level of congestion during peak hours, with the intersection experiencing significant traffic volumes for the majority of the time. 9) The V/C ratio is calculated to be 2.70, which is substantially higher than 1. A V/C ratio exceeding 1 indicates that the traffic volume far exceeds the capacity of the road, suggesting severe congestion and potential traffic backups at the intersection. 10) The high peak hour factor and V/C ratio indicate severe congestion at Sudama Intersection during peak hours. This level of congestion can lead to significant delays, longer travel times, and potential safety hazards for motorists and pedestrians. 11) The findings highlight the urgent need for infrastructure upgrades and improved traffic management strategies at Sudama Intersection. This could include measures such as optimizing signal timings, implementing traffic calming measures, expanding road capacity, or exploring alternative transportation solutions to alleviate congestion. 12) The data underscores the importance of integrating transportation planning with urban development initiatives in the area surrounding Sudama Intersection. This includes considering factors such as mixed land use planning, pedestrian-friendly infrastructure, and public transit options to reduce reliance on private vehicles and alleviate congestion. 13) In conclusion, the traffic data at Sudama Intersection indicates severe congestion during peak hours, with the intersection operating well beyond its capacity. Urgent measures are needed to address this congestion and improve traffic flow to ensure the safety and efficiency of the transportation network in the area. C. Kamalabaug Intersection 1) Based on the provided traffic volume survey data collected at Kamlabaug Circle, here are some conclusions: 2) The highest traffic volumes are observed during the morning rush hours between 7:00 to 9:00 and during the evening rush hours between 18:00 to 20:00. These periods see a significant influx of vehicles, especially two-wheelers, four-wheelers, and buses. 3) Two-wheelers (2W) and four-wheelers (4W) are the most dominant vehicle types throughout the day, comprising approximately 48.09% and 31.78% of the total traffic, respectively. Three-wheelers (3W) also contribute significantly, accounting for about 10.51% of the total traffic. 4) There\'s a noticeable cyclic pattern in the traffic flow, with peaks during the morning and evening rush hours and lower volumes during mid-day and late-night hours. This pattern suggests that traffic at Kamlabaug Circle is influenced by commuting patterns associated with typical work schedules. 5) The composition of traffic varies throughout the day. For instance, during peak hours, there\'s a higher proportion of buses and trucks compared to other times of the day, indicating the presence of public transportation and commercial traffic during those times. 6) Non-motorized traffic, such as cycles, also contributes a significant portion to the overall traffic flow, highlighting the importance of accommodating infrastructure for pedestrians and cyclists in the area. 7) The survey captures a wide range of vehicle types and provides a comprehensive understanding of traffic dynamics at Kamlabaug Circle. However, it\'s essential to consider factors such as seasonal variations, special events, and road construction activities, which may influence traffic patterns differently. 8) The peak factor is calculated to be 0.50, indicating that during the peak hour, approximately 50% of the time the road is occupied by vehicles. This suggests moderate congestion levels during the peak hour, with the road experiencing moderate to heavy traffic. 9) The V/C ratio is calculated to be 1.68, which is slightly higher than 1. A V/C ratio exceeding 1 indicates that the traffic volume approaches or slightly exceeds the road\'s capacity. While this suggests some congestion, it\'s not severe and generally manageable. 10) The moderate peak factor and V/C ratio suggest that Kamlabaug experiences moderate congestion during peak hours, with traffic demand approaching but not significantly surpassing the road capacity. This may result in some traffic delays and slower travel times but is likely not as severe as in heavily congested areas. 11) While the congestion levels are manageable, the findings still highlight the importance of continued monitoring and potential improvements to infrastructure and traffic management strategies. This could include measures such as optimizing traffic signal timings, implementing lane management strategies, and considering future road expansion or alternative transportation options to maintain efficient traffic flow as the area develops. 12) In conclusion, while Kamlabaug experiences moderate congestion during peak hours, the current traffic levels are manageable. However, continued monitoring and proactive measures will be essential to maintain efficient traffic flow and address any potential congestion challenges as the area develops further.
References
[1] Agyapong F, Kolawole F O, “Managing traffic congestion in the Accra Central Market, Ghana” Journal of urban management 2018. [2] Ahmed A, Sadullah A F, Yahiya A S,“Accident analysis using count data for signalized intersections in Malaysia” science direct- 2013. [3] Haleem K, Abdel M A,“Examining traffic crash injury severity at unsignalized intersections”2010 [4] Lal G, Divya L.G., Nithin K.J., Susan M, Bennet K, “Sustainable traffic improvement for urban road intersections of developing countries: A case study of Ettumanoor, India” RAEREST 2016 [5] Mahajan S K, Umadekar A, Jethwa K, “New concept of traffic rotary design at road intersection” CICTP 2013 [6] Marfani S, Shihora D, Kanthariya C, Kansara H, “Traffic Improvement for Urban Road Intersection, Surat” IRJET 2012 [7] Mail D M, Umrigar N F, “Study of congestion of the road traffic at railway crossings” IARJSET – 2017 [8] Matsuoka S, “Traffic management project in Phnom Penh” IATSS Research japan 2018 [9] Prasetijio J, Pour M H, “Capacity of unsignalized intersections under mixed traffic conditions”science direct -2011 [10] Prasetijio J, Ahmad H“Capacity analysis of unsignalized intersection under mixed traffic conditions”science direct-2012 [11] Thanh T M, Friedrich H, “Legalizing the illegal parking, a solution for parking scarcity in developing countries” WCTR Shanghai 2016 [12] Virani H A,Zala L B,Umrigar N F “Pre-Feasibility Study: Traffic Improvement at Intersections in Rajkot City” IJSRD 2015
Copyright
Copyright © 2024 Niralee Lakhana , Shekhar Parmar. This is an open access article distributed under the Creative Commons Attribution License, which permits unrestricted use, distribution, and reproduction in any medium, provided the original work is properly cited.

Download Paper
Paper Id : IJRASET62406
Publish Date : 2024-05-20
ISSN : 2321-9653
Publisher Name : IJRASET
DOI Link : Click Here
 Submit Paper Online

