

Ijraset Journal For Research in Applied Science and Engineering Technology
Behavioural Similarity between Marshall Stability and Indirect Tensile Strength Values for DBM Grade-2 using VG-30, VG-40 and CRMB-55 Grade Binder with RAP
Authors: Er. Madanjee Kumar, Er. Ajay Kumar Duggal
DOI Link: https://doi.org/10.22214/ijraset.2025.66828
Certificate: View Certificate
Abstract
This research investigates the similarities between Marshall Stability and Indirect Tensile Strength (ITS) values for Dense Bituminous Macadam (DBM) Grade 2 mixes using VG-30, VG-40, and CRMB-55 grade binders, incorporating varying proportions of Recycled Asphalt Pavement (RAP). Virgin and modified mixes were prepared with RAP content ranging from 25% to 35% and bitumen content from 4.5% to 4.95 % .Marshall properties which includes stability, air voids, density, voids in mineral aggregate (VMA), and flow values were determined to establish optimal binder and RAP proportions for durable and sustainable pavements. For virgin mixes, VG-30,VG-40 and CRMB-55 grade binders exhibited optimal performance at 4.65% bitumen, achieving maximum stability values of 12.83 kN ,14.69 kN and 14.95kN respectively. Modified mixes with 25% RAP showed peak stability values of 14.40 kN, 14.90 kN, and 14.69 kN for VG-30, VG-40, and CRMB-55 binders, respectively, at optimal bitumen contents. Air voids minimized to below 4.34%, ensuring compactness, while flow values remained within permissible limits. At 30% RAP, VG-40 and CRMB-55 binders delivered superior performance with stability values of 15.24 kN and 15.29 kN, respectively. For mix with 35% RAP, VG-40 achieved maximum stability of 14.94 kN, while CRMB-55 demonstrated balanced results with a stability of 14.35 kN and optimal deformation resistance. Across all mixes, air voids reduced significantly, and densities remained consistent, ensuring structural integrity. The results demonstrate that incorporating RAP improves mix performance while promoting sustainability. VG-40 and CRMB-55 binders consistently outperformed VG-30, particularly at higher RAP contents, suggesting their suitability for durable and resilient pavement construction. This study provides a comprehensive understanding of the relationship between Marshall Stability and ITS values in DBM Grade 2 mixes, facilitating informed material selection for sustainable infrastructure. ITS follows the same trend as Marshall Stability, with CRMB-55 showing the highest values at 4.65% binder content (0.83 N/mm², 14.95 kN), followed by VG-40 and VG-30 for conventional Mix. For 25% RAP, VG-40 had the highest stability (14.90 kN), while CRMB-55 had the highest ITS (0.87 N/mm²). With 30% RAP, CRMB-55 exhibited superior stability (15.29 kN) and ITS (0.87 N/mm²). At 35% RAP, VG-40 had the highest stability (14.94 kN), while CRMB-55 led in ITS (0.85 N/mm²).
Introduction
I. INTRODUCTION
Dense Bituminous Macadam (DBM) is a high-quality road construction material widely used in flexible pavements for highways and other heavily trafficked areas. As a crucial intermediate layer in pavement design, DBM provides structural strength, durability, and resistance to deformation under repeated traffic loads. Its formulation typically includes coarse aggregates, fine aggregates, filler, and a bituminous binder, carefully proportioned to achieve optimal performance.
The increasing demand for durable and cost-effective road infrastructure has led to significant advancements in DBM composition, production, and application methods. DBM plays a vital role in ensuring long-lasting pavement life by withstanding environmental stresses, including temperature variations and moisture infiltration. Moreover, its ability to distribute vehicular loads uniformly to the underlying layers minimizes pavement distress and enhances overall performance.
This Research paper explores various aspects of Dense Bituminous Macadam to show behavioral similarities between Marshall stability which is design parameter and ITS value which show the ability of mix to resist tensile force. The study also investigates the impact of innovative additives, modified binders, and sustainable practices on DBM's durability. By addressing these factors, this research aims to contribute to the development of more reliable and sustainable road construction techniques.
II. NEED AND SCOPE OF STUDY
A. Need For Study
Road transportation plays a vital role in meeting growing transportation demands, requiring both new road construction and improvements to existing infrastructure. While various agents and filler materials have been examined for Marshall Stability and Indirect Tensile Strength (ITS), no comparative research has been conducted. The Marshall Stability Test involves compressive loading, while the ITS test uses indirect tensile loading. Understanding any impact of ITS on Marshall Stability is crucial. This study aims to explore behavioural similarities between Marshall Stability and ITS values for DBM Grade-2 mixes using different grades of bitumen, CRMB-55, and recycled materials, highlighting the applicability of the ITS test for bituminous mixes.
B. Scope And Objectives Of Present Study
This research assess the functionality and characteristics of bituminous mixes through Marshall Stability and ITS tests. The study evaluates the engineering properties of DBM by analysing both tests on the same specimen samples.
This research has the potential to contribute to the development of environmentally friendly road construction practices, addressing issues like binder drainage and tensile strength in recycled material-based DBM. The findings can guide the industry toward more sustainable and durable asphalt solutions.
The main objectives of the present study are:
- To determine the optimum binder content by Marshall method for control mix for DBM prepared with and without RAP using VG-30, VG-40 and CRMB-55 Grade Binder
- To determine I.T.S. value of DBM mix at various binder content with and without RAP and ascertain if any similarity exist between Marshall stability and I.T.S Value using VG-30, VG-40 and CRMB-55 Binder.
- To determine the optimum amount of RAP that can be added in DBM mix.
- To determine the effect of employing RAP in DBM on the Marshall Stability Value and I.T.S. value.
III. MATERIAL PROPERTIES EVALUATION
A. Aggregates
Aggregates of size 26.5 mm, 19 mm, and 10 mm ,stone dust and RAP were used . The material used satisfied all general requirement as per MORT&H (5th revision) and IRC: SP: 79-2023. The aggregates were collected from the nearby road construction site. The tests which have been done on aggregates are displayed in
Table 1: Physical Properties of Coarse and Fine Aggregates including RAP
|
Physical properties |
26.5mm |
19mm |
RAP |
Required values as per MORTH 5th revision |
|
Specific Gravity |
2.62 |
2.64 |
2.69 |
2.6-2.8 |
|
Elongation index (%) |
11.1 |
10.7 |
10.4 |
Max 30% (E.I. + F.I.) |
|
Flakiness index (%) |
9.2 |
10.4 |
9.0 |
|
|
Impact value (%) |
20.5 |
21.0 |
20.3 |
Max 24% |
|
Water absorption (%) |
0.40 |
0.50 |
0.54 |
Max 2% |
|
Stripping value (%) |
2-3 |
2-3 |
2-3 |
< 5% |
B. Binder
In this research, VG-30, VG-40 & CRMB-55 is used. To determine the physical characteristics of bitumen, different tests are performed in accordance with IS: 73-2013 & IS 15462:2004 shown in Table 2.
Table 2: Properties of Viscous Grade Bitumen
|
Properties |
VG-30 Grade |
VG-40 Grade |
Test Method |
||
|
|
Determined |
Required |
Determined |
Required |
|
|
Penetration |
62 |
50-70 |
53 |
40-60 |
IS:1203:1978 |
|
Softening point |
51°C |
47°C min. |
56°C |
50°C min. |
IS:1205:1978 |
|
Ductility |
44 |
40 (min.) |
35 |
25 (min.) |
IS:1208:1978 |
|
Specific Gravity |
1 |
0.99 (min.) |
1 |
0.99 (min.) |
IS:1202:1978 |
Table 3: Physical properties of CRMB-55
|
Test Particulars |
Determined |
Required |
Test Method |
|
Penetration at 25oC,100g,5 seconds,0.1mm |
55 |
< 60 |
IS 15462:2004 |
|
Softening Point (Ring & Ball),oC |
59 |
Min 55 |
IS 15462:2004 |
|
Flash Point, oC |
233 |
Min 220 |
IS 15462:2004 |
|
Separation, Difference in softening point, R&B oC, Max |
3.2 |
Max 4 |
IS 15462:2004 |
|
Viscosity at 150 oC ,Poise |
4.35 |
2-6 |
IS 15462:2004 |
C. Mineral Filler
Stone dust has been used as the mineral filler in the DBM mix, with the replacement for hydrated lime . It was procured from nearby site in Chandigarh.
IV. EXPERIMENTAL INVESTIGATIONS
A. Aggregate Gradation
To achieve the right blend, different sized aggregates such as 26.5mm,19mm,10mm and filler, are employed. Aggregates weighing 4000g were collected for sieve analysis. To find the specific percentages of different sized aggregates to be employed, the aggregate gradation is carried out using Rothfuch's Method, which confirms to the upper and lower limitations stated as per MoRTH table 500-07.
Table 4 shows grading of aggregate for controlled mix and mix with varying percentage of RAP.
Table 4:Grading of aggregate for DBM
|
IS Sieve Size |
% passing 26.5mm |
% passing 19mm |
% passing 10mm |
% passing SD |
% passing RAP |
Grading of Mix |
|
|||
|
Control Mix |
Mix with 25% RAP |
Mix with 30% RAP |
Mix with 35% RAP |
% passing required |
||||||
|
37.5 |
100 |
100 |
100 |
100 |
100 |
100 |
100 |
100 |
100 |
100 |
|
26.5 |
89.8 |
100 |
100 |
100 |
100 |
98.9 |
97.9 |
98.3 |
98.2 |
90-100 |
|
19.0 |
2 |
91.5 |
100 |
100 |
95.1 |
88.2 |
77.7 |
78.6 |
80.4 |
71-95 |
|
13.2 |
0 |
3.2 |
97.8 |
100 |
89.3 |
67.1 |
61.4 |
62.9 |
65.4 |
56-80 |
|
4.75 |
0 |
0 |
16.3 |
98.2 |
65.8 |
41.2 |
40.8 |
42.8 |
44.9 |
38-54 |
|
2.36 |
0 |
0 |
2.4 |
87.2 |
41.1 |
32.9 |
29.8 |
30.9 |
32.1 |
28-42 |
|
300 |
0 |
0 |
0.4 |
38.8 |
0.9 |
14.4 |
9.7 |
9.6 |
9.4 |
7-21 |
|
75 |
0 |
0 |
0.2 |
15 |
2.67 |
5.6 |
3.5 |
3.4 |
3.3 |
2-8 |
B. DBM MIX Design
The mix design was carried out using the Marshall Stability Test to determine the optimum binder content, RAP replacement percentage, ensuring maximum stability values. The design also adhered to other Marshall parameters. The mix was designed to meet the specifications outlined in MoRTH Table 500-11: DBM Mix Requirements.
The samples are prepared in accordance with ASTM D6926: Standard Practice for Preparation of DBM Specimens Using Marshall Apparatus. 75 blows are required on each face of the specimen for DBM mixes. Table 5 shows the proportion of 26.5mm, 19mm, 10mm, Filler and RAP for different DBM mix..
Table 5: Proportion of 26.5mm, 19mm, 10mm, Filler and RAP for different DBM mix.
|
Size of Aggregate |
Ratio of Mixing of aggregate in percent |
|||
|
Control Mix |
Mix with 25% RAP |
Mix with 30% RAP |
Mix with 35% RAP |
|
|
26.5mm |
10 |
20 |
19 |
17 |
|
19mm |
23 |
16 |
15 |
14 |
|
10 mm |
30 |
17 |
15 |
14 |
|
Filler |
37 |
22 |
21 |
20 |
|
RAP |
? |
25 |
30 |
35 |
C. Conventional DBM Mix
The Marshall Stability test was carried out in the lab to determine the ideal binder content and stability for conventional DBM mix. Samples were prepared with minimum bitumen of 4.50% and subsequently with an increment of 0.15% and going up to 4.95%.for viscous binder VG-30, VG-40 and Modified Binder CRMB-55.Table 6 displays the Marshall Properties for Conventional DBM Mix with different binder content. Figure 1,Figure 1, Figure 3, Figure 4 and Figure 5 display the variation of various Marshall Parameters i.e., Marshall stability, density, flow value, Voids in Minerals aggregate (VMA) and air void content vs Bitumen Content. Based on experimental data the ideal bitumen concentration for a Conventional DBM mix was determined to be 4.65% for Virgin binder as well as for modified binder.
Table 6: Marshall Properties for Conventional DBM Mix with different Binder Content
|
|
VG-30 |
VG-40 |
CRMB-55 |
|||||||||
|
Bitumen (%) |
4.50 |
4.65 |
4.8 |
4.95 |
4.50 |
4.65 |
4.8 |
4.95 |
4.50 |
4.65 |
4.8 |
4.95 |
|
Gt (g/cc) |
2.35 |
2.36 |
2.35 |
2.36 |
2.32 |
2.33 |
2.33 |
2.33 |
2.34 |
2.35 |
2.35 |
2.35 |
|
Gm (g/cc) |
2.63 |
2.63 |
2.63 |
2.63 |
2.63 |
2.63 |
2.63 |
2.63 |
2.63 |
2.63 |
2.63 |
2.63 |
|
Vb (%) |
10.57 |
10.96 |
11.29 |
11.66 |
10.46 |
10.85 |
11.19 |
11.54 |
10.53 |
10.92 |
11.27 |
11.61 |
|
Va (%) |
85.32 |
85.41 |
85.14 |
85.14 |
84.37 |
84.57 |
84.39 |
84.28 |
84.93 |
85.16 |
85.00 |
84.78 |
|
VMA (%) |
14.68 |
14.59 |
14.86 |
14.86 |
15.63 |
15.43 |
15.61 |
15.72 |
15.07 |
14.84 |
15.00 |
15.22 |
|
Vv (%) |
4.11 |
3.63 |
3.57 |
3.20 |
5.18 |
4.58 |
4.41 |
4.17 |
4.54 |
3.91 |
3.73 |
3.61 |
|
VFB% |
72.02 |
75.11 |
75.97 |
78.48 |
66.87 |
70.31 |
71.71 |
73.45 |
69.86 |
73.63 |
75.15 |
76.29 |
|
Stability value (kN) |
12.04 |
12.83 |
12.53 |
11.80 |
13.03 |
14.69 |
13.48 |
11.94 |
13.82 |
14.95 |
14.20 |
12.53 |
|
Flow Value (mm) |
3.18 |
3.21 |
3.29 |
3.9 |
3.42 |
3.72 |
3.95 |
4.15 |
3.32 |
3.54 |
3.67 |
4.1 |
|
ITS Value (N/mm²) |
0.68 |
0.70 |
0.74 |
0.69 |
0.69 |
0.80 |
0.79 |
0.73 |
0.69 |
0.83 |
0.81 |
0.71 |
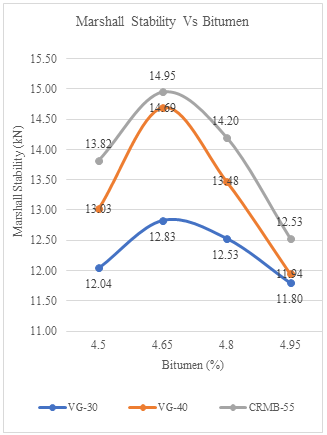
Figure 1 : Marshall stability vs bitumen for Control Mix
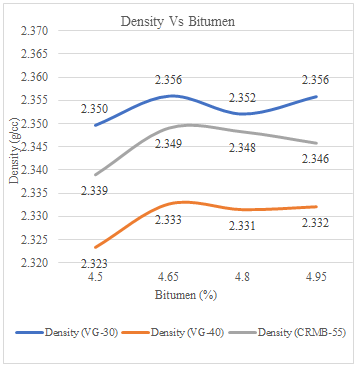
Figure 2 : Density vs bitumen for Control Mix
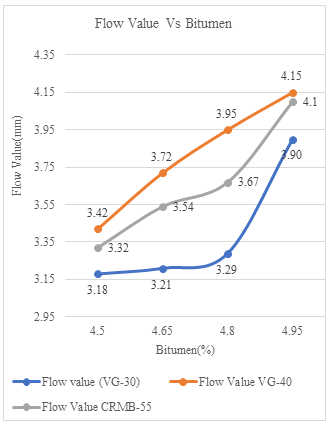
Figure 3 : Flow value vs bitumen for control mix
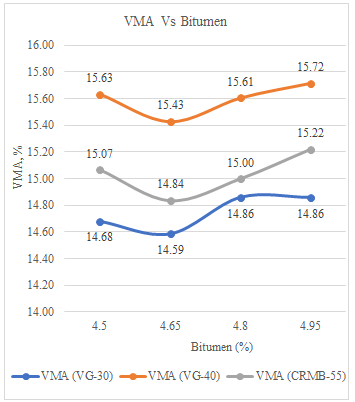
Figure 4: VMA vs bitumen for control mix
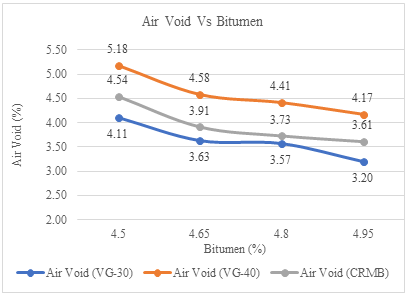
Figure 5: Air void vs bitumen for control mix
2) DBM Mix with different proportion of RAP
The incorporation of Reclaimed Asphalt Pavement (RAP) into DBM mixes was evaluated based on Marshall properties. RAP dosage levels were varied across 25%, 30%, and 35%. The range of bitumen content was taken 4.50%,4.65% and 4.80 % which is one below and one above the Optimum Binder Content obtained from Conventional Mix. The gradation corresponding to these RAP percentages was as previously discussed in
Table 4.Experimental investigations revealed that the Conventional mixes with VG-30 ,VG-40 and CRMB-55 achieved maximum stability at 4.65% bitumen content, with values of 12.83 kN ,14.69 kN,and 14.95 kN respectively. Modified mixes with 25% RAP ,VG-40 and CRMB-55 binders showed stability values of 14.90 kN and 14.69 kN. At 30% RAP, VG-40 and CRMB-55 outperformed VG-30, achieving 15.24 kN and 15.29 kN, respectively. At 35% RAP, stability for VG-40 reduced to (14.94 kN), while for CRMB-55 reduced to (14.35 kN) The results of these assessments are summarized in Table 7,Table 8 and Table 9 respectively and the corresponding graphical representations are illustrated in Figure 6 to Figure 20 for Marshall Stability ,Density, Flow Value, VMA and Air Void with respect to Bitumen.
Table 7: Marshall properties of DBM mix with 25% ,30% and 35% RAP at 4.50%,4.65% and 4.80% for VG-30
|
VG-30 grade bitumen with 25% RAP |
VG-30 grade bitumen with 30% RAP |
VG-30 grade bitumen with 35% RAP |
|||||||
|
Bitumen(%) |
4.50 |
4.65 |
4.80 |
4.50 |
4.65 |
4.80 |
4.50 |
4.65 |
4.80 |
|
Gt (g/cc) |
2.35 |
2.35 |
2.34 |
2.35 |
2.35 |
2.35 |
2.36 |
2.36 |
2.36 |
|
Gm (g/cc) |
2.64 |
2.64 |
2.64 |
2.64 |
2.64 |
2.64 |
2.64 |
2.64 |
2.64 |
|
Vb (%) |
10.57 |
10.91 |
11.24 |
10.91 |
11.28 |
11.62 |
10.99 |
11.34 |
11.68 |
|
Va |
84.95 |
84.75 |
84.41 |
84.77 |
84.73 |
84.50 |
85.34 |
85.16 |
84.98 |
|
VMA (%) |
15.05 |
15.25 |
15.59 |
15.23 |
15.27 |
15.50 |
14.66 |
14.84 |
15.02 |
|
Vv (%) |
4.48 |
4.34 |
4.35 |
4.32 |
4.00 |
3.88 |
3.67 |
3.50 |
3.34 |
|
VFB% |
70.23 |
71.54 |
72.07 |
71.67 |
73.83 |
74.96 |
74.97 |
76.39 |
77.77 |
|
Stability value (kN) |
14.40 |
13.81 |
11.80 |
12.53 |
12.83 |
11.80 |
13.06 |
12.78 |
12.04 |
|
Flow Value (mm) |
3.42 |
3.57 |
3.84 |
3.17 |
3.41 |
3.73 |
3.34 |
3.72 |
4.05 |
|
ITS Value (N/mm²) |
0.80 |
0.79 |
0.77 |
0.70 |
0.74 |
0.69 |
0.74 |
0.78 |
0.76 |
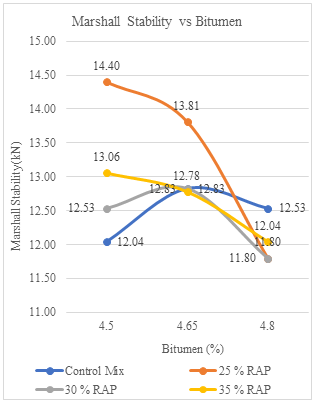
Figure 6: Marshall stability vs bitumen for VG-30
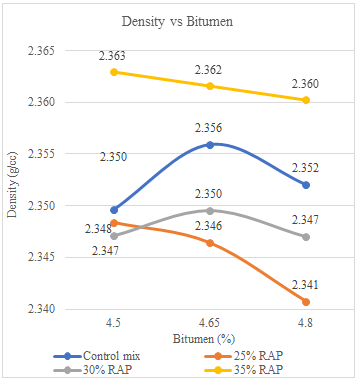
Figure 7: Density vs bitumen for VG-40
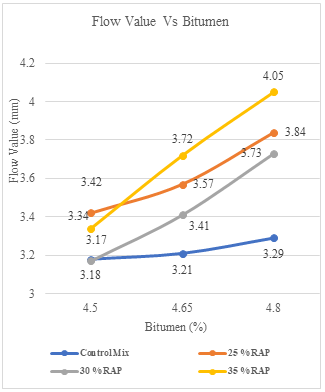
Figure 8: Flow value vs bitumen for VG-30
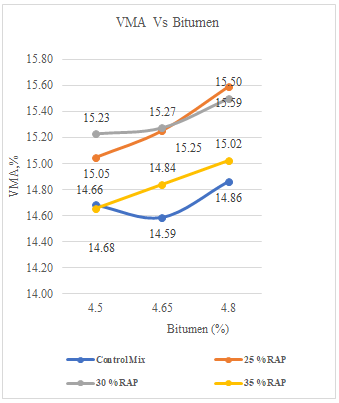
Figure 9: VMA vs bitumen for VG-30
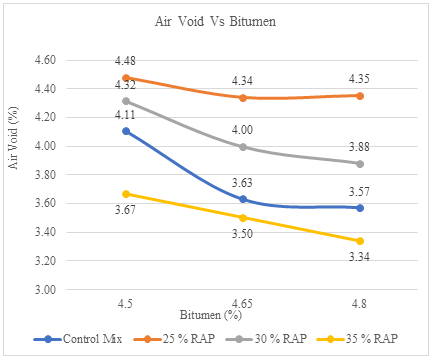
Figure 10: Air void vs bitumen for VG-30
Table 8: Marshall properties of DBM mix with 25% ,30% and 35% RAP at 4.50%,4.65% and 4.80% for VG-40
|
VG-40 grade bitumen with 25 % RAP |
VG-40 grade bitumen with 30% RAP |
VG-40 grade bitumen with 30% RAP |
|||||||
|
Bitumen(%) |
4.50 |
4.65 |
4.80 |
4.50 |
4.65 |
4.80 |
4.50 |
4.65 |
4.80 |
|
Gt (g/cc) |
2.36 |
2.37 |
2.36 |
2.34 |
2.35 |
2.33 |
2.36 |
2.36 |
2.36 |
|
Gm (g/cc) |
2.64 |
2.64 |
2.64 |
2.64 |
2.64 |
2.64 |
2.64 |
2.64 |
2.64 |
|
Vb (%) |
10.60 |
11.01 |
11.34 |
10.53 |
10.91 |
11.20 |
10.99 |
11.34 |
11.68 |
|
Va (%) |
85.23 |
85.54 |
85.18 |
84.66 |
84.70 |
84.14 |
85.34 |
85.16 |
84.98 |
|
VMA (%) |
14.77 |
14.46 |
14.82 |
15.34 |
15.30 |
15.86 |
14.66 |
14.84 |
15.02 |
|
Vv (%) |
4.17 |
3.45 |
3.48 |
4.81 |
4.39 |
4.66 |
3.67 |
3.50 |
3.34 |
|
VFB% |
71.78 |
76.15 |
76.50 |
68.63 |
71.29 |
70.62 |
74.97 |
76.39 |
77.77 |
|
Stability value (kN) |
13.82 |
14.90 |
13.71 |
15.10 |
15.24 |
14.01 |
13.06 |
12.78 |
12.04 |
|
Flow Value (mm) |
3.54 |
3.67 |
3.75 |
3.71 |
3.86 |
4.10 |
3.34 |
3.72 |
4.05 |
|
ITS Value (N/mm²) |
0.80 |
0.86 |
0.82 |
0.80 |
0.85 |
0.83 |
0.74 |
0.78 |
0.76 |
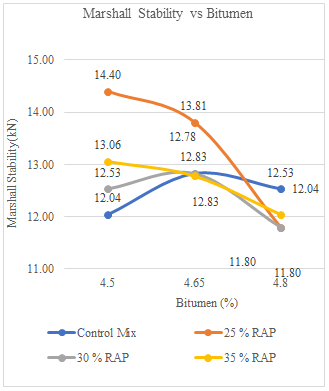
Figure 11: : Marshall stability vs bitumen for VG-40
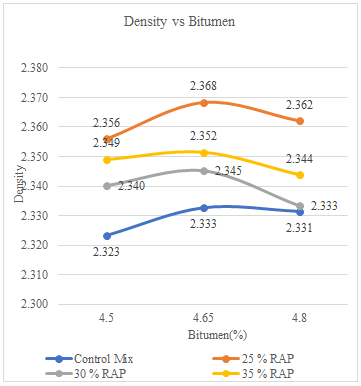
Figure 12: Density vs bitumen for VG-40
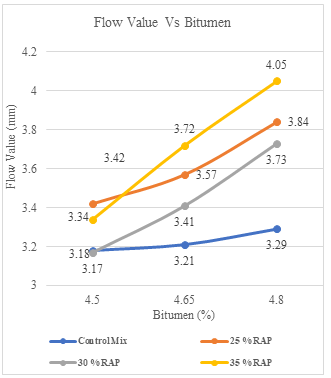
Figure 13: Flow value vs bitumen for VG-40
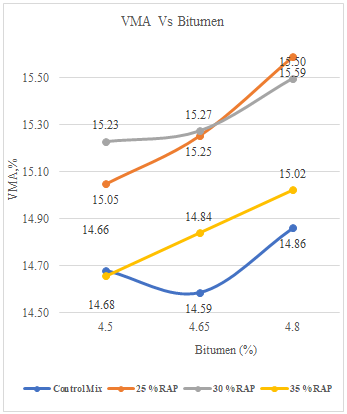
Figure 14: VMA vs bitumen for VG-40
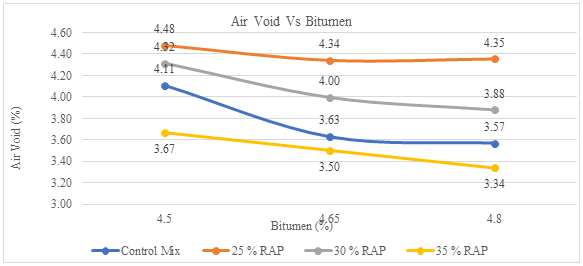
Figure 15: Air void vs bitumen for VG-40
Table 9: Marshall properties of DBM mix with 25% ,30% and 35% RAP at 4.50%,4.65% and 4.80% for CRMB-55
|
CRMB-55 grade bitumen with 25% RAP |
CRMB-55 grade bitumen with 30% RAP |
CRMB-55 grade bitumen with 35% RAP |
|||||||
|
Bitumen(%) |
4.50 |
4.65 |
4.80 |
4.50 |
4.65 |
4.80 |
4.50 |
4.65 |
4.80 |
|
Gt (g/cc) |
2.34 |
2.34 |
2.34 |
2.34 |
2.34 |
2.34 |
2.36 |
2.35 |
2.35 |
|
Gm (g/cc) |
2.64 |
2.64 |
2.64 |
2.64 |
2.64 |
2.64 |
2.64 |
2.64 |
2.64 |
|
Vb (%) |
10.55 |
10.90 |
11.25 |
10.51 |
10.87 |
11.23 |
10.60 |
10.94 |
11.27 |
|
Va (%) |
84.79 |
84.66 |
84.54 |
84.52 |
84.45 |
84.36 |
85.25 |
85.00 |
84.70 |
|
VMA (%) |
15.21 |
15.34 |
15.46 |
15.48 |
15.55 |
15.64 |
14.75 |
15.00 |
15.30 |
|
Vv (%) |
4.66 |
4.44 |
4.20 |
4.97 |
4.67 |
4.41 |
4.15 |
4.06 |
4.02 |
|
VFB% |
69.37 |
71.04 |
72.81 |
67.92 |
69.94 |
71.82 |
71.89 |
72.95 |
73.70 |
|
Stability value (kN) |
14.69 |
14.65 |
13.27 |
14.65 |
15.29 |
14.01 |
13.66 |
14.35 |
13.81 |
|
Flow Value (mm) |
3.16 |
3.63 |
3.83 |
3.23 |
3.29 |
3.62 |
3.44 |
3.55 |
3.71 |
|
ITS Value (N/mm²) |
0.81 |
0.87 |
0.82 |
0.81 |
0.87 |
0.83 |
0.79 |
0.85 |
0.81 |
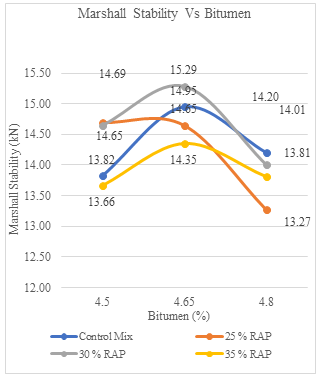
Figure 16: : Marshall stability vs bitumen for CRMB-55
Figure 17: Density vs bitumen for CRMB-55
Figure 18: Flow value vs bitumen for CRMB-55
Figure 19: VMA vs bitumen for CRMB
Figure 20: Air void vs bitumen for CRMB-55
V. RESULTS AND DISCUSSION
A. Test Result For Control Mix
- VG-30: The mix showed optimal performance at 4.65% bitumen content with a stability of 12.83 kN, density of 2.36 g/cc, and air voids reduced to 3.20%. The lowest flow value of 3.18 mm was observed, ensuring durability, stability, and deformation resistance.
- VG-40: The DBM Grade 2 mix achieved peak performance at 4.65% bitumen content, with a stability of 14.69 kN, density of 2.33 g/cc, and air voids of 4.17%. The flow value was minimized to 3.42 mm, highlighting durability and resistance to deformation.
- CRMB-55: Maximum performance was observed at 4.65% bitumen, achieving stability of 14.95 kN, density of 2.34 g/cc, air voids of 3.61 %, and a flow value of 3.32 mm, ensuring durability and strength.
- ITS: ITS follows the Marshall Stability trend, with CRMB-55 showing the highest ITS (0.83 N/mm²), followed by VG-40 (0.80 N/mm²) and VG-30 (0.70 N/mm²) at 4.65% binder.
B. Test Result For Modified Mix Using 25 % Rap
- VG-30: The mix exhibited optimal performance with a stability of 14.40 kN, density of 2.35 g/cc, air voids of 4.34%, and a flow value of 3.42 mm at 4.5% bitumen content.
- VG-40: The mix achieved peak performance at 4.65% bitumen content, with stability of 14.90 kN, density of 2.37 g/cc, air voids of 3.45%, and a flow value of 3.54 mm.
- CRMB-55: Strong performance was observed at 4.5% bitumen, achieving stability of 14.69 kN, density of 2.34 g/cc, air voids of 4.20%, and a flow value of 3.16 mm.
- ITS: ITS values were highest for CRMB-55 (0.87 N/mm²), followed by VG-40 (0.86 N/mm²) and VG-30 (0.80 N/mm²) at 4.65% for CRMB-55 and VG-40 and at 4.50% for VG-30 binder
C. Test Result For Modified Dbm Mix Using 30% Rap
- VG-30: At 4.8% bitumen content, the mix demonstrated stability of 12.83 kN, density of 2.35 g/cc, air voids of 3.88%, and a flow value of 3.17 mm.
- VG-40: Optimal results were achieved at 4.65% bitumen content, with stability of 15.24 kN, density of 2.345 g/cc, air voids of 4.39%, and a flow value of 3.71 mm.
- CRMB-55: The mix achieved excellent performance at 4.65% bitumen content, with stability of 15.29 kN, density of 2.34 g/cc, air voids of 4.41%, and a flow value of 3.23 mm.
- ITS: ITS values were also highest for CRMB-55 (0.87 N/mm²), followed by VG-40 (0.85 N/mm²) and VG-30 (0.74 N/mm²), all at 4.65% binder.
D. Test Result For Modified Dbm Using 35% Rap
- VG-30: The mix displayed robust performance at 4.65% bitumen content, with stability of 13.06 kN, density of 2.36 g/cc, air voids of 3.34%, and a flow value of 3.34 mm.
- VG-40: At 4.65% bitumen content, the mix achieved stability of 14.94 kN, density of 2.35 g/cc, air voids of 4.14%, and a flow value of 2.8 mm, showcasing superior mechanical performance.
- CRMB-55: The mix indicated strong performance at 4.65% bitumen content, with stability of 14.35 kN, density of 2.357 g/cc, air voids of 4.02%, and a flow value of 3.44 mm.
- ITS: ITS values were highest for CRMB-55 (0.85 N/mm²), followed by VG-40 (0.81 N/mm²) and VG-30 (0.78 N/mm²) at 4.65% binder
Conclusion
The study revealed notable differences and improvements in performance between various binders (VG-30, VG-40, and CRMB-55) and RAP proportions (25%, 30%, and 35%). For virgin mixes, CRMB-55 demonstrated superior performance with a maximum stability of 14.95 kN at 4.65% bitumen content, representing a 16.5% improvement over VG-30, which achieved 12.83 kN. At 25% RAP, VG-40 and CRMB-55 exhibited similar stability values of 14.90 kN and 14.69 kN, respectively, with VG-40 showing a slight improvement of 1.4% over CRMB-55. At 30% RAP, CRMB-55 marginally outperformed VG-40 with stability values of 15.29 kN and 15.24 kN, respectively, indicating a negligible variation of 0.3%. Both binders significantly outperformed VG-30, which exhibited an estimated stability of around 14.5 kN, translating to an improvement of 5% or more for the other two binders. At 35% RAP, VG-40 achieved the highest stability value of 14.94 kN, outperforming CRMB-55 by 4.1%, which provided a stability value of 14.35 kN. Although CRMB-55 showed slightly lower stability at this level, it demonstrated superior deformation resistance, making it a balanced choice for mixes with higher RAP content. The findings indicate that stability generally improves with increasing RAP content up to 30%, while a slight decrease is observed at 35%. VG-40 consistently outperformed VG-30 across all RAP levels, while CRMB-55 provided competitive stability and additional deformation resistance, especially at higher RAP proportions. Overall, incorporating RAP up to 35% is feasible and sustainable without compromising pavement performance, provided appropriate binders like VG-40 or CRMB-55 are used. This study examines the impact of binder type and RAP content on the mechanical properties of DBM Grade 2 mixes. ITS follows the same trend as Marshall Stability, with CRMB-55 showing the highest values at 4.65% binder content (0.83 N/mm², 14.95 kN), followed by VG-40 and VG-30. For 25% RAP, VG-40 had the highest stability (14.90 kN), while CRMB-55 had the highest ITS (0.87 N/mm²). With 30% RAP, CRMB-55 exhibited superior stability (15.29 kN) and ITS (0.87 N/mm²). At 35% RAP, VG-40 had the highest stability (14.94 kN), while CRMB-55 led in ITS (0.85 N/mm²). These results highlight CRMB-55’s strength and VG-40’s stability, emphasizing their influence on sustainable pavement design
References
[1] Huang B., Shu X. & Tang Y., “Comparison of semi-circular bending and indirect tensile strength tests for HMA mixtures”, Advances in Engineering, pp. 1-12, 2005. [2] Chen X. & Huang B., “Evaluation of moisture damage in hot mix asphalt using simple performance and Super pave indirect tensile tests”, Construction and Building Materials, 22(9), pp.1950-1962, 2008. [3] Anurag K., Xiao F. & Amirkhanian S. N., “Laboratory investigation of indirect tensile strength using roofing polyester waste fibers in hot mix asphalt”, Construction and Building Materials, 23(5), 2035–2040, 2009. [4] Gandhi T., Xiao F. & Amirkhanian S.N., “Estimating indirect tensile strength of mixtures containing anti-stripping agents using an artificial neural network approach”, International Journal of Pavement Research and Technology, 2(1), pp.1., 2009. [5] N. Erarslan & D.J. Williams, “Investigating the effect of cyclic loading on the indirect tensile strength of rocks”, Springer, (45), pp. 327-340, 2011. [6] Al-Baiti, H.K.A., “Evaluation and Study the Effect of Additives and Other Factors on Tensile Strength of Asphalt Paving Mixtures”, Tikrit J. Eng. Sci, 19(1), pp.80-96, 2012. [7] Navarro F. M., & Gámez M. C. R., “Influence of Crumb Rubber on the Indirect Tensile Strength and Stiffness Modulus of Hot Bituminous Mixes”, Journal of Materials in Civil Engineering, 24(6), pp.715–724, 2012. [8] Shunyashree, T., Archana, M.R. & Amarnath, M.S., “Effect of use of recycled materials on indirect tensile strength of asphalt concrete mixes”, In IC-RICE Conference, pp. 226-232, 2013. [9] Katman H.Y., Ibrahim M.R., Matori M.Y., Norhisham S. & Ismail N., “Effects of reclaimed asphalt pavement on indirect tensile strength test of foamed asphalt mix tested in dry condition”, In IOP Conference Series: Earth and Environmental Science, Vol. 16, No. 1, p. 012091), 2013. [10] Chandra S. & Choudhary R., “Performance Characteristics of Bituminous Concrete with Industrial Wastes as Filler”, Journal of Materials in Civil Engineering, 25(11), pp. 1666-1673, 2013. [11] Islam M.R., Hossain M.I. & Tarefder R.A., “A study of asphalt aging using Indirect Tensile Strength Test” Construction and Building Materials, 95, pp.218-223, 2015. [12] Peng, Y., Wan, L. and Sun, L.J., “Three-dimensional discrete element modelling of influence factors of indirect tensile strength of asphalt mixtures”, International Journal of Pavement Engineering, 20(6), pp.724-733, 2019.51 [13] Gupta A. & Agarwal S. (2017) “Comparative Stability Analysis of Harder Grade Bitumen (VG-30 & VG-40) By Marshall Mix Design Method on DBM-I”, International Journal of Engineering Development and Research, 5(3), pp. 986-990, 2017. [14] Bansal S., Misra A. K., and Bajpai P., “Evaluation of modified bituminous concrete mix developed using rubber and plastic waste materials”, International Journal of Sustainable Built Environment vol. 6, pp. 442–448, 2017. [15] Veena K., Akshaya J L., “Experimental study of Marshall stability test on dense bituminous macadam layer with partial replacement of bitumen with crumb rubber” International Journal of Engineering Research & Technology, 8(6), pp. 731-736, 2019. [16] Gupta S. & Duggal A. K. (2022) ‘A Review on Behavioral Similarity Between Marshall Stability and Indirect Tensile Strength Values for D.B.M. using VG-30 & VG-40 Grade Binder’, International Journal for Research in Applied Science and Engineering Technology, 10(7), pp. 3369–3373. [17] MORTH (Ministry of Road Transport and Highways), “Specifications for Road and Bridge works”, 5th revision , Indian Roads Congress, New Delhi, India, 2013. (Section-100) [18] ASTM D6927, “Standard Test Method for Marshall Stability and Flow of Bituminous Mixtures”, ASTM International,West Conshohocken, Pennsylvania,United States ,2017. [19] ASTM D6931–17, “Standard Test Method for Indirect Tensile (IDT) Strength of Asphalt Mixtures”, ASTM International, West Conshohocken,Pennsylvania,United States ,2018. [20] IRC-37-2018, “Guidelines for the Design of Flexible Pavements (4th revision)”, Indian Road Congress, Indian Road Congress,New Delhi,India,2018.
Copyright
Copyright © 2025 Er. Madanjee Kumar, Er. Ajay Kumar Duggal. This is an open access article distributed under the Creative Commons Attribution License, which permits unrestricted use, distribution, and reproduction in any medium, provided the original work is properly cited.

Download Paper
Paper Id : IJRASET66828
Publish Date : 2025-02-04
ISSN : 2321-9653
Publisher Name : IJRASET
DOI Link : Click Here
 Submit Paper Online