Ijraset Journal For Research in Applied Science and Engineering Technology
- Home / Ijraset
- On This Page
- Abstract
- Introduction
- Conclusion
- References
- Copyright
Benchmark and Case Studies of Finite Element Modeling for CFD Analysis
Authors: Prasad P, Sreenivasa Murthy B P, Thimmegowda M B
DOI Link: https://doi.org/10.22214/ijraset.2024.65987
Certificate: View Certificate
Abstract
The finite element method (finite volume method) in general and commercial FEA software in particular implemented on a digital computer offers the only unified approach for fluid flow analysis. Finite element modeling is defined here as the analyst’s choice material models, element(type/shape/order), meshes, constraints, analysis procedures, governing matrix equations and their solution methods, specific pre and post processing options available in a chosen commercial FEA software for CFD analysis of candidate problems. The focus of this work is on the use of ANSYS FLUENT software and problems of general interest to mechanical engineers. Using FE models developed using FLUENT significant numerical results are graphically presented and discussed for each problem in separate chapters. The presentation concludes with identification of problems for future work in this field.
Introduction
I. INTRODUCTION
The finite element method (finite volume method) in general and commercial FEA software in particular implemented on a computer offers a universal procedure for CFD analysis.
An ideal fluid is one that has zero viscosity and is incompressible. A real fluid is one with finite viscosity and may or may not be incompressible. A viscous fluid is Newtonian, if its viscosity coefficient is independent of the velocity gradient. Non Newtonian fluids are those for which the viscosity coefficient is a function of the velocity gradient.
Two different viewports are used in the analytical description of the continuum mechanics equation governing fluid motion. The Eulerian description is the one that is most commonly used in fluid dynamics. The other one known as Lagrangian description is common in continuum mechanics of solids and structures. In the Eulearian description one considers the motion of all fluid passing through a fixed location. Here we concerned with changes (with tumet) in velocity, pressure, density, temperature, etc., that are taking place in the matter which happens to occupy the fixed spatial location. In the Lagrangian description of continuum mechanics equations, one considers is the motion of a fixed set of material particles (i.e. fixed matter) irrespective of its spatial location.
A frequently followed approach in fluid flow analysis is to derive the governing differential equation for specific flow, geometry and boundary conditions under consideration and then solve these equations numerically using the finite difference method (FDM).
However, during the last three decades much progress has been made towards the analysis of fluid flow problems using finite element procedures. At present, very complex fluid flow are numerically simulated. In viscid and viscous, compressible and incompressible flows with or without heat transfer are analyzed including the fluid structure interaction problems.
The objective in this chapter is to discuss briefly how the FEM is general and commercial FEA software in particular well known in the solution of solid mechanics and structural mechanics problems can also be applied in the analysis of fluid flow problems. It is effective to use an Eulearian formulation in general fluid flow analysis. The essence of the formulation is that we focus attention on a stationary control volume. However if the solution domain changes, such that as in the free surface problems a pure Eulerain formulation would require the creation of new control volumes. Then it is more effective to use an Arbitrary Lagrangian-Eulerian (ALE) formulation. This approach also allows FEM modeling of Fluid structure interaction problems.
Finite element solution of continuum mechanics equations governing fluid flow (a set of non linear partial differential equations with associated boundary and initial conditions) is obtained by constructing a weak statement of the equations, using weighted residual approach. Specifically, the momentum equations are weighted with velocities, the continuity equation is weighted with pressure and the energy equations are weighted with temperature. Integrating over the domain of the interest and using the divergence theorem to lower the order of the derivatives. In the integrand and to incorporate the natural boundary condition as forcing terms gives the weak statement.
Assuming that finite element discretization of the domain is performed with any one or more of the continuum elements with velocity and pressure as variables and temperature as additional variable at all nodes, the governing matrix equation for a single element (type/shape/order) can be derived. Obviously, the resulting finite element equations are highly nonlinear and strongly coupled.
A major difficulty in the FE modeling of fluid flow problems is that no of solution variables is generally very large because to obtain a realistic resolution of fluid response, very fine meshes are needed and the coefficient matrices are non symmetric. Hence explicit time integration methods and iterative methods for the solution of non linear equation are very attractive
II. GOVERNING EQUATIONS
The governing equations for 2D in viscid compressible planar and axisymmetric flows are the Euler equations given by [1]
Where,
Here U is the vector of conserved variables, E and F are the flux vectors, H is the source term and y is the distance from the nozzle axis. Also ρ is the fluid density, u the x-velocity, v the y-velocity and p represents pressure. The total energy per unit mass em consists of internal and kinetic energy. The fluid considered is air, which is taken as a perfect gas for the range of pressure and temperature involved. For a perfect gas, is given by,
Where, is the absolute temperature and
is the specific heat at constant volume for air. For a compressible flow, to close these equations an equation of state is needed, which for a perfect gas is,
where, R is the characteristic gas constant
III. NUMERICAL MODELS AND METHODS
A. Geometry
1) Flow through a converging and diverging nozzle
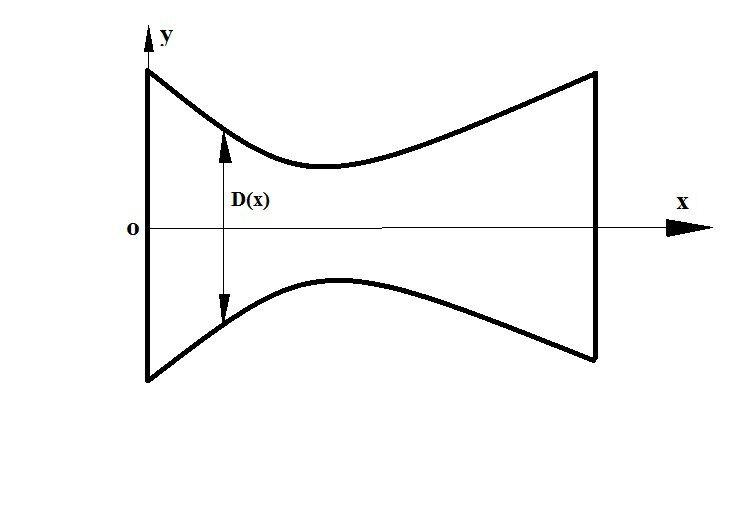
Fig.1: Converging and Diverging Nozzle
A converging-diverging nozzle of geometry defined by the following equation is considered:
The functional relation is given as follows.
D(x) =1+1.5(x-1.5)
For, 0≤x ≤1.5
D(x) =1+1.5(x-0.5)
For 1.5 ≤ x ≤3
Where D(x) is the nozzle diameter at any axial location
2) Flow through orifceplate in a circular duct
The model has been generated using Solid edge software using sketcher option. The geometry is represented for the dimensions and constrained.

Fig.2: Orifice Plate in a circular duct
Fig.2 shows a circular duct with an orifice plate. Fluid in the duct flows at the rate of Q (m3/s). The steady state flow parameters (V, P, and T) in the fluid domain and structural parameters (U, E,) in the elastic solid domain are requested. Ultimately, in case interact with in how turbulent flows interact with flexible solids. Specifically, how do they caused by the turbulent flow deform the solid, and flow does such deformation in turn affect the flow.
Table 1: Orifice plate specifications
|
Outer diameter D1 |
250 mm |
|
Inner diameter D2 |
165 mm |
|
Plate thickness t |
5 mm |
|
Inlet length L1 |
2500 mm |
|
Outlet length L2 |
3000 mm |
|
Density ρ |
1.20 kg/m3 |
|
Viscosity ¥ |
1.8X10⁻⁵ NS/m2 |
|
Flow rate Q |
1.0 m3/s |
The flow is turbulent with a Reynolds’s number Re= 4PQ/πµD1 of 3.4X10⁵
The orifice plate material is steel (rigid)
Young’s modulus E=2.5X10¹¹ N/m2
Poisson’s ratio v=0.3
B. Method and Methodology
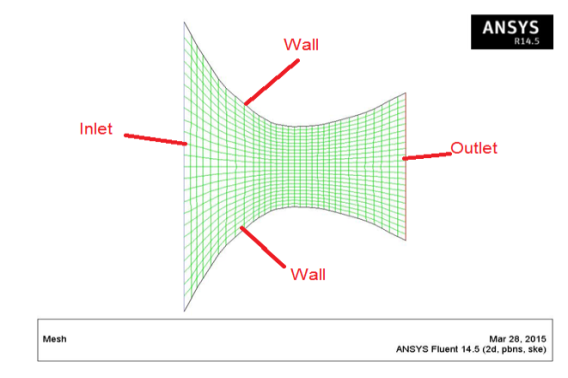
Fig.3: Meshed Plot of converging diverging Nozzle
A structured grid initially with uniform grid spacing along both axial radial directions is generated. Fig.3 shows a typical structured grid with uniform grid spacing along axial and cross-axial direct up of the nozzle.
Computation of axisymmetric flow through the converging diverging nozzle is carried at using ANSYS FLUENT: It is found that special treatment of the grid is required owing the presence to the presence of the radial distance of the cell centroid from the axis. It is important the note that the number of cells along the y-direction must be even to avoid the centroid of any cell lying on the x-axis. Total 768 elements of quadrilateral shape with 825 nodes.
Fluid Properties:
Fluid : Water
Density : 1000 kg/m3
Visocity: 0.001 N-s/m2

Fig.4: CFD Mesh for the Orifice Plate
In Fig.4 total number of elements 1404 along with 1599 nodes are used for mesh representation. The white colour shows wall boundary conditions( As per hydrodynamic theory velocity across the walls is zero and this is the main boundary conditions in the computational fluid analysis. Also wall shear can be calculated using CFD codes). The named selection option in the workbench helps creating and grouping the components.Theright side coloured representation shows outlet boundary condition and left side coloured line represents inlet boundary condtiion in the problem. The elements are fluid elements with required degree of freedom to solve the fluid problem for pressure and velocity. Quadratic elements are used for representation. Sufficient length is considered to reduce any turbulance in the problem to provide a smooth laminar region till the orifice region. Named components are created to apply various hydrodynamic boundary conditions like wall, inlet and outlets. The named components can be observed by various colour codes. Higher mesh density is always desirable to obtain better results in the compuational fluid softwares. In Computational fluid softwares each element is taken as one cell develops one equation unlike finite element softwares. The basis computation fluid softwares is finite volume method.
IV. RESULTS AND DISCUSSION
The results are comparable with the available literature. The results are captured for pressure, velocity flow conditions. Even vector plots are represented in the problem. The analysis results are as follows.
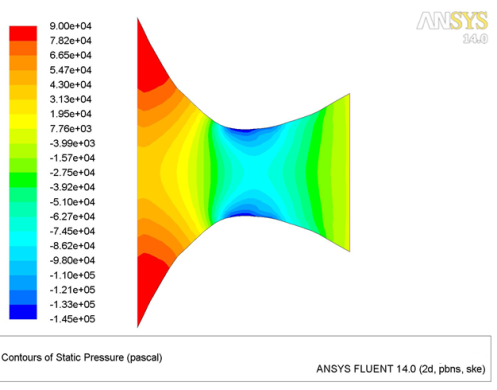
Fig.5: Pressure Plot(Bench Mark problem –Venturi)
Fig.5 shows static pressure plot in the problem. The plot shows negative pressure at the throat section(This is the source for sucking the fluid inside and source for turblancy). The status bar shows variation in the flow pressure conditions. At the corners reprsented by red colour represents positive pressure built up. The blue condition shows negative pressure region. The colour codes represents variation of pressure along the convergind divering nozzle section.
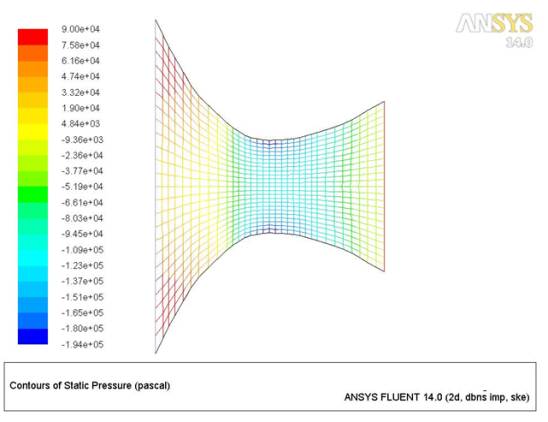
Fig.6: Vector plot of the pressure condition
Fig.6 shows vector plot of the flow through converging diverging nozzle. The vector plots has the advantage of easier identification of magnitudd and direction. By colour code one can easily identify the flow characters. The code has total 20 colours by which more variations can be captured which is useful for the designer for better design of the nozzles. Nozzles are the most used elements in the most of the prime movers and industrial equipment. The regions of the blue colour can be improved by proper design to eliminate negative pressure in the equipment. Negative pressure built up is the most undesirable feature in the hydraulic equipment.
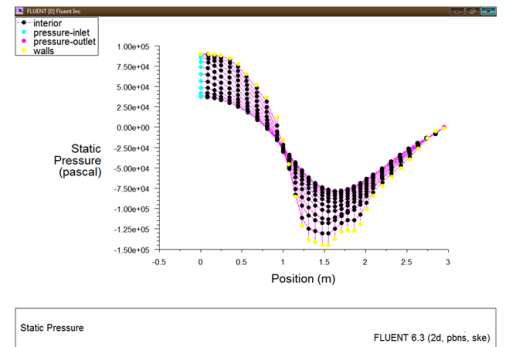
Fig.7: Pressure Variation
Fig.7 shows pressure variation along the interior, pressure inlet, pressure outlet and wall boundary conditions. Positive pressure can be observed at the entry and negaive pressure at the throat region.
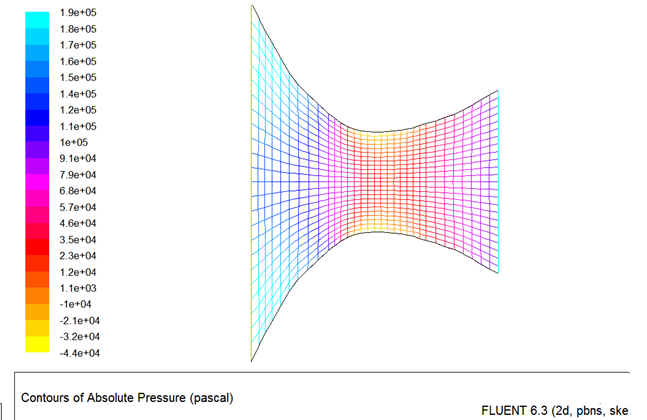
Fig.8: Absolute pressure plot
Fig.8 shows absolute pressure plot in the problem. The variation is shown in the wire frame model. Both positive and negative pressure built up can be observed in the problem.
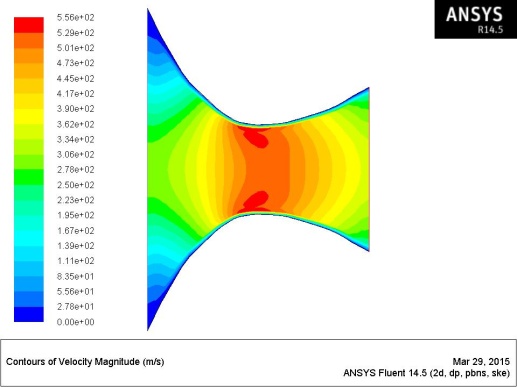
Fig.9: Velocity plot through converging diverging nozzle
Fig.9 shows flow velocity condition through converging-diverging nozzle. Maximum velocity is observed at the middle of the nozzle. Velocity Is observed to be zero at the wall as per the hydrodynamic theory. The maximum velocity shown by red colour region can be mainly attributed to negative pressure built up in the region. The spread of velocity can be observed towards the center. As per hydrodynamic theory, maximum velocity is desirable at th center of the device and minimum at the ends to prevent wall shear creation. But in the problem maximum velocity is not at the center, but near the walls(As per hydrodynamic theory, velocity at the walls should be zero). This peculier behaviour is due to negative pressure built up near the walls.
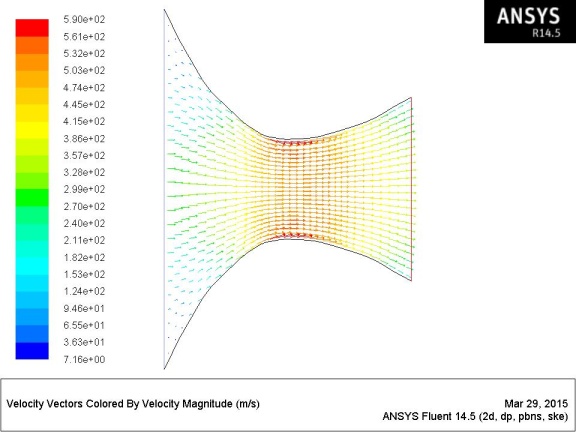
Fig.10: Vector plot of velocity through converging diverging nozzle
Fig.10 shows vector plot through the converging diverging nozzle. Maximum velocity of 590 m/sec can be observed at the throat region. Variaton of velocity is represented through coloured status bar. Even the arrow magnitude represents the variation of the velocity. So Fluent software can be used for flow studies and can find magnitude of velocity and pressure. The overlap of vectors also indicates possible change of flow region from laminar to turbulant. The user can easily under stand the vector plots due to its representation with magnitude of vector and its direction. By observing the directions, one can estimate whether the flow becomes laminar or turbulent.
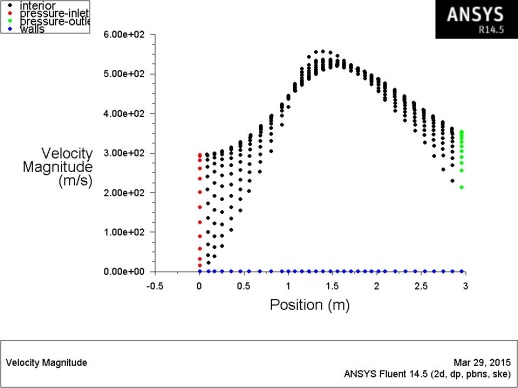
Fig.11: Graphical variation of velocity and presure through converging diverging nozzle
Fig.11 shows graphical variation of velocity across interior of the body, pressure inlet, outlet and across the wall. The graphical plots shows the variation of the flow conditions across the length of the converging diverging nozzle.The plots shows maximum velocity is taking place at the center of the flow nozzle and less at the exit end. The least can be observed at the entry. The flow characters also helps in prior estimation of the inlet velocity required to create the necessary outlet velocity as the nozzle design is very critical in the power industries. Computational flud studies are the most essential studies to eliminate the negative pressure regions along with minimum wall shear requirements. Also it helps in fixing the parameters required to maintain the necessary fluid flow in the process.
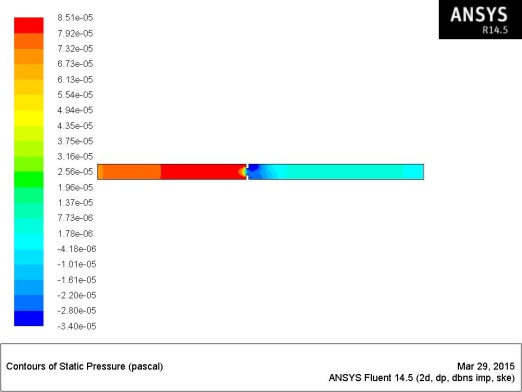
Fig.12: Static Pressure Plot
Fig.12 shows pressure variation from a negative pressure of 3.4 to a possitive pressure of 8.51. Mainly the inlet region of positive pressure and at orifice negative pressure built up can be observed. Even pressure variation or change in pressure can be observed in the inlet side of the orifice meter. Negative pressure built up in the form of blue colour can be observed at the exit end which is source for back flow of fluid.
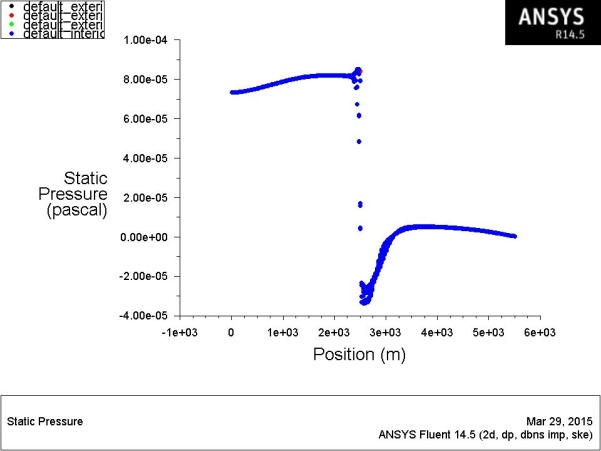
Fig.13: Static Pressure variation
Fig.13 shows drop of positive to negative in the orifice region . A sudden drop can be observed in the orifice region. The extent of drop can be calculated from the computational fluid softwares. Small disturbance of pressure can be observed near the entry and exit of orifice meter. The exit end has the greatest drop and its surrounding has much change of pressure. Later again pressure is increasing and later slopping down. So flow characters can be easily estimated by CFD softwares and its helps in better design of the flow devices for preventing smooth flow of fluid, free of caviatation, hammer blow etc. Also parametric studies can be carrid out to find the effect of orifice for variation in the throat length and opening. By varying the mesh densities, further accurate analysis results can be obtained.
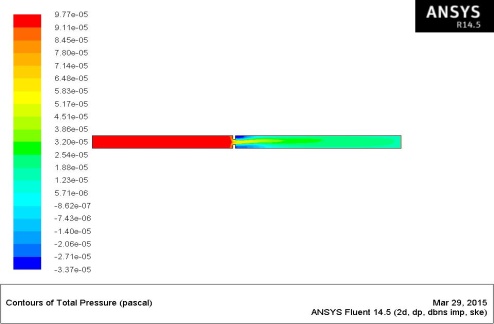
Fig.14: total Pressure Plot
Fig.14 shows total pressure in the system. The total pressure is varying from 3.37 negative pressure to 9.77 positive pressure. The status bar with its colour representation shows change of the pressure. This is mainly observed in the orifice region. Greater change of red to yellow can be observed in the orifice exit region. This change is the cause of increase of flow velocity. The distrance for which pressure changes also can be obtained through flow studies. change of pressure. The orifice meters are mainly having the drop back of nagatave pressure built up at the exit regions and they are the sources for loss of flow. This effect is minimum in the entrance size of the orifice. So orifice design should consider this flow characters for better flow with minimum head losses.
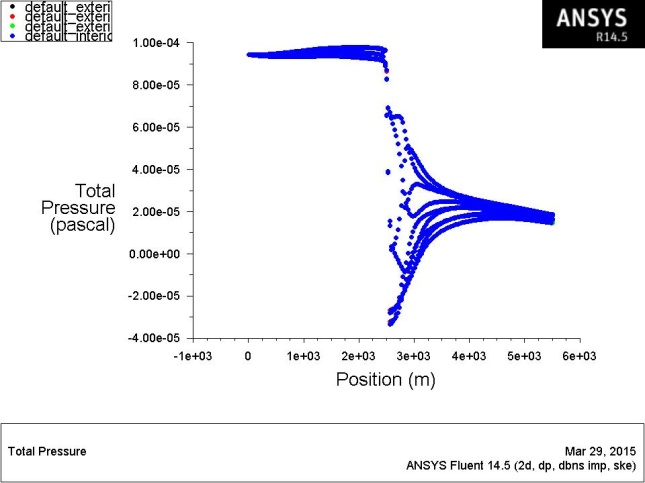
Fig.15: Total Pressure Plot variation
Fig.15 shows variation of total pressure in the orifice region. This is mainly due to increase in the velocity in the orifice plate region. Extreme variation of pressure in the orifice exit region is the main drawback for head loss or flow losses in the orifice meter flows. Further increase and decrease of pressure indicates unsteady conditions in the flow which is again source for flow losses. The great drop pressure also is the source for increased velocity in the orifice region. Coefficient of discharge calculations can be calculate using CFD studies by providing certain parameters as the input which will reduce the burden of costlier experimental setups and time consuming with laborious processes.
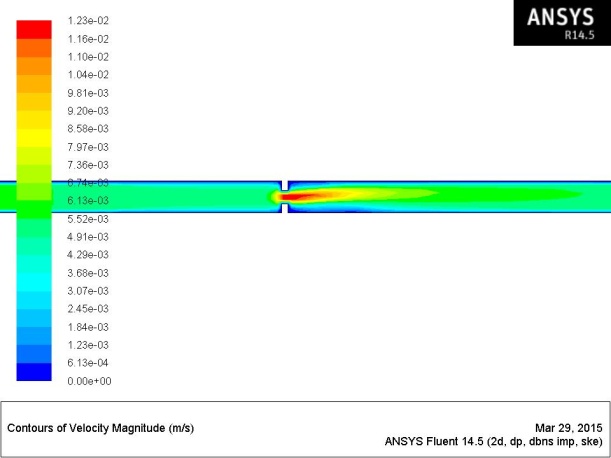
Fig.16: Velocity Plot
Fig.16 shows maximum velocity of 0.0123m/sec at the orifice plate region. The maximum velocity region is represented by red coloured plot. Clear variation of velocity can be observed. This is mainly attributed to reduction in the area of flow, by which pressure will drop and velocity will increse. Also velocity plot shows variation of flow across the orifice. Maximum velocity is observed at the center and minimum at the boundaries. The span of velocity effect also can be found by querying the results for significant velocities. The studies shows velocity has higher effect in the outlet region compared to the inlet region. So proper design should carried out in the exit region of the orifice meters for better flow efficiency.
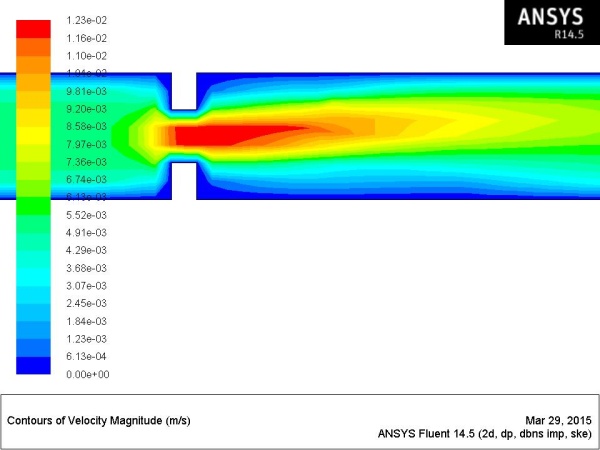
Fig.17: Velocity (zoomed or magnified plot)
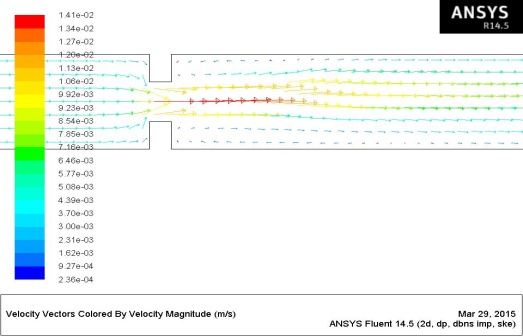
Fig.18: Vector plot for Velocity
Fig.18 shows the velocity plot represented with vector representation. The vector plot shows the flow by arrows whose size indicates magnitude the direction of flow. One can easily identify the region of maximum variation of flow.
Conclusion
Computational fluid analysis has been carried out to analyse flow characters using FLUENT software for two bench mark and two validation problems. The summary of analysis results are as follows. 1) The results shows drop of pressure in the converging section and increase of pressure in the diverging section. Velocity plots shows increase of velocity in the converging section and reduction of velocity in the diverging section. The results are obtained after applying wall, inlet and outlet boundary conditions. 2) The results shows drop of pressure in the orifice region along with increase of velocity. But greater pressure variations can be observed in the flow region compared to the smooth transfer of pressure velocity conditions in the converging and diverging nozzles. 3) Further analysis has been carried out with axisymmetric boundary conditions for venturi meter for the specifed dimensions. The results shows highest drop in the venturi region. But at the same time, velocity is increasing in the throat region. The simulation shows regions of negative pressure and positive pressure. Negative pressure region is undesirable in the flow regions as it causes the back flow and cavitation problems. 4) Finally a verification is carried out with an orifice meter for the specified dimensions. The results shows greater changes of pressure in the inlet and outlet regions. Maximum velocity is observed at the orifice plate region. So CFD simulations helps in finding the negative pressure and back flow regions. These can be eliminated by further changing the flow geometries.
References
[1] Patankar S.V. and Spadling D.B, “A calculation procedure for heat, mass and momentum transfer in three dimensional parabolic flows”, Int-J, Heat and Mass Transfer, vol-15, PP-1787, 1972. [2] Morris G.K. and Garimella S.V., “Orifice and Impingement Flow Fields in Confined Jet Impingement”, ASME Journal of Electronic Packaging, Vol. 120(1), pp 68-72, 1998. [3] F. H. J. Imada, “Numerical Determination of Discharge Coefficients of Orifice Plates and Nozzles”, 22nd International Congress of Mechanical Engineering, November 3-7, 2013 [4] Nikhil Tamhankar, “Experimental and CFD analysis of flow through Venturi meter to determine the coefficient of discharge”, International Journal of Latest Trends in Engineering and Technology (IJLTET), 2014.
Copyright
Copyright © 2024 Prasad P, Sreenivasa Murthy B P, Thimmegowda M B. This is an open access article distributed under the Creative Commons Attribution License, which permits unrestricted use, distribution, and reproduction in any medium, provided the original work is properly cited.

Download Paper
Paper Id : IJRASET65987
Publish Date : 2024-12-18
ISSN : 2321-9653
Publisher Name : IJRASET
DOI Link : Click Here
 Submit Paper Online

