

Ijraset Journal For Research in Applied Science and Engineering Technology
Bonded Composite Laminates (E-Glass to Graphite) Failure Analysis Subjected to Axial Tension
Authors: Prasad P, Sreenivasa Murthy B P, Thimmegowda M B
DOI Link: https://doi.org/10.22214/ijraset.2024.65986
Certificate: View Certificate
Abstract
Researchers studied influence of various parameters on the failure behaviour on metal and composite joints. The one of the challenge in analysis of bonded joints of dissimilar materials of the stress and strain fields at the adhesive layer and adherents. The adhesive bonded joints are most used in present technology in aerospace engineering, mechanical engineering, automotive sectors and civil engineering. This work is based on numerical tools of engineering structures adhesion problems. The proposed numerical tools are implemented Finite Element Method (FEM). A numerical methods based on finite element models can be very useful in describing the failure response of each load step. A FE investigation are carried out for composite to composite bonded joints between E-glass/epoxy to Graphite/epoxy laminates of unidirectional, 0/90/90/0 and 0/30/-30/90 layers orientations are chosen with 2 mm thickness of four layers with 75 mm overlap length. Finite element progressive ply by ply failure analysis of dissimilar composite bonded joint is the target of this study.
Introduction
I. INTRODUCTION
Many methods exist for bringing together similar or dissimilar structural materials, in terms of the joining technique utilized. Conventional mechanical joints, such as bolted, pinned or Riveted are preferred due to their simplicity and the disassembly ability that they offer for joining metal or composite materials [1, 2]. However, when a mechanical joint is loaded, local damage is induced at the fastener holes due to stress concentrations [3].
The use of adhesive bonded joints in load-bearing structures is of great interest to the aerospace, automotive industry and to machine tools modules development as Xiaocong He [4]. Time and cost savings, high corrosion and fatigue resistance, crack retardance and good damping characteristics are the major advantages of these joints altering the geometry of a bonded joint will invariably cause changes in the stress and strain distribution.
The loads in a single lap joint are not co-linear, what produce a bending moment which causes the joint to rotate. This consequently exposes the adhesive layer into shear, and peeling stresses. The adherends are similarly at the same time subjected to tension and bending. It is quite possible that deformation of both of adhesive and adherend may become plastic, particularly in the highly stressed regions.
Research on SLJs has been conducted through experimental and/or numerical methods. Most researchers have assessed bonded joints with similar adherents [5-6]. On the other hand, a limited number of papers have been published regarding joints with dissimilar materials and in particular joints consisting of steel and composite adherents. Owens et al. [7, 8] studied composite-to-aluminium joints in terms of their stiffness behavior due to fractures. Seong et al. [9] investigated the effects of various parameters, such as bonding pressure, overlap length, adherent thickness and material type on the failure load and failure mode of joints with dissimilar materials.
Da Silva et al. [10, 11] Structural adhesive bonding is gaining more and more the interest of researchers and design engineers due to the advantages it offers compared to mechanical joining techniques, particularly when it comes to joining dissimilar materials, e.g. composites to metals.
Engineering analysis of adhesive bonded joints to predict behavior up to failure using the finite element method and commercial FEA software is the focus of this study. The specific joint chosen is unique since it has experimental results up to final failure.
II. MATERIALS
Table 1: Orthotropic properties of E-glass/epoxy and graphite/ epoxy materials [12]
|
Material |
E- glass/ Epoxy |
Graphite/ Epoxy |
|
Young’s Modulus in the 1-direction (E1) |
41 GPa |
294 GPa |
|
Young’s Modulus in the 2-direction (E2) |
10.4 GPa |
6.4 GPa |
|
Young’s Modulus in the 3-direction (E3) |
10.4 GPa |
6.4 GPa |
|
Poisson’s ratio in 1-2 direction (ν12 ) |
0.28 |
0.23 |
|
Poisson’s ratio in 2-3 direction (ν13 ) |
0.28 |
0.23 |
|
Poisson’s ratio in 3-1 direction (ν23 ) |
0.28 |
0.23 |
|
Shear Modulus in 1-2 direction (G12) |
4.3 GPa |
4.9 GPa |
|
Shear Modulus in 1-3 direction (G13) |
4.3 GPa |
4.9 GPa |
|
Shear Modulus in 2-3 direction (G23) |
4.3 Gpa |
4.9 GPa |
Table 2: Strength properties of E-glass and graphite epoxy composite materials [12]
|
|
E- glass/ Epoxy |
Graphite/ Epoxy |
|
Longitudinal tensile strength |
1140 MPa |
985 MPa |
|
Transverse tensile strength |
39 MPa |
29 MPa |
|
Longitudinal compressive strength |
620 MPa |
690 MPa |
|
Transverse compressive strength |
128 MPa |
98 MPa |
III. NUMERICAL MODELING AND METHODS
A. Geometry
1) Geometric Details
- Length of the E- glass adherend = 190 mm
- Length of the Graphite adherend = 190 mm
- Thickness of both adherend = 8 mm
- Overlap length = 75 mm
- Width of both adherends = 23 mm
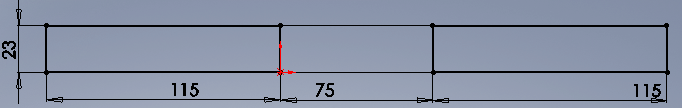
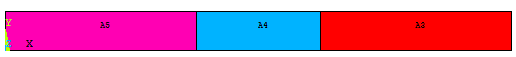
Fig 1: Finite element modelling
Fig 6.1 shows the finite element modelling of bonded joint, the model are created by using ANSYS, and bonded joint are created through the layered thickness. The main aim of to create model without using any adhesives, just creating single lap joint with dissimilar material by using layers and finally layers are glued to connectivity in between all the layers.
B. Laminated Data
- No. of plies = 4
- Thickness of each layer = 2 mm
- Ply orientation : case 1 = [0,0,0,0], case 2= [0/90/90/0] and case 3 = [0/30/-30/90]
- E- Glass and graphite first and third laminates use 4 layers unidirectional and middle laminates includes 8 layersunidirectional with E glass and graphite epoxy composites case 1.
C. Finite Element Type
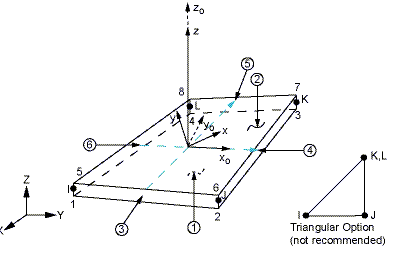
Fig 2: Element type
- SHELL181 is suitable for analysing thin to moderately-thick shell structures.
- It is a four-node element with six degrees of freedom at each node: translations in the x, y, and z directions, and rotations about the x, y, and z-axes.
- The degenerate triangular option should only be used as filler elements in mesh generation
D. FE Meshing
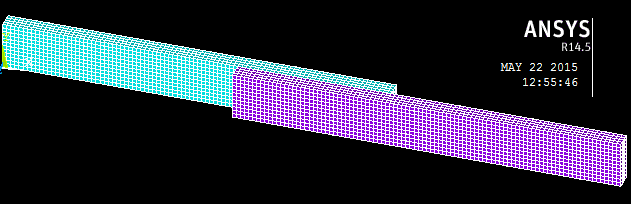
Fig.3: Finite element meshing object
The mesh was progressively refined to ensure convergence.
- Mapped Mesh are used
- Number of elements: 1848
- Number of nodes: 2015
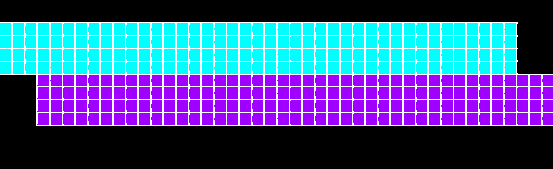
Fig 4: Finite element meshing view of bonded joint
E. F E Boundary Conditions
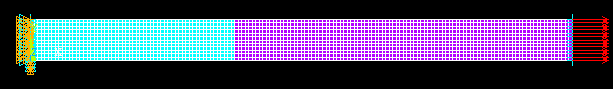
Fig.5: Applied boundary condition to the models
All the nodes at left end is fixed in all degrees of freedom, other right end side fixed nodes are in Z direction of motion and also applied tensile load with respect to the X direction. The boundary conditions are shown in Fig5.
IV. RESULTS AND DISCUSSION
A. For case 1 study [0/0/0/0] layers
Progressive failure analyses are performed to the 4 layers unidirectional with 2 mm thickness of each layer. The geometry is created according to the dimensions by using dissimilar composite material like E glass and graphite/epoxy. First ply to last ply failure analysis are performed and the results are represented in following section for case 1.
The following Table 3 shows the required load and which ply is failure first in progressive analysis of all unidirectional layers.
Table 3: Ply by ply failure result of case 1
|
Sl. No |
Tensile load P in kN |
Failed layer |
Layer orientation in degrees |
|
1 |
30.5 |
4 |
0 |
|
2 |
35 |
1 |
0 |
|
3 |
74 |
2 |
0 |
|
4 |
115 |
3 |
0 |
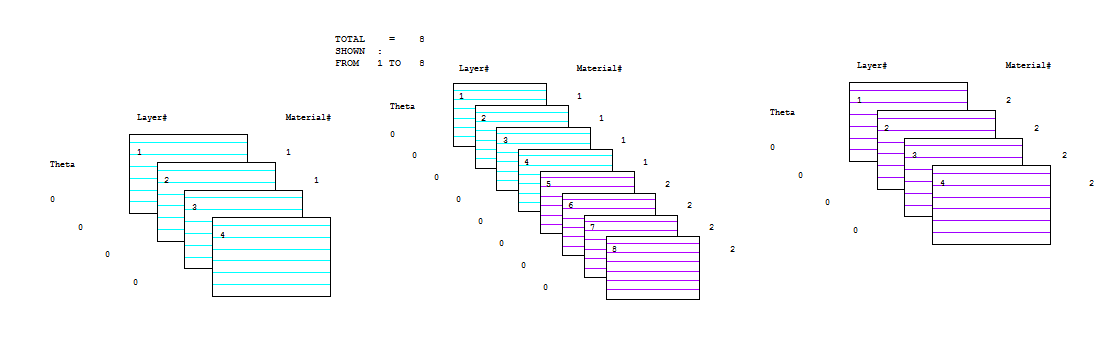
Fig 6: Ply orientation of case 1 studies [0/0/0/0]
Fig 6shows the section orientation of each layer in progressive failure analysis of bonded lap joint between E-glass composite laminates to graphite/epoxy composite four layer laminates. Three laminates are used in this analysis to create FE model of bonded single lap joint. The first and last laminates are used four layers and middle laminates are used 8 layers with different materials are shown in above Fig 6.
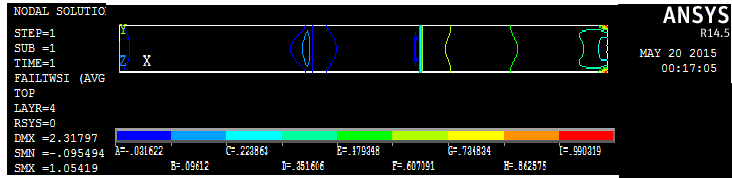
Fig 7: Tsai-Wu failure index for first ply failure case 1 (P=30.5 kN, layer #4)
From Fig7 shows line contour results for unidirectional layers failures of bonded joint between E glass and graphite/epoxy composite laminates. In Fig7 shows that first ply failure in unidirectional layers is layer 4 at the failure load is 30.5 kN and onset layer fails at the load applied region shown in red colour.
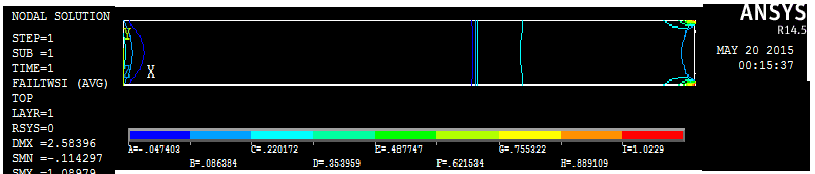
Fig8: Tsai-Wu failure index for second ply failure of case 1 (P=35 kN, layer #1)
From Fig8 shows the Tsai –Wu failure of second layer at load 35 kN, the maximum fails occurs at the end of applied load region in graphite/ epoxy laminates.
Fig9 results are shown for case 1 studies of Tsai- Wu failure strength of layer 2. The next ply fails at load 74 kN in layer 2. In this condition also layer fails at the end of load applied region in graphite/epoxy laminates.
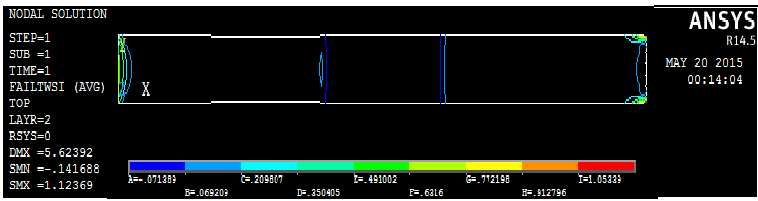
Fig 9: Tsai-Wu failure index for third ply failure of case 1 (P=74 KN, layer #2)
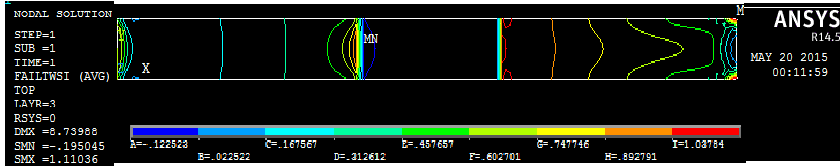
Fig 10: Tsai-Wu failure index for last ply failure of case 1 (P=115 KN, layer #3)
Fig10 shows the onset and growth, nature and extent, shape and size of damage in the constituent plies. The last ply failure (layer 3) takes at the load 115 KN. onset failure of layer 3 located in red line, this layer fails at the region of both in end and near bonded region in graphite epoxy laminate composites and also strength index values are found in E – glass/epoxy region is up to 0.89.
B. FOR CASE STUDY 2 [0/90/90/0] LAYERS
Progressive failure analyses are performed to the 4 layers 0/90/90/0 orientation with 2 mm thickness of each layer. The geometry is created according to the dimensions by using dissimilar composite material like E glass/epoxy and graphite/epoxy. First ply to last ply failure analysis are performed and the results are represented in following section for case 2.
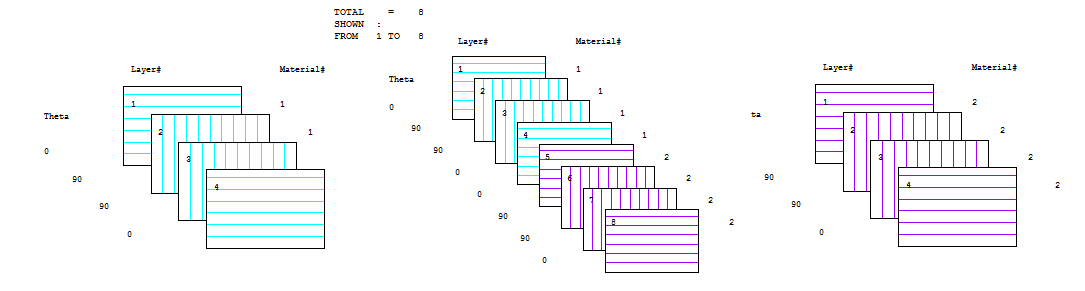
Fig 11: Ply orientation of case 2 studies [0/90/90/0]
Fig11 shows the layer orientation considers finding the ply by ply failure analysis of bonded single lap joint. This case considered layers as 0/90/90/0 degree. First and last laminates used 4 layers of 0/90/90/0 orientations and the middle laminates includes 8 layers with the mentioned layer orientation with two materials.
The following Table 4 shows the required load and which ply is failure first in progressive analysis of all 0/90/90/0 layers.
Table 4: Ply by ply failure result of case 2
|
Sl. No |
Tensile load P in kN |
Failed layer |
Layer orientation in degrees |
|
1 |
11 |
3 |
90 |
|
2 |
14 |
2 |
90 |
|
3 |
24 |
1 |
0 |
|
4 |
42 |
4 |
0 |
Fig12 shows the onset failure of the layer 3 at load 11 kN. First ply of layer fails in the 90 degree layers, failure of 90 degree layer orientation shown in red colour. The 90 degree laminates are fails in very less load compare to unidirectional lamina. The layer 3 fails in E-Glass region in near the bonded joint.
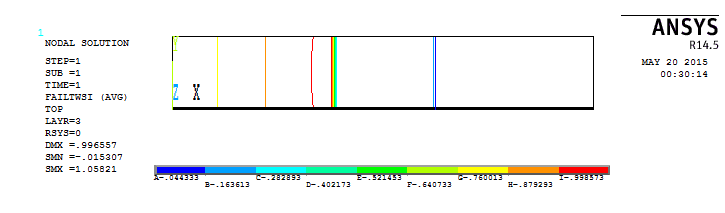
Fig 12: Tsai-Wu failure index for first ply failure of case 2 (P=11 kN, layer #3)
From Fig13 failure ply shows for layer 2, the progressive second ply failure in the layer 2, 90 degree orientation region only. Onset progressive failure layer 2 shown in red colour. The mechanical properties of graphite is more good compare to E glass, this reason only in 90 degree orientation layer fails in E-Glass region at near bonded region.
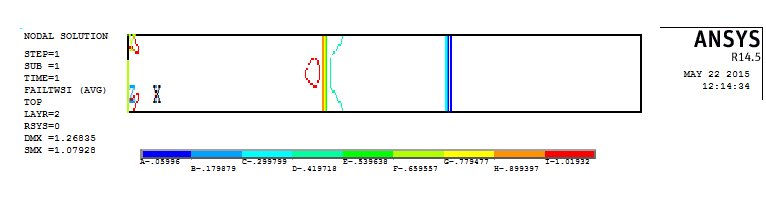
Fig13 :Tsai-Wu failure index for second ply failure of case 2 (P=14 kN, layer #2)
From Fig14 shows the failure load result of third ply failure of bonded joint. In progressive analysis third ply fails occur in the unidirectional layer 1 failure load 24 kN. The onset failure of layer 1 shown in red colour and it locates at end of applied load.
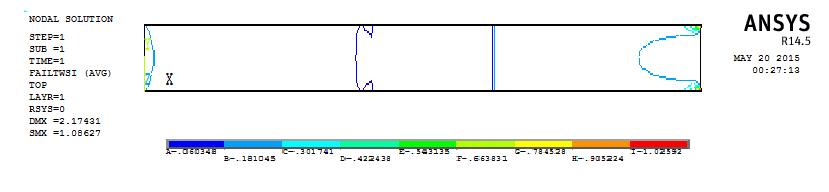
Fig 14: Tsai-Wu failure index for third ply failure of case 2 (P=24 kN, layer #1)
Fig15 shows the behaviour of failure response of layer 4. The last ply failure occurs at unidirectional layer 4 at maximum load 42 kN. The strength index of Tsai-Wu criteria are more in the graphite epoxy region. The onset of different colour indicates the strength index of layer 4. The maximum failure of layer takes place at red colour region.
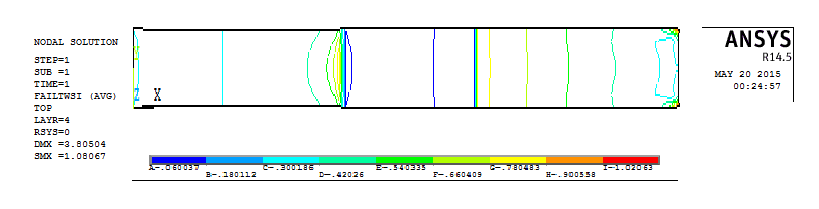
Fig 15: Tsai-Wu failure index for last ply failure of case 2 (P=42 kN, layer #4)
C. For case study 3 [0/30/-30/90] layers
Progressive failure analyses are performed to the 4 layers 0/30/-30/90 degrees orientations with 2 mm thickness of each layer. The geometry is created according to the dimensions by using dissimilar composite material like E glass/epoxy and graphite/epoxy. First ply to last ply failure analysis are performed and the results are represented in following section for case 3.
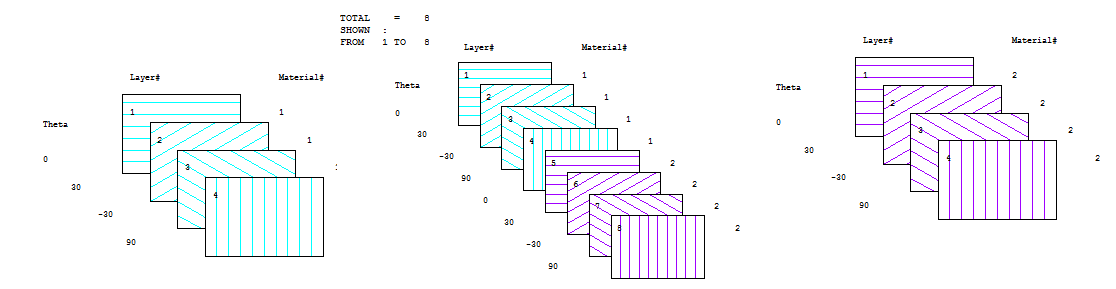
Fig16 : Ply orientation of case 3 studies [0/30/-30/90]
Fig16 shows the layer orientation for case 3, bonded single lap joint between E glass and Graphite epoxy laminates. 4 layers are taken to find the progressive failure ply by ply analysis of bonded single lap joint. The first layer taken has unidirectional, the second and third are 30 degree and -30 degree, last fourth layer 90 degree orientations.
The following Table 5 shows the required load and which ply is failure first in progressive analysis 0/30/-30/90 layers.
Table 5: Ply by ply failure result of case studies 3
|
Sl. No |
Tensile load P in KN |
Failed layer |
Layer orientation in degrees |
|
1 |
4.7 |
4 |
90 |
|
2 |
16 |
3 |
-30 |
|
3 |
21 |
2 |
30 |
|
4 |
30 |
1 |
0 |
From Fig17 shows the results of progressive failure response of case 3, the first ply fails in this case is layer 4, obviously the onset of failure first in the 90 degree orientation layers. Tsai-Wu strength index are shown in Fig17 for layer 4. The red colour indicates the failure region of the bonded layer. The maximum fails takes place in the E-Glass/epoxy material in 90 degree orientation at the near bonding at 4.7 kN load.
Fig18 shows the Tsai-Wu strength index of layer 3. After failing 90 degree layers load are keep on increase the next ply fails at 16 kN. -30 degree orientation layer fails after 90 degree layer. The failure onset layer 2 is in the graphite/ epoxy region at the end of bonded region showed in red colour.
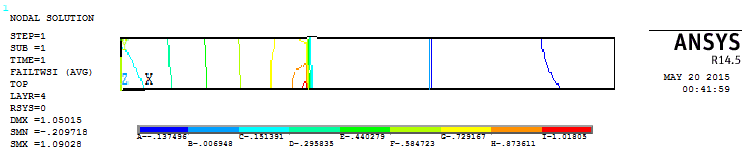
Fig 17: Tsai-Wu failure index for first ply failure of case 3 (P=4.7 kN, layer #4)
From Fig19 shows third ply failure at 30 degree orientation second layer. To fail the second layer required load is 21 kN and the maximum failure of layer at in the graphite/epoxy region only. Onset failure and behavior of bonded joint show in red colour.
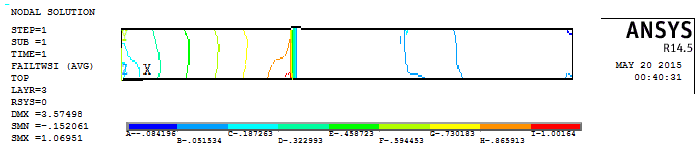
Fig 18 : Tsai-Wu failure index for second ply failure of case 3 (P=16 kN, layer #3)
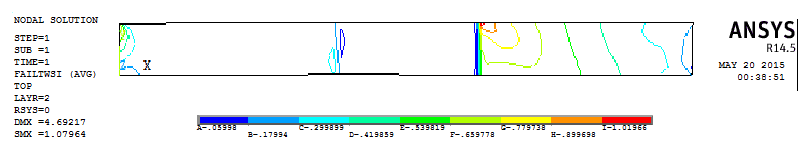
Fig 19: Tsai-Wu failure index for third ply failure of case 3 (P=21 kN, layer #2)
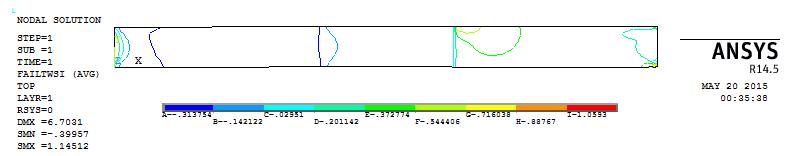
Fig 20:Tsai-Wu failure index for last ply failure of case 3 (P=30 kN, layer #1)
Fig20 shows the last ply failure occurs at unidirectional layer 1. To fail the last ply layer takes 30 kN load. The unidirectional layer of this case 3 fails at the end applied load region in graphite/epoxy. The red colour line indicates the location of layer failure.
D. Deformed Shape Of E-Glass And Graphite Joint
From Fig21 results are obtained modes shape of the bonded single lap joint between E glass/epoxy and graphite/epoxy laminates case 2. Fig21 represents deform and deform with undeforms shape of bonded joint using shell element 181. E-glass/epoxy are fixed all degree of freedoms at left end and loads are applied through nodes in Graphite/epoxy laminates, the locally deform shape of bonded joint are shown in Fig 6.20, the maximum deformation takes place in graphite /epoxy region due to the applied axial tensile load. The deformation shown in Fig21 is almost similar to that of cases 3 and 1.
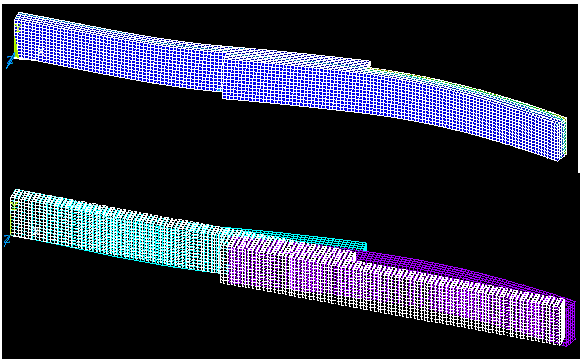
Fig21 : Deformation mode for bonded lap joint case 2 (similar to case 1 and 3)
Conclusion
The finite element method in general and commercial FEA ANSYS software is a universal procedure for solid mechanics and structural mechanics nonlinear analysis problems and also very good tool for progressive layer ply by ply failure analysis. From the results of E-glass/epoxy to Graphite/epoxy bonded joint. The unidirectional lamina layers fails maximum load by comparing the other 0/90/90/0 and 0/30/-30/90 orientations layers. In progressive analysis 90 degree orientation layers fails very early in fewer loads compare to other layers orientations. A layer -30 degree orientation also fails soon after 90 degree orientation layers. The onset failure of unidirectional layers almost fails in the edge of applied load region, the failure of 90 degree orientations layers are fails in the bonded region in vertical directions. Onset failure of -30 and +30 degree orientation layers fails edge in the bonded joint regions. From above results of composite to composite bonded single lap joint we can conclude that, unidirectional layers are strong compare to other layers orientations.
References
[1] K.N. Anyfantis, N.G. Tsouvalis, “Experimental parametric study of single-lap adhesive joints between dissimilar materials”, ECCM15 – 15th European conference on composite materials, Venice, Italy, 24-28 June 2012. [2] Konstantinos N. Anyfantis, “Finite element predictions of composite-to-metal bonded joints with ductile adhesive materials”, Composite Structures 94 (2012) 2632–2639. [3] J. Diaz, L.Romera, S.Hernandez, A.Baldomir, “Benchmarking of three-dimensional finite element models of CFRP single-lap bonded joints”, International Journal of Adhesion & Adhesives 30 (2010) 178–189. [4] Xiaocong He, “A review of finite element analysis of adhesively bonded joints”, International Journal of Adhesion & Adhesives 31 (2011) 248–264. [5] M. Lucic, A. Stoic, J. Kopac, “Investigation of aluminium single lap adhesively bonded joints”, Contemporary Achievements in Mechanics, Manufacturing, and Material science (CAM3S),Gliwice-zakopane, Poland, 6th – 9th December 2005. [6] PK Shoo, B Dattaguru and CRL Murthy, “Finite Element Analysis of Adhesively Bonded Lap Joints”, XIIV NASAS: Fatigue, Fracture and Ageing Structures, 30-31 January 2006, Visvesvaraya National Institute of Technology, Nagpur, pp. 330-334 [7] James F.P. Owens, Pearl Lee-Sullivan, “Stiffness behaviour due to fracture in adhesively bonded composite-to-aluminium joints I. Theoretical model”, International Journal of Adhesion & Adhesives 20 (2000) 39-45. [8] James F.P. Owens, Pearl Lee-Sullivan, “Stiffness behaviour due to fracture in adhesively bonded composite-to-aluminium joints II. Experimental”, International Journal of Adhesion & Adhesives 20 (2000) 47-58. [9] Myeong-Su Seong, Tae-Hwan Kim, Khanh-Hung Nguyen, Jin-Hwe Kweon, Jin-Ho Choi, “A parametric study on the failure of bonded single-lap joints of carbon composite and aluminium”, Composite Structures 86 (2008) 135–145 [10] Da Silva LFM, das Neves PJC, Adams RD, Spelt JK. “Analytical models of adhesively bonded joints – Part I: literature survey”. Int J Adhes 2009; 29:319–30. [11] Da Silva LFM, das Neves PJC, Adams RD, Wang A, Spelt JK. “Analytical models of adhesively bonded joints – Part II: comparative study”. Int J Adhes 2009; 29:331–41. [12] Isaac M.Daniel, OriIshai, “Engineering Mechanics of composite materials” oxford university press, second edition (2006), 373-383.
Copyright
Copyright © 2024 Prasad P, Sreenivasa Murthy B P, Thimmegowda M B. This is an open access article distributed under the Creative Commons Attribution License, which permits unrestricted use, distribution, and reproduction in any medium, provided the original work is properly cited.

Download Paper
Paper Id : IJRASET65986
Publish Date : 2024-12-18
ISSN : 2321-9653
Publisher Name : IJRASET
DOI Link : Click Here
 Submit Paper Online