Ijraset Journal For Research in Applied Science and Engineering Technology
- Home / Ijraset
- On This Page
- Abstract
- Introduction
- Conclusion
- References
- Copyright
Methods Used to Calculate the Sediment Retained by Check Dams in Budgam District of Jammu and Kashmir
Authors: Dr. Bashir Ahmad Pandit
DOI Link: https://doi.org/10.22214/ijraset.2024.57897
Certificate: View Certificate
Abstract
To determine the effectiveness of sediment check dams or the sediment yields of their basins, it is necessary to know how much silt has been captured during the dams\' lifespan. The techniques used to determine the amount of sediment captured by check dams are crucial to comprehending these problems. The accuracy of the many methods that various authors have proposed to measure the volume of retained sediment has not yet been determined and is now under debate. To assess the accuracy and precision of the most widely used techniques (topographic: Digital Terrain Models (DTMs), trapezoids, and sections approaches; geometric: prism, pyramid, and geometric; estimating the volume of silt retained by check dams, we compare them. We establish the volumetric capacity (actual volume) of ten virtual check dams simulated in various gullies of budgam district of Kashmir for our calculations. An extensive topographic survey of these gullies was conducted to create a high-resolution digital elevation model (5 × 5 cm, ±2 mm) using a terrestrial laser scanning equipment. According to the results, topographic methods were the most accurate section approach, providing a very excellent fit to the true volume with a difference of only 11%. The accuracy of geometric approaches was lower, with discrepancies as high as 32%. As a result, care should be taken while interpreting the results of geometric approaches up to this point. It is advisable to proceed cautiously while evaluating the outcomes of geometric procedures up to this point. Topographic approaches take more field data and time than other methods, although being more precise than the others. Therefore, by using our found percentage of variance to rectify their results, geometric approaches can still be helpful. To get the most accurate data possible while analysing how check dams affect sedimentation, erosion processes, and land degradation, it is crucial to be aware of the measurement techniques\' accuracy before to taking any measurements. 2017 John Wiley & Sons,
Introduction
I. INTRODUCTION
Check dams, of which millions have been constructed globally (Verstraeten & Poesen, 2000), are crucial for capturing silt in highly erodible catchments (Quiñonero et al., 2016) and lowering sediment in rivers (Díaz et al., 2014b; Zhao et al., 2015). Numerous authors have attempted to evaluate the function and effectiveness of these structures, yielding varying outcomes (Romero-Díaz et al., 2007; Castillo et al., 2007.
The amount of sediment retained by check dams and their impacts both upstream and downstream have typically been the basis for judgments drawn about these structures.
According to certain writers (Boix-Fayos et al., 2007; Conesa-García et al., check dams have detrimental impacts downstream as a result of bed scouring. exist downstream in the event of intense rainfall (Hooke & Mant, 2002). Bombino et al. have noted certain shifts in the riparian vegetation's diversity (2013).
However, check dams have long been regarded as one of the most crucial methods for generating soil and conserving soil and water . Thus, it is reasonable to say that their impact on sediment retention is obvious. Accordingly, in order to fulfil their intended function, these sediment control structures must be appropriately constructed and evaluated.. Since the amount of silt they have trapped is typically used to quantify their upstream effects, a suitable technique for estimating the volume of retained sediment is needed. An appropriate approach will yield results that are as exact as possible, giving us enough information to understand what is truly needed for a true assessment. There are already a number of techniques for evaluating the sediment that check dams catch,
A. Study Area
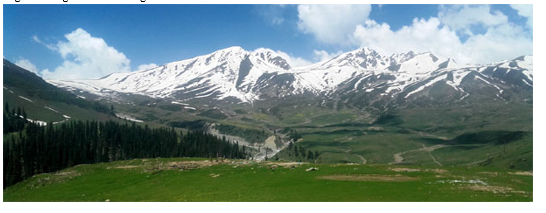
The study was carried out in Budgam district of Jammu & Kashmir State, Situated at an average height of 5,281 ft above sea-level and at 75 degree E longitude and 34 degree N latitude.

The topography of the district is mixed with both mountainous and plain areas. The climate is of the temperate type with the upper-reaches receiving heavy snowfall in winter. The average annual rainfall of the district is 585 mm.
While the southern and south-western parts are mostly hilly, the eastern and northern parts of the district are plain. The average height of the mountains is 1,610 m and the total area under forest cover is 477 sq. km.
the soils are underdeveloped, categorized as Entisols in the suborder Orthent, have low levels of organic matter, and have clayey textures (>40%). Their mean erodibility K-factor of the USLE is medium (0.039 Mg h MJ1 mm~1),
The hydrologically analyzed gullies have very little to no vegetation and are heavily eroded. Their transverse profile varies according to the placement of their cross sections, with V-shaped cross sections in the head of the gully and U-shaped cross sections in the bottom part. Their longitudinal profile has high slopes (>25%).
II. MATERIALS AND METHODS
A. Measurements
A topographic survey of the study gully was conducted using a Leica Nova MS50 and an MS60 Multi Station laser scanning system, respectively, in A1 and A2. Both systems had an accuracy of ±2 mm and a measurement laser beam ø < 8 × 20 mm for 0–50 m. 400 points per square meter, or 5 × 5 cm. In order to survey the gully regions as accurately as possible while avoiding concealed areas on slopes with varying faces, we built a topographic trail using several station points in both cases. The Multi Station laser scanner produced a dense cloud of points after the topographic survey, which we used to create a DEM with milli meter accuracy.
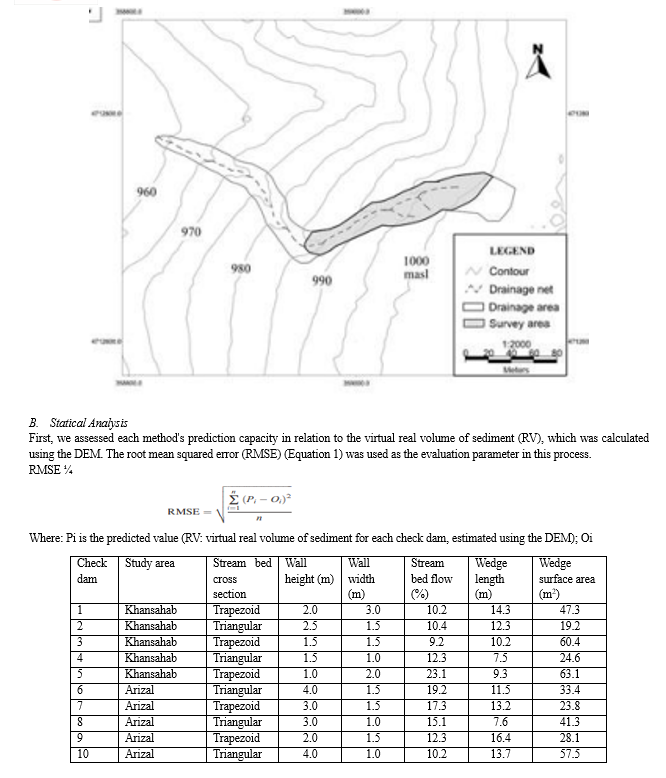
We constructed each virtual check dam by choosing transversal gully bed sections with the highest possible check dam wall height and both a trapezoidal and triangular cross-sectional profile. The chosen altitudes were
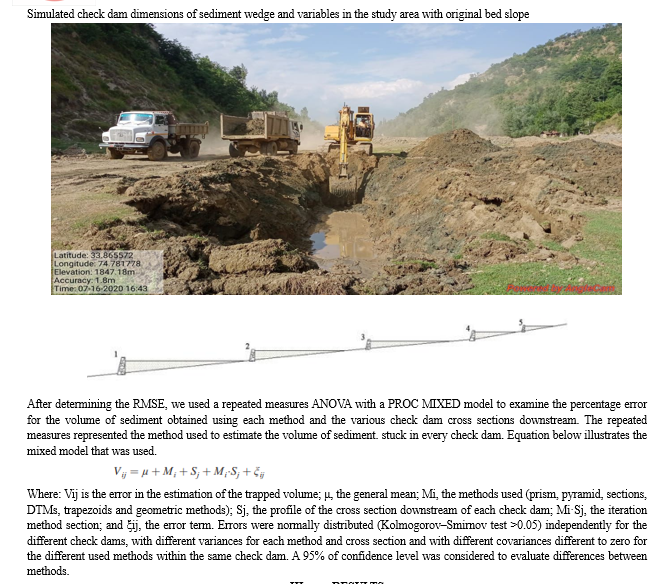
The dimensions of the trapezoidal sections are 2.0,1.5,1.0,3.0 and 2 m, whereas the triangular sections are 2.5, 1.5,1.0, 3.0 and 4 m (Table I). To replicate the surface of the virtual sediment wedges, a horizontal, flat reference surface was created for each cross section. By doing this, we were able to avoid the bias that comes with the slope effect and how some systems correct for it. By comparing the gap produced between these two surfaces, we were able to determine the volume of actual sediment trapped (RV) by each check dam in the various gullies where the wedge surfaces crossed the gully DEMs. The amount of silt captured by each check dam was then calculated a second time using the most used techniques for estimation. The prism (Castillo et al., 2007), pyramid (Romero-Díaz et al., 2007), digital terrain models (DTMs) (Sougnez et al., 2011), trapezoids (Bellin et al., 2011), sections (Díaz et al., 2014b), and geometric (Ramos-Diez et al., 2016a) methods were the six methods evaluated here to determine the volume of trapped sediment. The pyramid method (PyM) views the sediment volume as a pyramid in a horizontal position with a trapezoidal base, while the PM views the sediment volume in gullies with a V-shape and a U-shape stream channel as similar to a trapezoidal prism with rectangular section (Lien, 2003; May & Griffswell, 2003). By comparing two shapes based on topographic data, the DTM method (DM) calculates it. Specifically, (i) the wedge surface is derived from multiple ground-based topographic points, and (ii) the original stream channel is built using the natural slopes and the stream-bed shape of other similar, unsilted gullies to calculate the stream-bed depth. For its part, the sediment wedge is thought to be located by the trapezoids technique (TM).


III. RESULTS
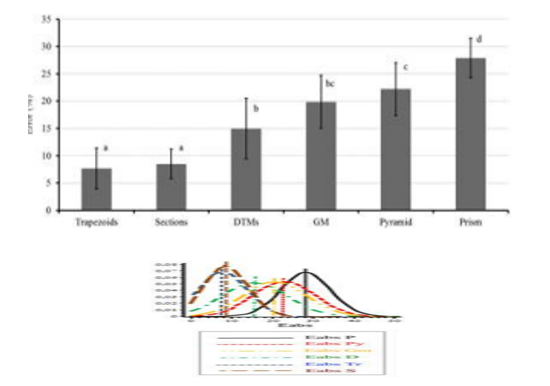
The laser scanning survey revealed a mean volume of RV of 105.9 m3 in the two research areas. The mean volume that was achieved with the SM (101.1 m3) was 4.8 m3 less than this one. Using straightforward geometric approximations, such the PyM (77.5 m3) and the PM (73.9 m3) the volume of confined sediment was underestimated, resulting in results that were 32.0, 28.4, and 26.3 m3 less than RV for the GM (79.6 m3). Additionally, the real trapped volume was overestimated by the DM (92.0 m3), with a value 13.9 m3 less. By comparison, the trapped volume was underestimated by the TM (112.6 m3), resulting in a value that was 6.7 m3 higher than the RV. It was evident that the SM and TM mistakes were statistically comparable (p-value = 0.70), in stark contrast to the other methods (p-value < 0.05 in all combinations), whose errors were larger. Conversely, however, While the mistakes of the latter were statistically equivalent to those of the PyM (p-value = 0.46), the errors of the DM and GM were not (p-value = 0.15). The PM approach yielded the largest mistakes compared to all other assessed methods, with a statistically significant difference in error rates (p-value < 0.05).
Based on these errors, the methods might therefore be divided into three categories: the methods with the lowest magnitudes of error, the DM, GM, and PyM, the methods with intermediate magnitudes of error, and the PM, the method with the largest magnitude of error.

Conclusion
It was discovered that the kind of technique used to calculate the amount of sediment captured by check dams had a significant impact on the accuracy of the findings. Furthermore, we discovered that the downstream cross section measurement technique had a significant influence on the outcomes of the various research techniques. Therefore, in order to acquire the most trustworthy results when measuring the sediment trapped by check dams, consideration must be given to the method and its accuracy level, as well as the cost and field work effort in relation to the study objectives. In this study, the SM stood out as the method that provides the best approximation of the volume of sediment with respect to the real one, as a result of the high number of precise field measurements it employs. The other methods employed in this study, namely, the PM, PyM and GM. The volume results of the various assessed measurement methods can be changed to make them more realistic by using the error method used in this study. With these actual volume numbers, we might employ check dams to ascertain actual rates of erosion, sediment yields, and check dam efficacy, and it would be simple to compare the outcomes of various locations. In addition, the current results could be adjusted if needed to offer more accurate volume numbers for the areas that were studied.
References
[1] Díaz V, Mongil J, Navarro J. 2014b. Topographical surveying for improved assessment of sediment retention in check dams applied to a Mediterranean badlands restoration site (Central Spain). Journal of Soils and Sediments 14: 2045–2056. https://doi.org/10.1007/s11368-014-0958-5. [2] Grimaldi S, Vezza P, Angeluccetti I, Coviello V, Magloire A. 2015. Designing and building gabion check dams in Burkina Faso. Engineering Geology for Society and Territory 3: 529–533. https://doi.org/10.1007/ 978-3-319-09054_107. [3] Hooke J, Mant J. 2002. Floodwater use and management strategies in valleys of Southeast Spain. Land Degradation & Development 13: 165–175. https://doi.org/10.1002/ldr.489. [4] Lien H. 2003. Desing of slit dams for controlling stony debris flows. International Journal of Sediment Research 18: 74–87. [5] Lü Y, Sun R, Fu B, Wang Y. 2012. Carbon retention by check dams: regional scale estimation. Ecological Engineering 44: 139–146. https:// doi.org/10.1016/j.ecoleng.2012.03.020. [6] MAGRAMA. 2015. Ministerio de Agricultura, Alimentación y Medio Ambiente. Online at: www.magrama.gob.es. Accessed on 01/10/2016. [7] Martín-Moreno C, Fidalgo Hijano C, Martin Duque JF, González Martín JA, Zapico Alonso I, Laronne JB. 2014. The Ribagorda sand gully (east-central Spain): sediment yield and human-induced origin. Geomorphology 224: 122–138. https://doi.org/10.1016/j.geomorph.2014.07.013. May CL, Gresswell RE. 2003. Processes and rate of sediment and wood accumulation in headwater streams of the Oregon coast range, USA. Earth Surface Processes and Landforms 28: 409–424. https://doi.org/10.1002/ esp.450. [8] Mekonnen M, Keesstra SD, Stroosnijder L, Baartman JEM, Maroulis J. 2015. Soil conservation though sediment trapping: a review. Land Degradation & Development 26: 544–556. https://doi.org/10.1002/ldr.2308. Minear JT, Kondolf GM. 2009. Estimating reservoir sedimentation rates at large spatial and temporal scales: a case study of California. Water Resources Research 45: 1–8. https://doi.org/10.1029/2007WR006703. [9] Mongil-Manso J, Navarro-Hevia J, Díaz-Gutiérrez V, Cruz-Alonso V, Ramos-Diez I. 2016. Badlands forest restoration in Central Spain after 50 years under a Mediterranean-continental climate. Ecological Engineering 97: 313–326. https://doi.org/0.1016/j.ecoleng.2016.10.020. [10] Navarro J, De Araújo JC, Mongil J. 2014. Assessment of 80 years of ancient badlands restoration in Saldaña, Spain. Earth Surface Processes and Landforms 39: 1563–1575. https://doi.org/10.1002/esp.3541. [11] Abedini M, Md Said MA, Ahmad F. 2012. Effectiveness of check dam to control soil erosion in a tropical catchment (the Ulu Kinta Basin). Catena 97: 63–70. https://doi.org/10.1016/j.catena.2012.05.003. [12] Bellin N, Vanacker V, van Wesemael B, Solé-Benet A, Bakker MM. 2011. Natural and anthropogenic controls on soil erosion in the Internal Betic Cordillera (southeast Spain). Catena 87: 190–200. https://doi.org/ 10.1016/j.catena.2011.05.022. [13] Boix-Fayos C, Barberá GG, López-Bermúdez F, Castillo VM. 2007. Effects of check dams, reforestation and land-use changes on river channel morphology: case study of the Rogativa catchment (Murcia, Spain). Geomorphology 91: 103–123. https://doi.org/10.1016/j.geomorph.2007.02.003. [14] Boix-Fayos C, de Vente J, Martinez-Mena M, Barbera GG, Castillo V. 2008. The impact of land use change and check-dams on catchment sediment yield. Hydrological Processes 22: 4922–4935. https://doi.org/ 10.1002/hyp.7115. [15] Bombino G, Boix-fayos C, Gurnell AM, Tamburino V, Zema D, Zimbone SM. 2013. Check dam influence on vegetation species diversity in mountain torrents of the Mediterranean environment. Ecohydrology 7: 678–691. https://doi.org/10.1002/eco.1389. [16] Bussi G, Rodriguez-Lloveras X, Frances F, Benito G, Sánchez-Moya Y, Sopena A. 2013. Sediment yield model implementation based on check dam infill stratigraphy in a semiarid Mediterranean catchment. Hydrology and Earth System Sciences 17: 3339–3354. https://doi.org/10.5194/hess17-3339-2013. [17] Castillo VM, Mosch WM, García CC, Barberá GG, Cano JAN, LópezBermúdez F. 2007. Effectiveness and geomorphological impacts of check dams for soil erosion control in a semiarid Mediterranean catchment: El Cárcavo (Murcia, Spain). Catena 70: 416–427. https://doi.org/ 10.1016/j.catena.2006.11.009. [18] Conesa-García C, García-Lorenzo R. 2009. Effectiveness of check dams in the control of general transitory bed scouring in semiarid catchment areas (South-East Spain). Water Environment Journal 23: 1–14. https://doi.org/ 10.1111/j.1747-6593.2007.00099.x.
Copyright
Copyright © 2024 Dr. Bashir Ahmad Pandit. This is an open access article distributed under the Creative Commons Attribution License, which permits unrestricted use, distribution, and reproduction in any medium, provided the original work is properly cited.

Download Paper
Paper Id : IJRASET57897
Publish Date : 2024-01-05
ISSN : 2321-9653
Publisher Name : IJRASET
DOI Link : Click Here
 Submit Paper Online

