Ijraset Journal For Research in Applied Science and Engineering Technology
- Home / Ijraset
- On This Page
- Abstract
- Introduction
- Conclusion
- References
- Copyright
Cluster Based Classification Model for Trend Prediction in Time Series Data
Authors: T. Rajesh , Dr. K.VG Rao
DOI Link: https://doi.org/10.22214/ijraset.2024.58044
Certificate: View Certificate
Abstract
Real-time stock market trend prediction plays a essential role in the technical analysis for trend prediction process. Traditional historical technical indicators are difficult to trace and predict the trend due to noise or uncertainty in the training dataset. Since, most of the traditional homogeneous or heterogeneous stocks are used to predict the overall market sentiment for the institutions or retailors. Also, traditional approaches are difficult to find the outliers in the technical indicators data for the clustering process. These models only consider the static metrics or static outlier meaures due to variation in data distribution according to time basis. In this work, a hybrid knn classifier is used to predict the trend of the stock.
Introduction
I. INTRODUCTION
Machine learning (ML) is a data analytics method that acquires knowledge from previous knowledge and provides information directly to the systems[1]. Due to the complex interaction between the features, it is a difficult task to select the most relevant features from the existing ones. There are many types of algorithms for machine learning. Among them, supervised and unsupervised learning are the two main ones. Other machine learning algorithms, except for the above two, are reinforcement learning, recommendation systems, etc. Two main steps, i.e. training time and testing process, are undertaken by a supervised machine learning task. The model is built during the training period and is also tested during the testing phase. The selected data is then split into a dataset for training and testing. Finally, training begins and enters an iterative process of optimizing parameters and a phase of post-processing. The performance is measured during this post processing phase and the best model is selected.
The final model is built when the termination criteria are reached. Online stock market trading today is a highly beneficial and demanding field for investors. Therefore, stock market predictions provide investors with a challenging role in deciding when and where they can invest their money[2]. Since the financial market is highly risky because it depends on many of the country’s social and economic factors, stock market anticipation can be achieved through different technological implementations. Investors use different traditional techniques for better investment decisions, including a complete analysis of the company’s revenues, growth rate and market situation, etc., while the technical inspection decides when to buy and sell the market share. In conventional methods, neural network models and statistical models are used for stock price estimation[3]. During ancient times, the word “stock” was used to collect agricultural products after harvesting and to open them for sale. Then the terms severely used by traders were collecting farm products from farmers and trading with other traders. The company originated during the sale and purchase of stock creates a market known as the stock market . The word “stock” from the agricultural sector to the financial sector is then inherited. This way, many businesses dump their share for sale at different agencies. Through stock exchange, a company can enlist the name of their company to sell their share and the public can buy according to their choice and investment ability[4].
Technical analysis, which can be used for market timing decisions and price target forecasts, can be used to seek help. Technical analysis alerts investors to the imminent risk by suggesting the likely price and time levels as if the market could fall[5]. Passive investors can capitalize on such stock market falls by exiting their existing holdings in index funds at a higher price and buying them back later at a lower price or simply short selling index futures. With the help of various technical instruments, this can be done. An index is a compilation of the prices of a number of representative assets for the purpose of capturing the overall market behavior. Charles Dow, who developed the Dow Jones Industrial Average in 1896, conceived the idea of an index. All stock exchanges around the globe have built their own indices since then. Indices have numerous uses. Investors follow an index to understand the overall performance of the daily market, economists use it to study long-term relationships with other economic factors to analyze and predict business cycle and economic growth patterns, chartists plot and analyze an index’s price and volume changes to predict future market direction.
The Index also serves as a benchmark for evaluating the periodic performance of mutual funds[6]. Studies have found that the respective benchmark index is not beaten by mutual fund managers. Technical analysis metrics are simply a way to explain and measure the stock price trend. Filter benefits include quick computational times (usually much faster than wrapper selection methods) and simple scalability. Filter advantages include fast computational times (usually much faster than wrapper feature selection methods). For high-speed stock data, scalability is of particular importance where selection is required quickly and data dimensionality is high[7]. They further confirmed empirically that the sequential price jumps in equity prices were statistically and economically significant and were autocorrelated positively. Trading volume, however was found to be 60 percent higher and bid-ask spreads on pattern formation were lower. They examined the profitability of the candlestick pattern based trading strategy in U.S. markets. Following the completion of the pattern, the strategy involved buying a stock and holding it for ten trading days. The trading strategy suggested initiating trades on the day after completion of the pattern at the opening price. By holding the trading position for one to ten days, profitability was tested. A new trading position on the candlestick pattern formation was initiated and held for 10 days. The actual returns were compared using the bootstrap methodology to those obtained. Different trends have been implemented in different ways in different markets. So far, sufficient research on w.r.t candlestick patterns in Indian stock markets has not been undertaken to the best knowledge of the author. The Indian stock markets have become a hot destination for venture capital funds, mutual funds, hedge funds, PMS (portfolio management services), private equity funds, etc as a rapidly growing economy and an attractive destination for foreign portfolio investors coupled with mass domestic participation. In addition, increased financial awareness has motivated individuals to invest directly and embrace stock trading as a full-time profession. Thus in the Indian context, there is a need to test this oldest commercial technical school of thought. In addition, the study attempts to evaluate its profitability over various holding time periods using separate trading strategies. These are categorized broadly into patterns of reversal and continuation. A pattern of reversal means a change in the previous trend, and a pattern of continuation means that the previous trend will continue. So in order to use the candlestick for prediction, it is important to identify the trend. Such patterns require either a downtrend or an uptrend to be the present trend.
II. RELATED WORKS
Most of the outlier and clustering models are difficult to find the essential outlier detection measures due to the variance in ranges of each stock prices in the realtime market data[8]. Traditional outlier detecton models are used to find the outlier based on the static average range of all stocks and it is independent of each stock technical feature. Also, most of the clustering models are difficult to group the trend based or extreme outlier based techical stock details on realtime data. used adaptive fuzzy-GARC H and PSO to plan the model for stock index prediction. They selected an RBFNN model for data set training and predicted the SSE index. hybrid algorithms that integrate multiple machine learning models for the financial stock forecasting have become a research hotspot. Nonita Sharma et al. [21] proposed the prediction model LS-RF which combines LSboost with the overall estimation of trees in random forest The predicted performance of LS-RF is superior to the support vector regression method and can be successfully applied to the establishment of a stock price forecasting model. In [22], a stock market forecasting framework has been designed for mixed data (including the scalar data, the class component data, and the class curve function data), which has the ability of the aggregation of information from different sources and the typeless conversion of the existing models. Xingyu Zhou et al. [23] applied the Long Short Term Memory (LSTM) and Convolutional Neural Network (CNN) to conduct a general framework for predicting high-frequency stock markets by using countermeasure training. In [24], a Recursive Convolutional Neural (RCN) network model is applied to predict stock prices, which combines advantages of the convolution, the sequence modeling, the word embedding for the stock price analysis, and the extraction of the financial news information. Ziniu Hu et al. [25] designed a novel hybrid attention network (HAN) based on recent relevant news sequences to predict stock movements. The HAN model provides a new way of analysis by imitating the learning process of human beings when facing such chaotic online information, it follows three principles: the content dependence, the different influences, and the learning efficiency. In [26], under a financial big data platform, the bootstrap resampling technology and the LSTM are used to predict the stock premium value within 20 months. Hyun Sik Sim et al. [27] demonstrated that CNN is an ideal choice for the stock forecasting model. The key issue of using CNN for stock price forecasting is how to design the structure of CNN and how to optimize it.
III. PROPOSED MODEL
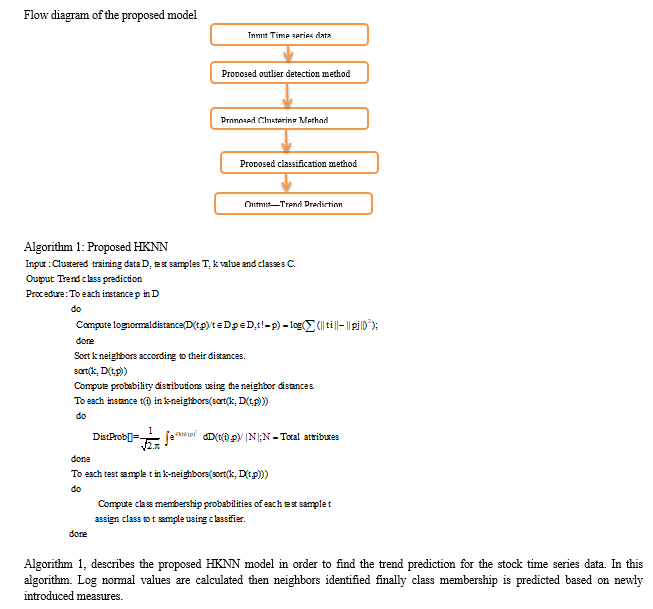
In the section, a hybrid knn model is proposed to find the trend stocks on the realtime market data in a new filtered based clustering model on technical data. The continuous technical data types for trend prediction are evaluated for this model. The flow chart of the proposed stock market trend prediction model is listed in figure.
Initially, data from stock exchange sites such as tradingview or wallmine are taken from the real time market. The training data is used for stock-related technical factors like mark, price, ADX, ADR, RSI, MACD, news sentiment score, etc. Technical data preprocessing and clustering operations are performed on stock technical data.
In the proposed frame work initially time series data is collected then performs outlier detection using proposed approarch then filtered data is send to the proposed hybrid clustering approach to form the clusters then the data is send to the hybrid classifier for trend prediction .
Hybrid KNN we used the log normal distance as newly introduced distance measure then we also used distance based probability mechanism to find out the nearest neighbors.
IV. EXPERIMENTAL RESULTS
Experimental results are simulated with java and third party data in real time. In this model, different stocks data and it’s technical data are taken into account for trend prediction. Also, by using various statistical features are used to find outliers. Statistical measures are evaluated using java libraries from third parties.
A. Performance Evaluation Using Actual Benchmark Data
Actual benchmark dataset: Actual benchmark data set named as NIFTY-50-stock-market-data (API) is taken from NSE India, which contains the data about the price history and trading volumes of the fifty stocks.
B. Bench Mark Data set Information
Dataset Name: NIFTY-50-stock-market-data
Version: 15
Sources: NSE India
C. Collection Methodology:
Data aggregated using https://nsepy.xyz àAPI.
D. Content
The data is the price history and trading volumes of the fifty stocks in the index NIFTY 50 from NSE (National Stock Exchange) India. All datasets are at a day-level with pricing and trading values split across .csv files for each stock along with a metadata file with some macro-information about the stocks itself.
CSV files: 52
770 columns Decimal 495, String 105 Integer 62, Other 108
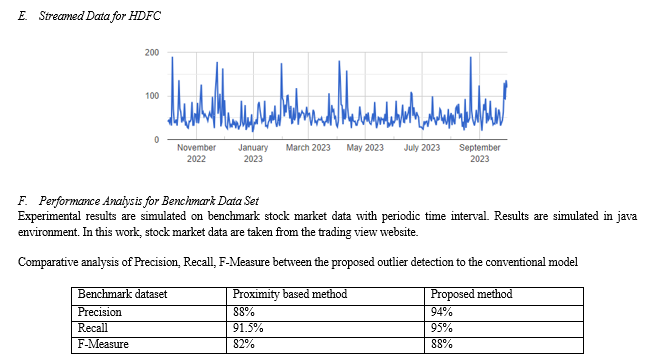
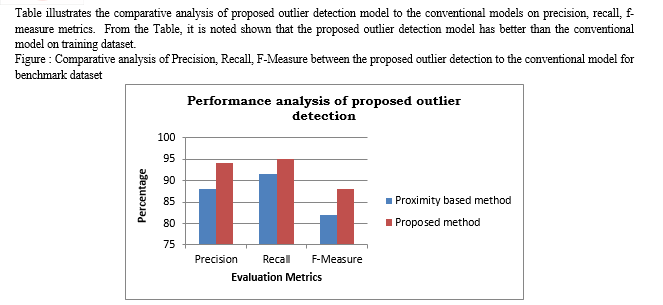
Figure illustrates the comparative analysis of proposed outlier detection model to the conventional models on precision, recall, f-measure metrics. From the Figure , it is noted shown that the proposed outlier detection model has better than the conventional model on training dataset.
G. Main usage of the Proposed Model
The main usage of the outlier detection model is used to identify anomalies with respect to the extreme high level, extreme low level regions. The representation of data objects will fall in the extreme levels due to sudden price fluctuations of the stocks that happen wrt to the external activities such as announcements of dividends, news about the stocks, political news, etc., so identification of those extreme level objects makes huge impact on the stock market data, hence proposed model will be used to identify the extreme changes (sudden hike of the price) for the stocks within seconds and sends an alert notification to the users so that we can avoid losses. Proposed outlier detection model effectively identifies the sudden fluctuations in the stock price for technical indicator data as well as the bench mark data with the presence of external activities.
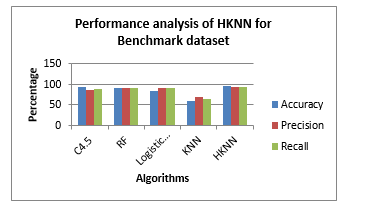
Following results are obtained Accuracy with out cluster based classification,
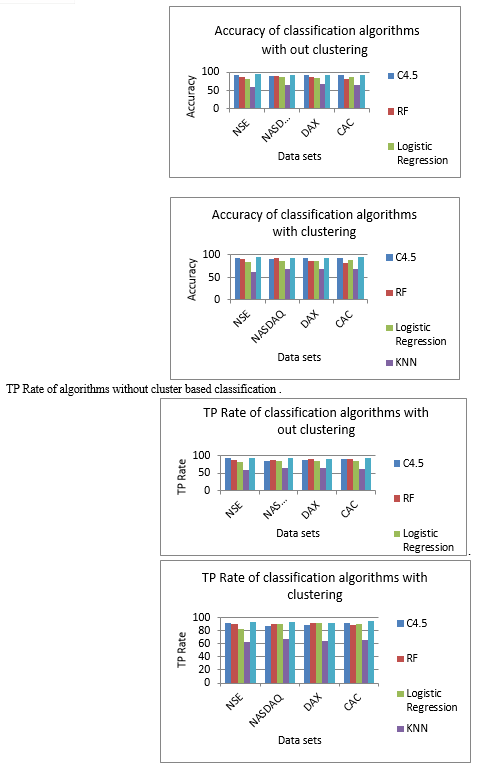
The actual benchmark data set named NIFTY-50-stock-market-data (online streaming data) is taken from NSE India, which contains the data about the price history and trading volumes of the fifty stocks. The proposed outlier detection model is applied to the benchmark data. The main usage of the outlier detection model is used to identify anomalies concerning extreme high-level and extreme low-level regions. The representation of data objects will fall to extreme levels due to sudden price fluctuations of the stocks that happen due to the external activities such as announcements of dividends, news about the stocks, political news, etc., so identification of those extreme-level changes for data objects (stocks) makes a huge impact on the stock market data, hence proposed model will be used to identify the extreme changes (sudden hike of the price) for the stocks within seconds and sends an alert notification to the users so that we can avoid losses. The proposed outlier detection model effectively identifies the sudden fluctuations in the stock price for technical indicator data as well as the benchmark data with the presence of external activities.
Conclusion
In this work, a new cluster based classification approach is proposed to predict the individual stock trend. The bullish and bearish patterns are hard to forecast using trend indicators or realtime stock sentiment news for the most part of the current technical indicators. Experimental findings showed that the current model is computationally effective in terms of predicting trend of the stocks.
References
[1] O. Aladesanmi, F. Casalin, and H. Metcalf, “Stock market integration between the UK and the US: Evidence over eight decades,” Global Finance Journal, vol. 41, pp. 32–43, Aug. 2019, doi: 10.1016/j.gfj.2018.11.005. [2] J. Bley and M. Saad, “An analysis of technical trading rules: The case of MENA markets,” Finance Research Letters, vol. 33, p. 101182, Mar. 2020, doi: 10.1016/j.frl.2019.04.038. [3] A. C. Briza and P. C. Naval, “Stock trading system based on the multi-objective particle swarm optimization of technical indicators on end-of-day market data,” Applied Soft Computing, vol. 11, no. 1, pp. 1191–1201, Jan. 2011, doi: 10.1016/j.asoc.2010.02.017. [4] O. Bustos and A. Pomares-Quimbaya, “Stock market movement forecast: A Systematic review,” Expert Systems with Applications, vol. 156, p. 113464, Oct. 2020, doi: 10.1016/j.eswa.2020.113464. [5] Z. Dai, X. Dong, J. Kang, and L. Hong, “Forecasting stock market returns: New technical indicators and two-step economic constraint method,” The North American Journal of Economics and Finance, vol. 53, p. 101216, Jul. 2020, doi: 10.1016/j.najef.2020.101216. [6] S. R. Das, D. Mishra, and M. Rout, “Stock market prediction using Firefly algorithm with evolutionary framework optimized feature reduction for OSELM method,” Expert Systems with Applications: X, vol. 4, p. 100016, Nov. 2019, doi: 10.1016/j.eswax.2019.100016. [7] D. P. Gandhmal and K. Kumar, “Systematic analysis and review of stock market prediction techniques,” Computer Science Review, vol. 34, p. 100190, Nov. 2019, doi: 10.1016/j.cosrev.2019.08.001. [8] Y. Xu, B. Iglewicz, and I. Chervoneva, “Robust estimation of the parameters of g-and-h distributions, with applications to outlier detection,” Computational Statistics & Data Analysis, vol. 75, pp. 66–80, Jul. 2014, doi: 10.1016/j.csda.2014.01.003. [9] S. Aghabozorgi and Y. W. Teh, “Stock market co-movement assessment using a three-phase clustering method,” Expert Systems with Applications, vol. 41, no. 4, Part 1, pp. 1301–1314, Mar. 2014, doi: 10.1016/j.eswa.2013.08.028. [10] H. Esmalifalak, A. I. Ajirlou, S. P. Behrouz, and M. Esmalifalak, “(Dis)integration levels across global stock markets: A multidimensional scaling and cluster analysis,” Expert Systems with Applications, vol. 42, no. 22, pp. 8393–8402, Dec. 2015, doi: 10.1016/j.eswa.2015.06.053.
Copyright
Copyright © 2024 T. Rajesh , Dr. K.VG Rao. This is an open access article distributed under the Creative Commons Attribution License, which permits unrestricted use, distribution, and reproduction in any medium, provided the original work is properly cited.

Download Paper
Paper Id : IJRASET58044
Publish Date : 2024-01-15
ISSN : 2321-9653
Publisher Name : IJRASET
DOI Link : Click Here
 Submit Paper Online

