Ijraset Journal For Research in Applied Science and Engineering Technology
- Home / Ijraset
- On This Page
- Abstract
- Introduction
- Conclusion
- References
- Copyright
Modernizing Mainframe Monitoring: A Comparative Analysis of Observability Dashboarding Tools
Authors: Raymond Lazarus
DOI Link: https://doi.org/10.22214/ijraset.2024.63866
Certificate: View Certificate
Abstract
This article explores the critical role of observability dashboarding in mainframe environments, focusing on the integration and support of modern observability tools. It examines the functionalities and benefits of leading solutions such as Prometheus with Grafana, Dynatrace, Datadog, AppDynamics, IBM Instana, and Checkmk, providing insights into how organizations can enhance their mainframe monitoring capabilities. The article emphasizes the significance of a multi-tool observability strategy, highlighting its advantages in flexibility, redundancy, and comprehensive coverage. Key benefits of effective observability, including proactive issue detection, downtime reduction, improved capacity planning, and enhanced security monitoring, are thoroughly discussed. The article also outlines best practices for implementing observability in mainframes, covering unified dashboards, standardized metrics, automation, training, and continuous improvement. By analyzing these tools and strategies, the research offers valuable guidance for organizations seeking to streamline their observability approaches, ultimately enhancing customer experience and operational efficiency in mainframe-dependent environments. This comprehensive examination of mainframe observability techniques provides a roadmap for leveraging legacy systems alongside cutting-edge monitoring solutions, addressing the evolving needs of modern IT infrastructures.
Introduction

I. INTRODUCTION
In the era of digital transformation, mainframe systems continue to play a pivotal role in the IT infrastructure of many large organizations, particularly in finance, healthcare, and government sectors [1]. Despite their robustness and reliability, managing mainframe environments presents unique challenges, especially regarding monitoring and observability. The evolution of observability tools has significantly transformed how organizations maintain visibility into their systems, ensuring performance, reliability, and rapid issue resolution. This paper explores the critical role of observability dashboarding in mainframe environments, emphasizing the integration and support for modern observability tools such as Prometheus with Grafana, Dynatrace, Datadog, AppDynamics, IBM Instana, and Checkmk.
By examining the functionalities and benefits of these tools, we provide insights into how companies can streamline their observability strategies to enhance customer experience and operational efficiency. Adopting these advanced monitoring solutions represents a significant leap forward in mainframe management, enabling organizations to leverage the power of their legacy systems while benefiting from cutting-edge observability techniques [2].
II. THE SIGNIFICANCE OF OBSERVABILITY IN MAINFRAME ENVIRONMENTS
Observability in the context of mainframe environments refers to the ability to measure and understand the internal states of a system based on its external outputs. It goes beyond traditional monitoring by providing deeper insights into system behavior, performance, and potential issues. In mainframe systems, observability encompasses the continuous collection and analysis of performance metrics, system logs, and application traces to ensure optimal operation and rapid problem resolution [3].
A. Key Benefits
- Proactive Issue Detection: Observability tools enable the early identification of potential problems before they escalate into critical issues. By analyzing patterns and trends in real-time data, these tools can alert administrators to anomalies or performance degradation, allowing for preemptive action.
- Downtime Reduction: With enhanced system performance and behavior visibility, organizations can significantly reduce mainframe downtime. Observability solutions provide detailed insights that facilitate faster root cause analysis and problem resolution, minimizing the impact on business operations.
- Improved Capacity Planning: Comprehensive observability data allows for more accurate capacity planning. By analyzing historical trends and current usage patterns, organizations can make informed decisions about resource allocation, system upgrades, and scalability requirements, ensuring optimal performance and cost efficiency.
- Enhanced Security Monitoring: Observability tools play a crucial role in maintaining the security of mainframe environments. They provide real-time monitoring of security-related events, anomalies, and potential breaches, enabling rapid detection and response to security threats. This is particularly important given the critical nature of data often processed by mainframe systems [4].
These benefits collectively contribute to improved system reliability, performance, and operational efficiency, making observability an essential aspect of modern mainframe management. By leveraging advanced observability tools and practices, organizations can ensure that their mainframe environments continue to meet the demanding requirements of today's digital landscape while maintaining the robustness and reliability for which they are known.
III. ANALYSIS OF MODERN OBSERVABILITY TOOLS FOR MAINFRAMES
A. Prometheus and Grafana
Prometheus is an open-source monitoring and alerting toolkit designed for reliability and scalability. It collects and stores metrics as time series data, enabling powerful querying through its PromQL language. Grafana complements Prometheus by providing customizable visualization dashboards, allowing for intuitive interpretation of complex metrics [5].
The integration of Prometheus and Grafana in mainframe environments offers real-time monitoring, alerting, and customizable dashboards tailored to mainframe metrics. This combination enables detailed performance tracking and anomaly detection, crucial for maintaining mainframe health.
B. Dynatrace
Dynatrace employs artificial intelligence for automatic anomaly detection and root cause analysis. Its AI engine, Davis, processes vast amounts of data to provide actionable insights, reducing the manual effort required in mainframe monitoring [6].
Dynatrace's integration offers AI-driven insights for proactive issue resolution and comprehensive monitoring across hybrid cloud environments, including mainframes. This allows for seamless integration with existing DevOps processes and enhanced visibility into complex mainframe ecosystems.
C. Datadog
Datadog provides a unified view of the entire stack, bringing together data from servers, databases, tools, and services. This holistic approach is particularly valuable for mainframe environments integrated with modern infrastructure.
The integration of Datadog enables unified monitoring across all infrastructure components, including mainframes. It offers a rich set of integrations with cloud and on-premise technologies, providing advanced analytics and visualization capabilities for mainframe metrics.
D. AppDynamics
AppDynamics specializes in application performance management (APM) and IT operations analytics. It provides deep visibility into application performance, which is crucial for mainframe-based applications.
Integration with AppDynamics offers deep application performance insights and end-to-end transaction monitoring. Its Business iQ feature provides real-time business performance monitoring, linking mainframe performance to business outcomes.
E. IBM Instana
IBM Instana offers automated APM for modern dynamic applications. It provides immediate feedback to developers and operations teams by continuously monitoring application performance, which is essential in mainframe environments.
Instana's integration provides automatic discovery and monitoring of applications within mainframe environments. It offers real-time performance data and AI-powered anomaly detection, enhancing the observability of mainframe-based applications.
F. Checkmk
Checkmk is a versatile IT monitoring system that covers servers, applications, networks, and containers. Its scalability and flexibility make it well-suited for mainframe environments [7].
The integration of Checkmk offers scalability for large mainframe environments and flexibility in monitoring various components. Its user-friendly interface and dashboarding capabilities make it easier for teams to monitor and manage complex mainframe systems.
|
Tool |
Key Features |
Main Benefits |
Best Suited For |
|
Prometheus & Grafana |
|
|
|
|
Dynatrace |
|
|
|
|
Datadog |
|
|
|
|
AppDynamics |
|
|
|
|
IBM Instana |
|
|
|
|
Checkmk |
Comprehensive IT monitoring Scalability for large environments |
|
|
Table 1: Comparison of Modern Observability Tools for Mainframes [5-7]
IV. MULTI-TOOL OBSERVABILITY STRATEGY
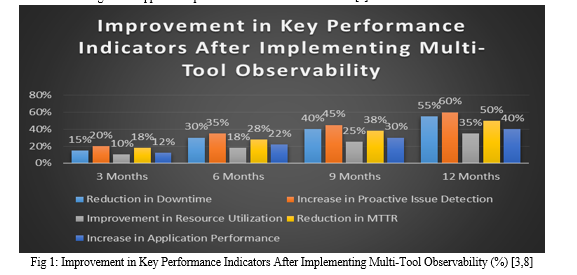
In the complex landscape of mainframe environments, relying on a single observability tool often proves insufficient to address all monitoring and analysis needs. Each tool has its strengths and specializations, and the rationale for supporting multiple tools stems from the need to leverage these diverse capabilities. By integrating various observability solutions, organizations can create a more robust and comprehensive monitoring framework that addresses the multifaceted nature of mainframe systems.
Benefits of a multi-tool approach
- Flexibility: A multi-tool observability strategy provides organizations with the flexibility to choose the most appropriate tool for specific monitoring tasks or system components. This approach allows for tailored solutions that can adapt to the unique requirements of different mainframe applications and services. For instance, while one tool might excel at real-time performance monitoring, another might offer superior long-term trend analysis capabilities.
- Redundancy: Implementing multiple observability tools introduces a layer of redundancy that enhances the reliability of the overall monitoring system. If one tool experiences downtime or fails to detect an issue, others can continue to provide critical insights, ensuring uninterrupted visibility into mainframe operations. This redundancy is particularly crucial for maintaining high availability in mission-critical mainframe environments.
- Comprehensive Coverage: Different observability tools often focus on specific aspects of system performance or user experience. By combining multiple tools, organizations can achieve more comprehensive coverage across various dimensions of mainframe observability. This holistic approach enables a deeper understanding of system behavior, from low-level hardware metrics to high-level application performance and user interactions [8].

The multi-tool observability strategy allows organizations to harness the collective strengths of various monitoring solutions, creating a more resilient, flexible, and insightful observability framework for mainframe environments. This approach not only enhances the ability to detect and resolve issues quickly but also provides a richer set of data for ongoing optimization and capacity planning.
V. BEST PRACTICES FOR IMPLEMENTING OBSERVABILITY IN MAINFRAMES
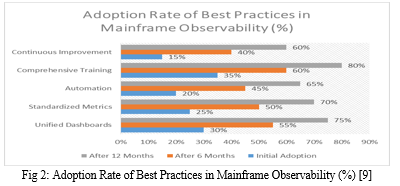
Implementing effective observability in mainframe environments requires a strategic approach that combines technological solutions with organizational best practices. The following guidelines can help organizations maximize the benefits of their observability initiatives:
A. Unified Dashboards
Creating unified dashboards that integrate data from multiple observability tools is crucial for providing a holistic view of mainframe performance. These dashboards should present key metrics, alerts, and insights in a clear, accessible format, enabling quick identification of issues and trends across the entire mainframe ecosystem.
B. Standardized Metrics
Establishing a set of standardized metrics across all observability tools ensures consistency in measurement and reporting. This standardization facilitates easier comparison of performance data over time and across different system components, leading to more accurate analysis and decision-making.
C. Automation
Automating data collection, analysis, and alerting processes is essential for managing the vast amount of information generated by mainframe systems. Automation reduces manual effort, minimizes human error, and enables faster response times to critical issues. Implementing automated workflows for routine tasks and incident response can significantly enhance the efficiency of mainframe operations.
D. Training
Comprehensive training programs for IT staff are vital to ensure the effective use of observability tools and interpretation of the data they provide. This includes not only technical training on specific tools but also education on best practices in data analysis, problem-solving, and performance optimization in mainframe environments.
E. Continuous Improvement
Adopting a culture of continuous improvement is crucial for maintaining an effective observability strategy. Regularly reviewing and updating the observability approach, including reassessing tool selection, refining metrics, and optimizing dashboards, ensures that the strategy evolves with changing technology and business needs.
Implementing these best practices requires a coordinated effort across different teams and levels of the organization. It's important to note that the effectiveness of these practices can vary depending on the specific mainframe environment and organizational context. As pointed out by Aceto et al., the selection and implementation of monitoring solutions should be tailored to the specific needs and constraints of the organization, taking into account factors such as scalability, reliability, and integration capabilities [9].

By following these best practices, organizations can create a robust observability framework that not only enhances the performance and reliability of their mainframe systems but also provides valuable insights for strategic decision-making and continuous improvement.
|
Best Practice |
Description |
Key Benefits |
|
Unified Dashboards |
Integrate data from multiple tools into centralized views |
|
|
Standardized Metrics |
Establish consistent measurements across all tools |
|
|
Automation |
Automate data collection, analysis, and alerting processes |
|
|
Training |
Provide comprehensive education on tool usage and data interpretation |
|
|
Continuous Improvement |
Regularly review and update the observability strategy |
|
Table 2: Best Practices for Implementing Observability in Mainframes [9]
Conclusion
In conclusion, the integration of modern observability tools and practices into mainframe environments represents a significant leap forward in IT infrastructure management. This paper has explored the critical role of observability dashboarding in mainframes, examining the capabilities and benefits of leading tools such as Prometheus with Grafana, Dynatrace, Datadog, AppDynamics, IBM Instana, and Checkmk. The multi-tool observability strategy emerges as a powerful approach, offering flexibility, redundancy, and comprehensive coverage that single-tool solutions cannot match. By implementing best practices such as unified dashboards, standardized metrics, automation, comprehensive training, and continuous improvement, organizations can maximize the value of their observability initiatives. As mainframes continue to play a vital role in many industries, the adoption of these advanced monitoring and analysis techniques ensures that these systems remain robust, reliable, and responsive to evolving business needs. The future of mainframe management lies in the seamless integration of legacy systems with cutting-edge observability tools, enabling organizations to leverage the power of their mainframe infrastructure while benefiting from the agility and insights of modern IT practices.
References
[1] Boris Petkov, \"From Resilience to Antifragility\" https://medium.com/zowe/from-resilience-to-antifragility-8ef5b1d3e9de [2] Giuseppe Aceto, Alessio Botta, Walter De Donato, and Antonio Pescapè. 2013. Survey Cloud monitoring: A survey. Comput. Netw. 57, 9 (June, 2013), 2093–2115. https://doi.org/10.1016/j.comnet.2013.04.001 . [3] D. Yuan et al., \"Simple Testing Can Prevent Most Critical Failures: An Analysis of Production Failures in Distributed Data-Intensive Systems,\" in 11th USENIX Symposium on Operating Systems Design and Implementation (OSDI 14), 2014, pp. 249-265. https://www.usenix.org/system/files/conference/osdi14/osdi14-paper-yuan.pdf [4] Jacopo Soldani and Antonio Brogi. 2022. Anomaly Detection and Failure Root Cause Analysis in (Micro) Service-Based Cloud Applications: A Survey. ACM Comput. Surv. 55, 3, Article 59 (March 2023), 39 pages. https://doi.org/10.1145/3501297 [5] Alessio Netti, Michael Ott, Carla Guillen, Daniele Tafani, Martin Schulz, Operational Data Analytics in practice: Experiences from design to deployment in production HPC environments, Parallel Computing, Volume 113, 2022,102950,ISSN 0167-8191, https://doi.org/10.1016/j.parco.2022.102950. [6] Barna, Cornel & Khazaei, Hamzeh & Fokaefs, Marios & Litoiu, Marin. (2017). Delivering Elastic Containerized Cloud Applications to Enable DevOps. 10.1109/SEAMS.2017.12. [7] Brady, Shane & Magoni, Damien & Murphy, John & Assem, Haytham & Portillo, Omar. (2018). Analysis of Machine Learning Techniques for Anomaly Detection in the Internet of Things. 1-6. 10.1109/LA-CCI.2018.8625228. [8] J. Murphree, \"Machine learning anomaly detection in large systems,\" 2016 IEEE AUTOTESTCON, Anaheim, CA, USA, 2016, pp. 1-9, doi: 10.1109/AUTEST.2016.7589589. [9] Qingyang Yu, Nengwen Zhao, Mingjie Li, Zeyan Li, Honglin Wang, Wenchi Zhang, Kaixin Sui, Dan Pei, A survey on intelligent management of alerts and incidents in IT services, Journal of Network and Computer Applications, Volume 224, 2024, 103842, ISSN 1084-8045, https://doi.org/10.1016/j.jnca.2024.103842.
Copyright
Copyright © 2024 Raymond Lazarus. This is an open access article distributed under the Creative Commons Attribution License, which permits unrestricted use, distribution, and reproduction in any medium, provided the original work is properly cited.

Download Paper
Paper Id : IJRASET63866
Publish Date : 2024-08-02
ISSN : 2321-9653
Publisher Name : IJRASET
DOI Link : Click Here
 Submit Paper Online

