Ijraset Journal For Research in Applied Science and Engineering Technology
- Home / Ijraset
- On This Page
- Abstract
- Introduction
- Conclusion
- References
- Copyright
Comparative Analysis of Three Data Mining Tools in the Allocation of Senior Secondary Students into Departments for Career Path
Authors: Akinsola Adeniyi F., Sokunbi. Michael. A, Onadokun I. O, Okenwa-Martins C. Q
DOI Link: https://doi.org/10.22214/ijraset.2023.55054
Certificate: View Certificate
Abstract
Choosing a career path in life begins with studying the right subject combination at the secondary school level. The Nigerian educational system of 6-3-3-4 which makes a student to spend 6 years in pry education, 3 years in junior secondary school, 3 years in senior secondary school and 4 years in the university makes it mandatory for such a student to choose a department of study at the point of entry into the senior secondary school (SSS). It is at this point that a decision is made consciously or unconsciously by the students about life career as the choice of department determines the choice of course of study at the university level later. Students and their parents/guardians often take this decision without any scientific guide which in most cases leads to a wrong choice of career path. In this study, three data mining tools, WEKA, RapidMiner and Orange were employed with three algorithms each to determine the most appropriate tool with the best result in the allocation of senior secondary school (SSS) students to various departments of study. The best algorithm methodology that classified the dataset in WEKA was Random Forest with an accuracy of 100% predicting 308 students correctly. In RapidMiner the best algorithm methodology was Naïve Bayes with an accuracy of 82.9% correctly predicting 73 students. Thereafter, Orange gave the best algorithm methodology to be Random Forest at 98.7333% predicting 304 students accurately. Our study shows that the optimum algorithm suited for the application software implementation to allocate SS1 Students into Department was Random Forest, having highest rates in the Accuracy. Though Orange has additional feature of being able to visualize the output of all the three results in one interface at a glance, and also shows outcome visualizations in various plots and graphs, WEKA’s highest predictive measure of 100% places it above all and makes it the tool of choice with Random Forest being the best algorithm.
Introduction
I. INTRODUCTION
To undergo tertiary educational system in preparation for choice of a career in life, certain subject-combination are required. Prospective scholars apply for a course of study in a university or polytechnic based on qualification to study the desired course having satisfied the admission requirements. Uppermost among these admission requirements is to have studied required Ordinary Level (O’ Level) subjects in the secondary school which could be Science, Art, Social Science or Commercial based. In Nigeria educational system, division into these fields of study are usually done at the entry point into Senior Secondary School. However, the technique for this division into various fields are not based on any scientific technique; it is mostly done on sentiments of what the parent/guardian want their wards to be or on preference for a particular field not based on competences on the underlying subjects. The multiplier effects and consequences of this error sometimes create serious permanent career challenges leading to incompetence in professional practice. This Study used the academic data of scholars who are in the Junior Secondary School of Yaba College of Technology Staff School, preparing to migrate into the Senior Secondary School level to predict their allocation into various academic departments such as Science, Art, Social Science or Commercial.
II. RELATED WORKS
"Modelling and Predicting Student's Academic Performance using Classification Data Mining Techniques" (2020) by Raza Hasan et al. In order to create a classification model to forecast student academic achievement, this study used WEKA. An accuracy of 80.63% was attained by the model.
Kaur, Singh, and Josan (2015) concentrated on using several classification strategies to identify academics who would be slow learners.
They assembled a dataset of 152 students from a high school and used the WEKA tool to train and test the students' performance. The comparison of the various predictive methodologies tested revealed that Multilayer Perception had the highest prediction accuracy, at 75%.
A. A. Al-Amin et al (2019 In order to create a decision tree model to forecast student academic achievement, this study employed Orange. A dataset of 1000 students from a Pakistani institution was used to train the model. The student's grades, attendance, test results, and other details that may have been important to their academic achievement were included in the dataset.
Kapur, Ahluwalia, and Sathyaraj (2017) employed six data mining algorithms to predict student grades are Decision Tree, IBK, K-star, Naive Bayes, Naive Bayes Multiple Nominal, and Random Forest. With the use of the WEKA tool, they compiled a dataset of 480 records with 16 different attributes, and the results showed that Random Forest had the highest prediction result accuracy, at 76.667%.
Hussain, Dahan, Ba-Alwib, and Ribata (2018) used 300 student sample records from three colleges to analyze 12 critical features utilizing four classification methods and 24 attributes at institutions in India and Assam in order to predict student performance. As a consequence of their research, it was shown that Random Forest had the highest prediction accuracy, at 99%, followed by Bayes Network (65.33%), J48 (73%), and PART (74.33%).
Jovel, Angelica, and Corazon (2019). created a model based on a few chosen input variables. Based on a database of prior years, the data mining classification algorithm Nave Bayes was developed to forecast pupils' academic achievement. Data on students was explored, statistically analyzed, and mined using the program Rapid Miner. A cross-validation procedure was carried out using the Cross-Validation operator. The researchers deduced from the aforementioned data that the Nave Bayes model yielded accuracy of 92.37%, indicating the possibility of developing an effective prediction model. The methodology can be used to forecast student performance and assist teachers and administration in improving the standard of instruction and students' academic achievement by making important decisions when they are needed. Predictive analysis based on data could assist the school in exaggerating marketing strategies to attract many kids from the neighborhood. In the future, the study could be enhanced by adding data with higher quality and more information on the students, which could aid in enhancing the performance of the current model and achieving more accurate student performance.
Anjali Singh et al (2022). In order to predict student academic performance, a hybrid model that includes decision trees and random forests was developed in this study using RapidMiner. A dataset of 1000 students from an Indian institution was used to train the model. The student's grades, attendance records, test results, and other details that might have an impact on their performance were all included in the dataset.
Mohamed El-Halees et al. (2021). In order to create a decision tree model to forecast student academic achievement, this study employed Orange. A dataset of 1000 students from an Egyptian institution was used to train the model. The student's grades, attendance records, test results, and other details that might have an impact on their performance were all included in the dataset.
A. Jamil et al.(2018). Used data mining to forecast student academic achievement. A dataset of 1200 students from a university in Pakistan was used for the study. The student's grades, attendance records, test results, and other details that might have an impact on their performance were all included in the dataset.
Musso et al. (2020) suggested a machine learning model based on learning techniques, perceptions of social support, motivation, socio demographics, health status, and academic performance factors. He made predictions about academic performance and dropout rates using this approach. He came to the conclusion that learning methodologies had the biggest impact on predicting GPA, whereas background knowledge had the most impact on predicting dropouts.
Deepak Mishra et al.(2019). They employed RapidMiner to create a decision tree model to forecast student academic achievement. A dataset of 1000 students from an Indian institution was used to train the model. The student's grades, attendance, test results, and other details that may have been important to their performance were included in the dataset.
III. METHODOLOGY
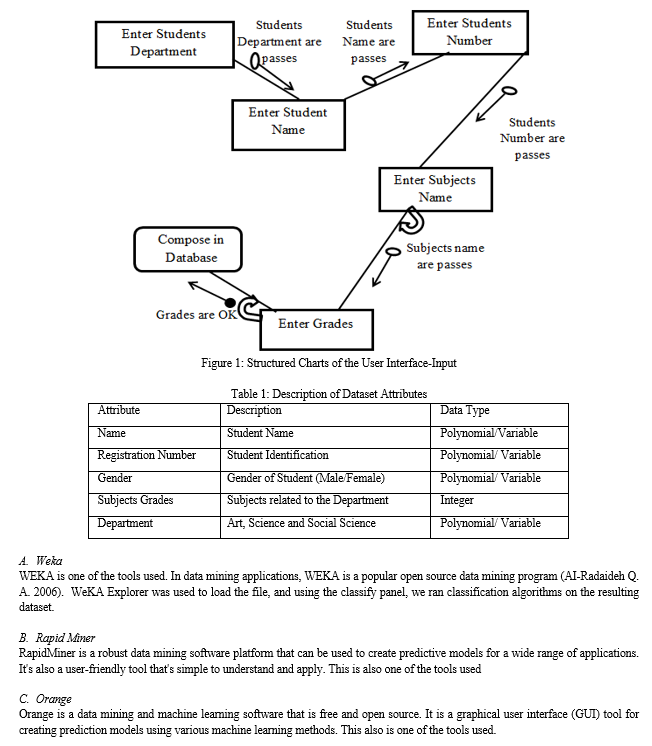
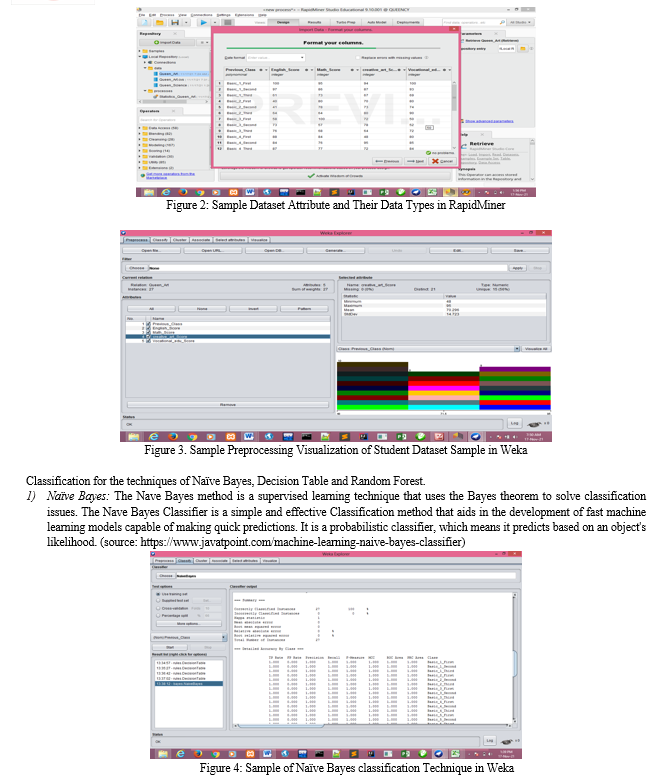
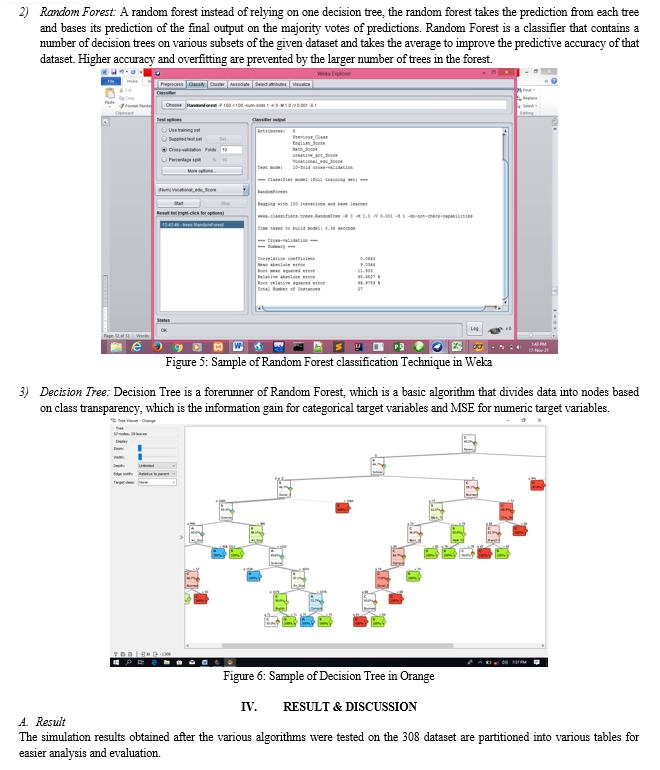
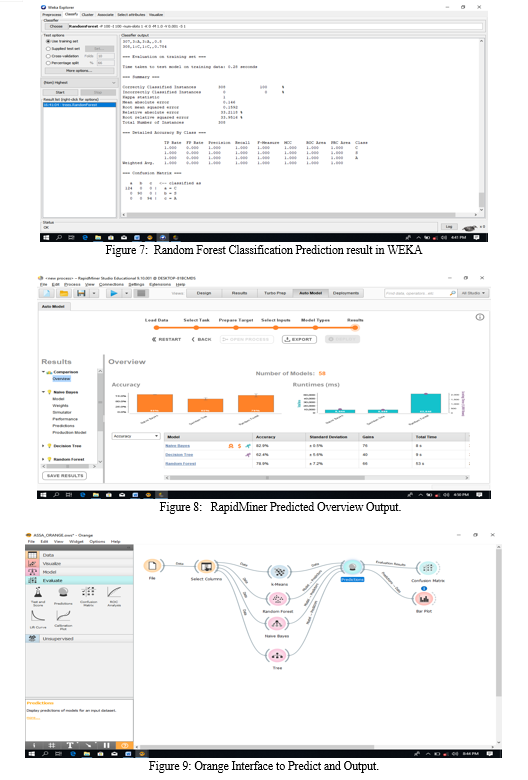
Using Yaba College of Technology Staff Secondary School as a case study, the previous academic results from JSS1-JSS3 of 2021/2022 SS1 student was used as the dataset to carry out the study which contained 308 instances and 54 attributes. The Administrator inputs the required data using Excel Spreadsheet. The Data Mining Programming Tools used are Weka, RapidMiner and Orange in which the algorithms they carryout are Classification for the techniques of Naïve Bayes, Decision Table and Random Forest.
Structured Chart: This chart is the breakdown of the user Interface-Input to its lowest manageable levels. Below is the breakdown diagram of the user input interface.
B. Discussion Of Result
For consistency, three popular Data Mining Algorithms were used to classify for the allocation of SS1 Students of Yaba College of Technology Staff Secondary School, namely Naïve Bayes, Decision Tree (J48) and Random Forest also three known Data Mining Tools named WEKA, Random Forest, and Orange tools were used for implementation.
Confusion Matrix method was used to get the parameters needed for the performance evaluation. Confusion Matrix is a two-dimensional table that shows the predicted labels of model at the columns layout while the correct class labels displays at the rows layout with rates of True Positive (TP), True Negative (TN), False Positive (FP) and False Negative (FN) which when calculated gives results on Sensitivity, Specificity, Recall, Precision, Accuracy, error, F1 Score, etc..
TP is a test result that indicates the presence of an attribute correctly. TN is the test result that indicates the absence of an attribute correctly. FP is a test result that wrongly indicates that a particular attribute is present. FN is a test result that wrongly indicates that a particular attribute is absent. Specificity is the True Negative Rate. Sensitivity is the True Positive Rate also known as Recall which is the percentage measured quantity fraction of relevant positive instances classified correctly. Precision is the percentage measured quality of positive predictive values which are correctly relevant. Accuracy is the percent of predictions that are correct giving a good measure if the classes are evenly split, but mislead if the classes are imbalanced. Error is the percent of predictions that are not correct. F1 is an average or harmonic mean of the precision and recall values.
Below are explanation on how the Confusion Matrix was gotten and other calculations.
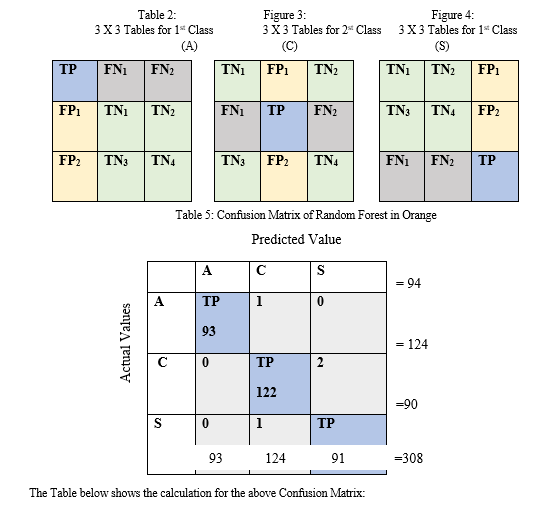
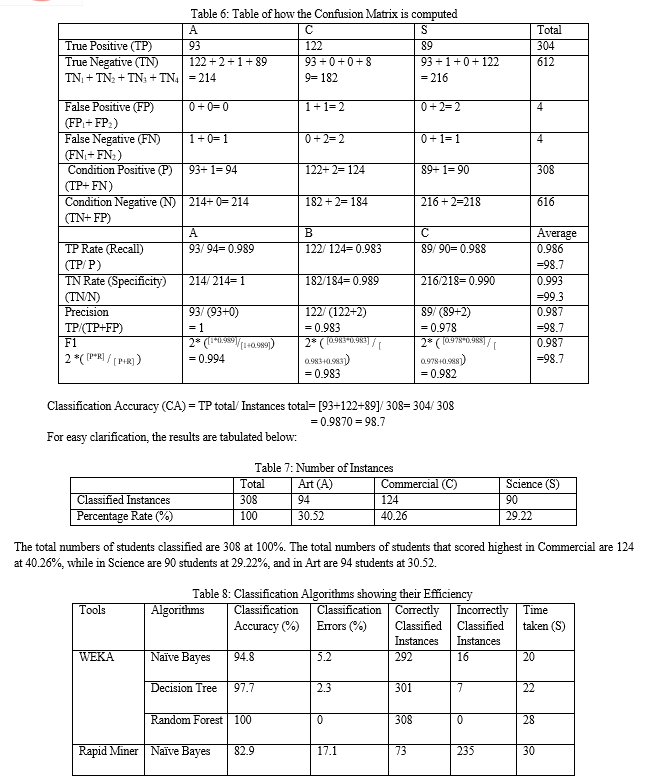

Random Forest predicted 308 students accurately at 100% where 124 Students were correctly classified to be in Commercial Department, 90 Students were classified to be in Science Department and 94 Students to be in Art Department.
2) The Outcomes for RapidMiner
Naïve Bayes gained only 76 students accurately at 82.9%, where 27 Students were correctly classified to be in Commercial Department, 23 Students were classified to be in Science Department and 23 Students to be in Art Department.
Decision Tree gained only 55 students accurately at 62.4%, where 28 Students were correctly classified to be in Commercial Department, 13 Students were classified to be in Science Department and 14 Students to be in Art Department.
Random Forest gained 60 students accurately at 78.9%, where 33 Students were correctly classified to be in Commercial Department, 20 Students were classified to be in Science Department and 18 Students to be in Art Department.
3) The Outcomes For Orange
Naïve Bayes had 259 students accurately predicted at 83.8%,where 104 Students were correctly classified to be in Commercial Department, 75 Students were classified to be in Science Department and 80 Students to be in Art Department.
Decision Tree had 301 students accurately predicted at 97.7273%, where 123 Students were correctly classified to be in Commercial Department, 86 Students were classified to be in Science Department and 92 Students to be in Art Department.
Random Forest had 304 students accurately predicted at 98.7333%, where 122 Students were correctly classified to be in Commercial Department, 89 Students were classified to be in Science Department and 93 Students to be in Art Department.
C. System Strength
Weka Tool showed how the prediction classification are calculated in a clear predefined format compared to RapidMiner and Orange. It shows definition of terms for non-technical support users. It outputs Kappa statistic, ROC Area, PRC Area, TP, FP Rate, F-Measure and MCC compared to RapidMiner and Orange Tool. It takes less time to compute predictions.
RapidMiner Tool showed the three prediction output in a visualized tabulated format, it also shows definition of terms for non-technical support users, it visualizes graphs and models.
Orange Tool showed the three prediction output all at once in one visualization interface. It explains and shows how, when and where to place widgets, aiding in correcting misplacement of widget and wrong output. It takes least time to compute predictions compared to RapidMiner and Orange Tool. It output AUC, CA, F1.
D. System Weakness
Weka Tool does not have a well predefined visualized interface, compared to RapidMiner and Orange Tool. Although it can be used to create separate application software, but does not auto save prediction outputs.
RapidMiner Tool cannot be used to create a separate application software interface. It has the lowest accurate prediction outcome.
Orange Tool cannot output predictions on Naïve Bayes, Decision Tree and Random Forest without the connection of K-means Cluster and Silhouette.
Conclusion
In conclusion, the best algorithm methodology that classified the dataset in WEKA was Random Forest with an accuracy of 100% predicting 308 students correctly. In RapidMiner the best algorithm methodology was Naïve Bayes with an accuracy of 82.9% correctly predicting 73 students. Thereafter, Orange gave the best algorithm methodology to be Random Forest at 98.7333% predicting 304 students accurately. Our study shows that the optimum algorithm suited for the application software implementation to allocate SS1 Students into Department was Random Forest, having highest rates in the Accuracy. Though Orange has additional feature of being able to visualize the output of all the three results in one interface at a glance, and also shows outcome visualizations in various plots and graphs, WEKA’s highest predictive measure of 100% places it above all and makes it the tool of choice with Random Forest being the best algorithm.
References
[1] A. Al-Amin, S. A. Khan, A. Rizwan, and M. I. Khan (2019). Predicting Student Academic Performance Using Data Mining Techniques. International Journal of Educational Management (IJEM), Volume 33, Issue 2 [2] A.Jamil, S. A. Khan, A. Rizwan, and M. I. Khan (2018). Educational Data Mining for Predicting Student Academic Performance. International Journal of Educational Management (IJEM). Volume 33, issue 2 [3] Anjali Singh, Deepak Mishra, and Suman Kumar (2022). A Hybrid Approach for Predicting Student Performance Using Data Mining Techniques. International Journal of Information Technology and Computer Science (IJITCS). Volume 14 issue 1. [4] Deepak Mishra, Ankit Kumar Singh, and Suman Kumar (2019). Using RapidMiner to Predict Student Academic Performance. International Journal of Information Technology and Computer Science (IJITCS). Volume 13, issue 1 [5] Hussain, S., Dahan, N. A., Ba-Alwib, F. M., & Ribata, N. (2018). Educational data mining and analysis of students’ academic performance using weka. Indonesian Journal of Electrical Engineering and Computer Science, 9(2), 447–459 [6] Jovel, T. R, Angelica P. P., & Corazon B. R. (2019). Educational Data Mining for Predicting Performance Improvement Using Classification Method. World Symposium on Smart Materials and Applications (WSSMA 2019). IOP Conf. Series: Materials Science and Engineering 649 (2019) 012018 IOP Publishing doi:10.1088/1757-899X/649/1/012018 [7] Kapur, B., Ahluwalia, N. & Sathyaraj, R. (2017). Comparative study on marks prediction using data mining and classification algorithms. International Journal of Advanced Research in Computer Science, 8(3). [8] Kaur, P., Singh, M., & Josan G. S. (2015). Classification and Prediction Based Data Mining Algorithms to Predict Slow Learners in Education Sector. Procedia Computer Science, 57, 500–508. [9] Mohamed El-Halees, Ahmed M. Abd-Elwahed, Ahmed A. Yousef, and Amany N. El-Sherif (2021). Predicting Student Academic Performance Using Orange: A Case Study. International Journal of Educational Technology and Research (IJETR). Volume 10, isuue 1 [10] Musso, M. F., Hernández, C. F. R., & Cascallar, E. C. (2020). Predicting key educational outcomes in academic trajectories: A machine-learning approach. Higher Education, 80(5), 875–894. https://doi.org/10.1007/s10734-020-00520-7 [11] Raza Hasan & Sellappan Palaniappan & Salman Mahmood & Kamal Uddin Sarker & Ali Abbas, 2020. \"Modelling and predicting student\'s academic performance using classification data mining techniques,\" International Journal of Business Information Systems, Inderscience Enterprises Ltd, vol. 34(3), pages 403-422.
Copyright
Copyright © 2023 Akinsola Adeniyi F., Sokunbi. Michael. A, Onadokun I. O, Okenwa-Martins C. Q. This is an open access article distributed under the Creative Commons Attribution License, which permits unrestricted use, distribution, and reproduction in any medium, provided the original work is properly cited.

Download Paper
Paper Id : IJRASET55054
Publish Date : 2023-07-27
ISSN : 2321-9653
Publisher Name : IJRASET
DOI Link : Click Here
 Submit Paper Online

