Ijraset Journal For Research in Applied Science and Engineering Technology
- Home / Ijraset
- On This Page
- Abstract
- Introduction
- Conclusion
- References
- Copyright
Comparative Study of Mechanical Properties of Self Compacting Concrete Using Binary Pozzolanic Materials
Authors: Nitin Kumar Shukla, Dr. Ayush Mittal, Mr. Devi Charan Dubey, Ashwini Tiwari
DOI Link: https://doi.org/10.22214/ijraset.2024.64261
Certificate: View Certificate
Abstract
The study examined the viability of using waste supplementary cementing materials (SCMs), such as fly ash (FA) and silica fume (SF), as partial replacement of Ordinary Portland cement. The way SCC\'s fresh properties and hardened were impacted by FA and SF. The study examined the fresh characteristics and hardened characteristics of various distinct SCC mixes using SCC with partial replacement of Ordinary Portland Cement with FA (class F) and SF. First, the cement was replaced by percentages in the mixes 0%, 10%, 15%, 20%, 25%, and 30% by FA and constant replacement of 10% by SF. Then cement was replaced by percentages in the mix with 25% FA constant and 4%, 6%, 8%, 10%, and 12% by SF. For every combination, the water/binder (w/b) ratio was set at 0.43. The EFNARC (Specification and Guidelines for Self-Compacting Concrete) standards were met by the slump flow, T50, and viscosity of the SCC. After 28 days of curing, the blend consisting of 65% PC, 25% FA, and 10% SF had a maximum compressive strength of 41.22 MPa which is 12.07% greater than the compressive strength of the control specimen which is 36.78 MPa. The Split Tensile Strength of the same blend is 4.37% is greater than the control specimen. Non-destructive tests were also performed after 28 days of curing and the regression equations give the excellent relationship between Rebound Number, Ultrasonic Pulse Velocity, and Compressive Strength. This is due to the formation of the proper matrix as the particle size of SF and FA is less than that of cement and the free lime of cement reacts with FA and SF to form C-S-H gel which provides strength.
Introduction
I. INTRODUCTION
Self-compacting concrete (SCC), has been increasingly popular in recent years as a solution for packed reinforced- concrete buildings with challenging casting circumstances. SCC is simply a type of concrete that, when placed, can flow into the formwork without any separation and fill every corner thoroughly and evenly using only its own weight no vibration or other energy is applied during this process. The term SCC was initially used in the late 1980s by Okamura, a Japanese researcher [[1]]. The necessity for more efficient and superior fresh concrete placing, the endangering durability of reinforced concrete structures, and the shortage of competent labour were the primary driving forces for the development of SCC and its research. Bertil Persson (2001) [[2]] conducted an experimental and numerical study comparing the mechanical properties of self-compacting concrete (SCC) to those of normal compacting concrete (NCC). The study found no significant differences between the mechanical properties of SCC and NCC, including strength, elastic modulus, creep, and shrinkage.
The number of coal-fired power stations is increasing in India due to the growing worldwide need for energy. However, the byproducts from the production of energy provide serious technical, environmental, and financial issues for these plants. Fly ash and bottom ash are the two main types of combustion residuals produced during the coal-based power production process. By using these waste materials in the construction industry, power plant's technical and environmental problems are lessened. Fly ash production in India is estimated to be 18 million tons per year, which is more than the total production of all other industrial by-products in the country. Only 4 percent of the fly ash accessible worldwide is now being used in India for this purpose, even though fly ash is an important mineral supplement for blended Portland cement and concrete. However, the rate at which fly ash is being adopted is rising year over year.[[3]]
The terms micro silica, condensed silica fume, and silica fume are commonly utilized to refer to by-products obtained from the emission gases of ferrosilicon, silicon, and other metal alloy smelting furnaces. However, silica fume and micro silica specifically denote high-quality condensed silica fumes suitable for application in the cement and concrete sector. The European standard employs the term silica fume.
In accordance with ASTM C 1240 or AASHTO M 307, silica fume can be used as a material for further cementations to boost durability and strength [[4]]. As stated by the Florida Department of Transportation (2004), between 7% and 9% of the mass of the cementation materials should be replaced with silica fume instead of cement. the particles in silica fume are so much smaller than those in cement, they have a specific surface area that is around six times greater than that of cement. As a result, it has been shown that the tiny pore holes in concrete lower when silica fume mixes with it. Because silica fume is reactive, like volcanic ash, it is pozzolanic. The effects of it are associated with the following: shrinkage, permeability, chemical attack resistance, alkali-silica reactivity reduction, creep rate, corrosion resistance of embedded steel reinforcement, freeze-thaw durability, coefficient of thermal expansion (CTE), specific heat, defect dynamics, thermal conductivity, dielectric constant, and degree of fiber dispersion in mixes containing short microfibers.[5]
An experimental study was conducted by Chockalingam, M. (2014) [6] to assess self-compacting concrete, which compacts due to its own weight. Various amounts of silica fume (SF) and marble powder (MP) are introduced in this experimental effort. Trials are conducted to determine whether silica fume (0%, 15%, 20%, 25%, 30%) and marble powder (15%) can effectively substitute cement. The findings indicate that the characteristics of SCC can be enhanced by replacing 15% to 20% of the cement with silica fume and 15% marble powder.
According to Güneyisi et al. [7], adding mineral admixtures greatly improved the compressive strength and permeability properties when compared to the NC.
According to Klug et al. [8], the modulus of elasticity of NC is higher than that of SCC, but the compressive strength of both forms of concrete is the same for the same w/b ratio and the split tensile strength of SCC is superior to that of NC. At 28 days, SCC's compressive strength is at least 10% greater than NCC at the same w/b ratio.
As per the findings of Gaywala et al. [9], the highest compressive strength, split tensile strength, flexural strength, and pull-out strength of SCC were obtained when 15% of FA was added to the mixture. While it reduces with an extended cure period, the water absorption in SCC rises as FA increases.
It has been previously established by Yahia et al [10], in comparison to concrete made solely of Portland cement, the use of mineral admixtures, such as fly ash and blast furnace slag, can increase the slump of the concrete mixture without raising its cost and decrease the dosage of superplasticizer required to achieve a similar slump flow.
A high-volume FA component enhances compressive strength over the length of 28 to 120 days of curing, according to Askari et al [11] examination of the mechanical properties of SCC. This suggests that FA's pozzolanic action is persistent over time. A 10% SF cement replacement also maintains and improves the tensile strength of SCC with high-volume FA. Also determined that because high-volume FA particles have a rounded form, less superplasticizer (SP) is needed to obtain the desired level of self-compaction. Yazici et al [12] evaluated the mechanical and durability characteristics of SCC mixes with a 10% SF addition and a fixed w/b ratio of 0.28 by substituting class C FA for cement from 30% to 60%. He discovered that adding 10% square foot to the concrete improves its fresh and hardened qualities. The qualities of the component materials also have an impact on the compactivity of SCC. Thus, it is necessary to look into how the concrete develops strength when a large volume of cement is changed.
The study performed by Dipthi et al [13] concluded that the SCC containing 30% FA displays the highest levels of mechanical strength, while SCC incorporating 10% SF exhibits exceptional performance. In general, the study underscores the advantages of utilizing SCC instead of Normal Vibrated Concrete (NVC) in various construction scenarios.
In this study, the cement (OPC 43 grade) was partially replaced with mineral admixtures such as silica fume and fly ash. The incorporation of mineral admixture results in the properly bonded matrix which is due to lesser particle sizes of the FA and SF than the particle of the cement and the free lime of cement makes C-S-H gel by reacting with fly ash and silica fume which may result into greater strength. By employing self-compacting concrete, the cost of chemical and mineral admixtures is compensated by the elimination of compaction and work done to level the surface of normal concrete. Sunanda Polytancrete NGT is used as a superplasticizer. It makes water free which is entrapped in between the molecules of the cement. Finding the ideal fly ash and silica fume ratios for Self-Compacting Concrete (SCC) to maximize compressive strength is the main goal of this study. The study also aims to explore how different curing conditions affect the development of the concrete's strength.
II. MATERIAL AND PROPERTIES
- Cement: Ordinary Portland Cement, also known as OPC, Grade 43 was used in this investigation. It complies with IS: 8112-1989 [14] requirements. According to the guidelines, a number of laboratory tests were carried out in compliance with IS: 4031-1996 (Parts 1a to 15) [15]. The physical properties of cement are given in Table-1.
- Fly Ash: - One byproduct that is produced in electric power-producing plants when pulverized coal is burned is called fly ash. Table 3 displays the chemical parameters of the fly ash that was utilized as a partial addition to cement, originating from the National Thermal Power Plant Tanda.
- Silica Fume: -The first evidence of silica fume was found in Norway in 1947 when the environmental controls began to filter the furnace exhaust gases. The majority of these emissions contained a finely divided silicon dioxide content. Numerous investigations have been conducted on silicon dioxide because of its well-known pozzolanic reactivity [16]. The crystalline silica produced as a by-product of ferrosilicon alloys or metallic silicon is extremely fine and is produced in electric arc furnaces. Woodchips, quartz, and coal are the raw materials [17]. The various properties of silica fume are given in Table -3.
- Super Plasticizer: High-range water reducers, or superplasticizers, are additives used in the production of high-strength concrete. Chemical substances known as plasticizers allow concrete to be produced with about 15% less water. Superplasticizers provide a water content reduction of at least 30%. Our concrete admixture of choice was Sunanda Polytancrete NGT super plasticizing. It needs to be mixed into the measuring water inside the mortar or concrete. It will boost all positive attributes and enhance many homes, including workability, finished appearance, and finishability.
- Aggregates: Angular aggregates with rough surfaces that meet IS: 383-2016 standards and have a nominal size of 20 mm are used as coarse aggregate in this inquiry. In self-compacting concrete, aggregates make up only 50% of the overall volume, whereas in conventional concrete, coarse aggregates make up 70%–80% of the volume. Because we use fine aggregate is used in higher proportions. As fine aggregate, river sand was utilized, adhering to IS: 383-1970 and grading zone II. To get rid of any particles larger than 4.75 mm, the sand was forced to pass through a 4.75mm screen [18].
Table-1 (Physical Properties of Cement)
|
S. No |
Property |
Result |
|
|
Fineness |
8% |
|
|
Normal Consistency |
32% |
|
|
Initial Setting Time |
35min |
|
|
Final Setting Time |
480min |
|
|
Specific Gravity |
3.12 |
|
|
Compressive Strength of Cement at 28 days |
42.6 MPa |
Table-2 (Properties of Super Plasticizer)
|
S. No |
Properties of Super Plasticizer |
Result |
|
1. |
Specific Gravity |
2.13 |
|
2. |
Density |
1.2kg/l |
|
3. |
Colour |
Brown |
|
4. |
Air Entrainment |
1%(Nearly) |
Table-3 (Composition of OPC, FA, and SF)
|
Component |
Cement |
Fly Ash |
Silica Fume |
|
SiO2 |
16.2 |
58.35 |
96 |
|
Al2O3 |
3.52 |
24.36 |
0.1 |
|
Fe2O3 |
2.91 |
7.34 |
0.6 |
|
CaO |
70.9 |
5.92 |
0.1 |
|
MgO |
0.764 |
1.01 |
0.2 |
|
SO3 |
3.36 |
0.4 |
1.1 |
|
K2O |
0.572 |
3.76 |
0.4 |
|
Na2O |
0.3 |
0.26 |
0.1 |
III. EXPERIMENTAL PROGRAM
A. Slump Test
We used a truncated slump cone with an internal diameter of 200mm at the base, 100mm at the top, and 300mm in height. The slump flow test was a basic, quick test in which the slump cone was greased and set on a level surface. The cone was filled with 6 liters of concrete without manual compacting. The top was smoothed with a trowel. The cone was elevated vertically, allowing the concrete to flow freely. The flow diameter of self-compacting concrete was observed.
B. Compressive Strength Test
The 150 mm x 150 mm x 150 mm test specimens were cast. Compression tests were carried out at the test specimen's recognized ages, which were typically 7 and 28 days. For testing purposes, at least three specimens ideally from separate batches were created for each age range. Following casting, specimens were left in the mould for around a day before being taken out and placed in water to cure. The cubes were taken out of the water once they reached the chosen age, allowed to dry, and then tested. The cube was fed into the machine to ensure that, the load was transferred to its opposing sides when it was cast. The specimen was subjected to a continuous load application rate of nearly 140 kg/cm²/min until it broke. The highest load that was applied to the specimen until it broke was noted. The concrete's compressive strength was measured in tons and expressed as N/mm².
The Compressive Strength of the concrete cube = Maximum load / Area of concrete
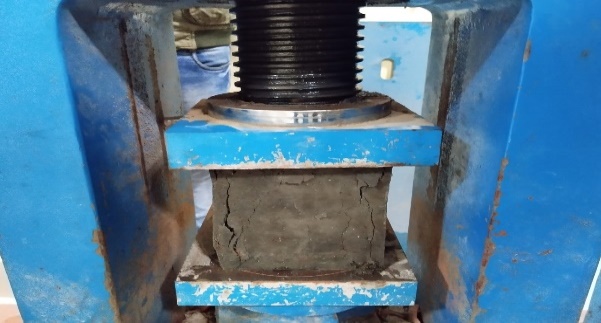
Figure- 1 (Compressive Strength)
C. Split Tensile Strength Test
The cylindrical specimens, measuring 300 mm in length and 150 mm in diameter, had been formed. The test was administered at certain ages, typically 7 and 28 days. After a day, the specimens were taken out of the mould and put in water to cure. Before testing, the specimens were taken out of the water after a certain age. A piece of plywood was positioned in the middle of the testing machine's lower plate. The specimen was positioned with its axis perpendicular to the direction of loading, horizontally, on the plywood strip. Next, the second plywood strip was positioned lengthwise in the centre of the cylinder. Then, until failure, the load was applied at a rate that produced a splitting tensile stress of nearly 14 to 21 kg/cm2/min. The highest load that was placed on the specimen was expressed in N/mm2. The split tensile strength is given by the equation,
F = 3P/ (πDL)
Where,
F = Split Tensile Strength of Concrete
P = Load at failure
L = Length of the cylindrical specimen
D = Diameter of the cylindrical specimen
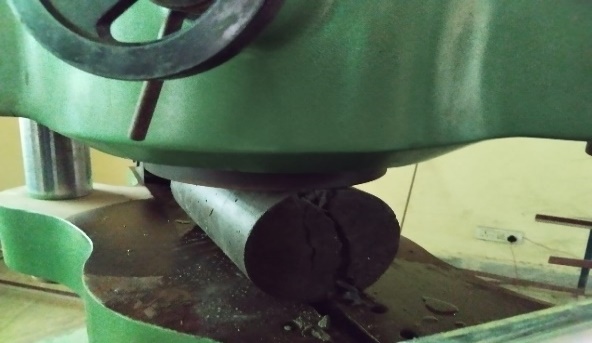
Figure- 2(Split Tensile Test)
D. Flexural Strength Test
The flexural tension test, sometimes called the flexural strength test, determines the extent to which an unreinforced slab of concrete or beam is able to resist bending. It is an indirect method of figuring out how much stress concrete can bear before breaking or its tensile strength. Concrete's flexural strength is measured in megapascals (MPa) or pounds per square inch (psi). In this test, a beam specimen of 150 mm x 150 mm x 700 mm is constructed and subjected to a uniform bending load of 0.7N/mm²/min on the Universal Testing Machine (UTM).
The Flexural Strength of Concrete is given by the equation
F= PL/ (bd²)
Where,
F= Flexural Strength of Concrete
P= Maximum Load
L= Effective span of the beam
b= Breadth of the beam
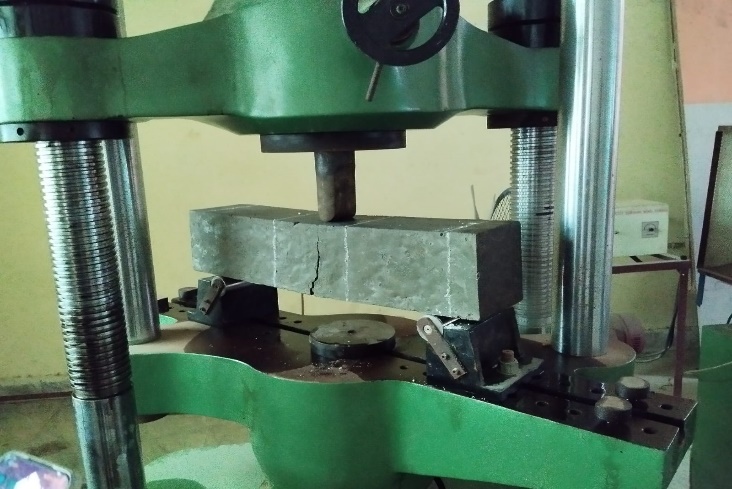
Figure- 3(Flexural Strength Test)
E. Schmidt Rebound Hammer Test
The Schmidt Rebound Hammer is principally a surface hardness tester. It works on the principle that the rebound of an elastic mass depends on the hardness of the surface against which the mass impinges. There is little apparent theoretical relationship between the strength of concrete and the rebound number RN of the hammer. In this test, a spring-loaded hammer is used to strike the surface of the concrete, and the rebound distance of the hammer upon impact is measured. This rebound distance is then correlated with the compressive strength of the concrete, providing valuable insights into its overall quality. To conduct the rebound hammer test, several steps are followed meticulously. First, the concrete surface must be thoroughly cleaned and free from any loose materials or coatings that could interfere with the accuracy of the test. The rebound hammer is then calibrated according to the manufacturer's guidelines to ensure precise and consistent results. The rebound values obtained from these tests are averaged and compared to a conversion chart provided by the manufacturer or relevant standards to estimate the compressive strength of the concrete.
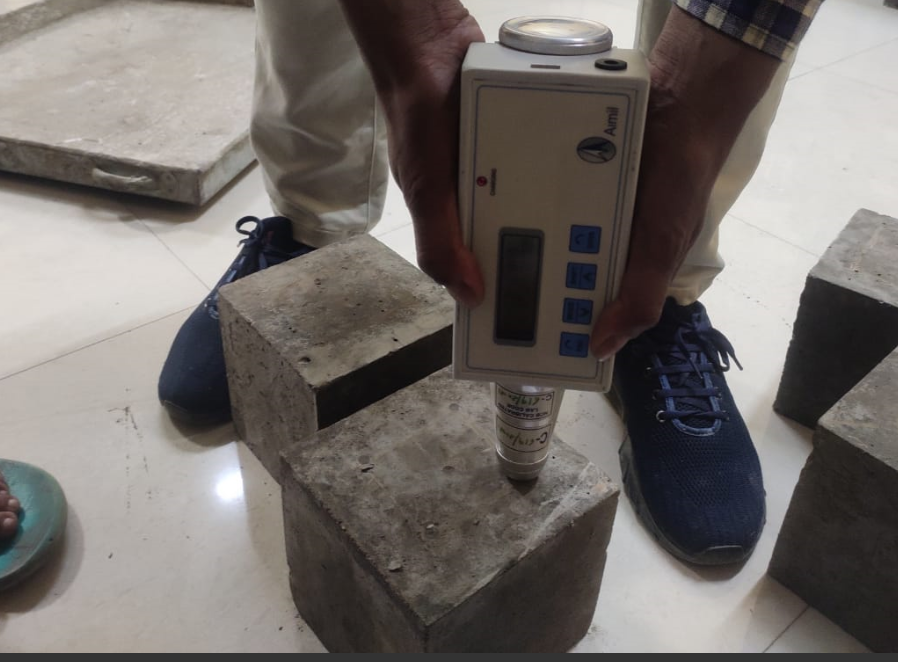
Figure- 4(Rebound Hammer Test)
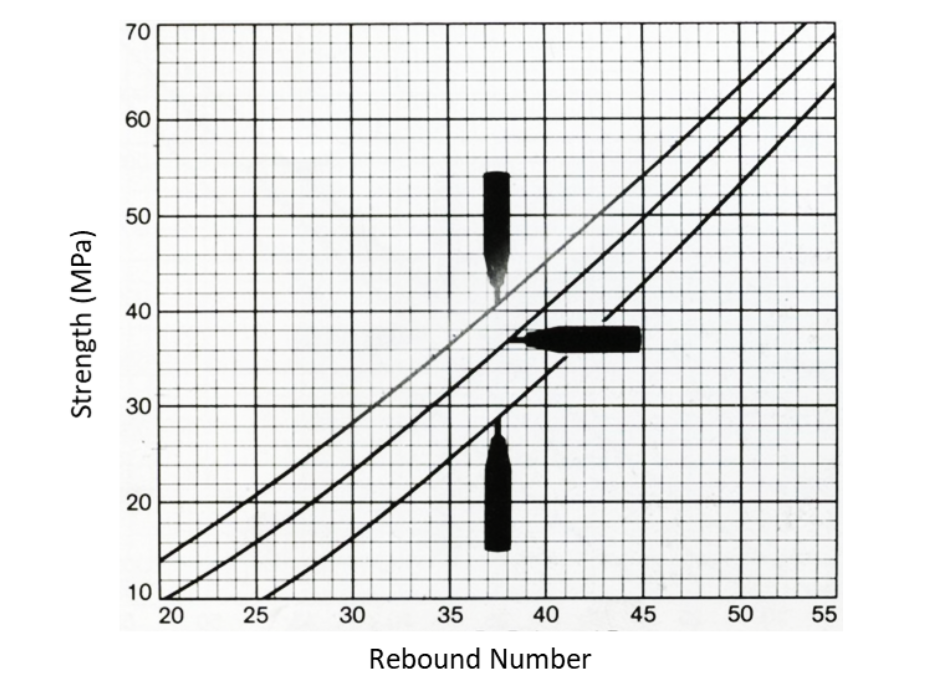
Figure- 5(Rebound No. and Strength Relation graph)
F. Ultra Sonic Pulse Velocity Test
The ultrasonic pulse velocity (UPV) test is a non-destructive technique employed to assess the integrity and quality of concrete. It functions by measuring the speed (v) of sound waves traveling through the material. This velocity is directly related to the concrete's density (ρ) and elastic modulus (E) via the following equation:
v = √(E/ρ)
Higher UPV readings indicate denser, more uniform concrete with a greater elastic modulus, signifying superior quality. Conversely, lower velocities suggest potential defects like cracks, voids, or honeycombing that reduce the material's integrity. Using a transducer, an ultrasonic pulse (usually at frequencies between 40 kHz and 50 kHz) is sent through the concrete to perform the UPV test. The pulse's transit time (t) between the transmitter and receiver transducers is measured, after which it reaches a predetermined distance (L). The following formula is used to get the Ultrasonic Pulse Velocity (UPV) (v):
v = L/t
Where,
L= Length Travelled by the wave
t = Time taken by the wave to travel

Figure- 6(Ultrasonic Pulse Velocity Test)
G. Mix Proportioning
When mixing self-compacting concrete, IS 10262-2019 [19] is utilized for mix proportioning. To investigate the impact of fly ash and silica fume on the strength parameters of SCC, a total 11 proportion mixes of M30 grade concrete were prepared where one mix was of NVC, five mixes were prepared replacing Portland Cement by FA and SF with proportions 20%, 25%, 30%, 35% and 40% where amount of SF was taken constant as 10%. Another five mixes were prepared by replacing Portland Cement by FA and SF with proportions 29%, 31%, 33%, 35%, and 37% where FA was taken 25% constant. For every combination, the ratio of water to powder was kept constant at 0.43. Further, the proportion of superplasticizer is 1.5% of the cement's weight. Table 6 provides the mix proportioning for each of the eleven trial mixes.
Table- 4 (Mix Proportioning)
|
Mix No. |
Cement (Kg/m³) |
Fly Ash (Kg/m³) |
Silica Fume (Kg/m³) |
Coarse Aggregate (Kg/m³) |
Fine Aggregate (Kg/m³) |
Water (Ltr.) |
%Chemical Admixture |
|
1. |
439 |
0 |
0 |
1139 |
669 |
189 |
0.0% |
|
2. |
354 |
44 |
44 |
752 |
975 |
190 |
1.5% |
|
3. |
332 |
66 |
44 |
743 |
975 |
190 |
1.5% |
|
4. |
310 |
88 |
44 |
735 |
975 |
190 |
1.5% |
|
5. |
287 |
110 |
44 |
727 |
975 |
190 |
1.5% |
|
6. |
265 |
133 |
44 |
718 |
975 |
190 |
1.5% |
|
7.
|
314 |
110 |
17 |
737 |
975 |
190 |
1.5% |
|
8.
|
305 |
110 |
26 |
734 |
975 |
190 |
1.5% |
|
9. |
296 |
110 |
35 |
732 |
975 |
190 |
1.5% |
|
10. |
287 |
110 |
44 |
727 |
975 |
190 |
1.5% |
|
11. |
278 |
110 |
53 |
726 |
975 |
190 |
1.5% |
IV. RESULTS AND DISCUSSION
In this work, several mixes of fly ash and silica fume were used to examine the hardened and fresh qualities of self-compacting concrete and we have also performed some non-destructive tests the results of all these tests are discussed below.
A. Slump Flow Test Results
The slump flow test was performed and the results are given in the Figure-7&8. We found that the slump flow dia increases as the amount of replacement of FA increases and SF is constant. It is clear from the graph that spread diameter increases as fly ash % increases, showing that fly ash decreases the viscosity of the SCC mixes and promotes segregation, Bouzoubaa and Lachemi (2001) have also reported the same findings [20]. The same results are also obtained by Puthipad et al [21] and the reason was given that the ball bearing effect which helps lubricate concrete while it's still plastic, which enhances workability and finishing, lessens bleed-through and segregation, and makes pumping SCC easier. The slump flow dia decreases as the amount of replacement of SF increases and FA is taken constant. This is because as the amount of silica fume increases the specific surface area increases which requires more amount of water thus slump flow dia decreases. The same findings were also reported by Kumar Satish et al [22].
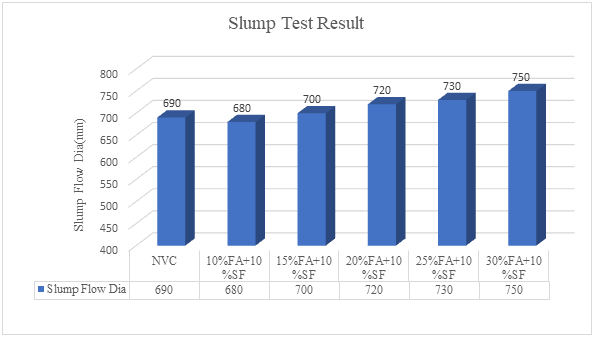
Figure- 7 ( Slump Dia when SF is constant)
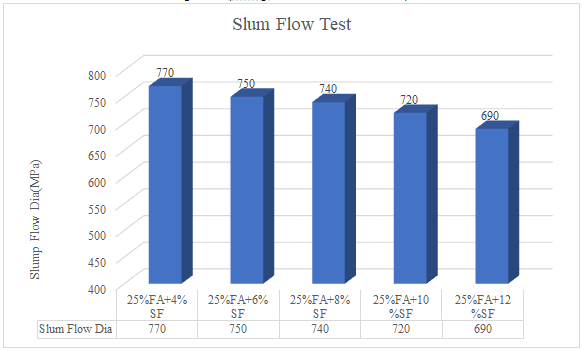
Figure-8 ( Slump Flow Dia when FA is constant)
B. Compressive Strength Test Results
The result of the compressive strength test performed on different mixes at 7 days, 28 days, and 90 days are shown in the Figure-9&10. In the result we can observe at 7 days of curing the NVC has a compressive strength of 24.24 MPa. When we replace the cement with SF and FA the 7 days strength with replacement of 10% FA+ 10% SF is 19.45 MPa which is less than the 7 days compressive strength of NVC with an increase in the percentage of supplementary cementing material with replacement of 25% FA+10% SF has the compressive strength of 23.8 MPa which is highest among the SCC mixes but lower than NVC. At 28 days the SCC mix with 25% FA+10% SF has the highest strength of 41.22 MPa which is 12.07% greater than the reference mix (NVC) after this proportion decrease in strength is observed. Also, after 90 days the compressive strength was highest for the same proportion, but the strength of that blend was 10.83% higher than the reference mix. When the FA was taken constant, the compressive strength increases as the percentage of SF increases, after 28 days the highest compressive strength of 40.92MPa was found for the cement blend 25%FA+10%SF which is 11.25% greater than the reference mix, also after 90 days the compressive strength was obtained maximum for the same cement blend. Ultimately, after 28 days, there was an overall rise in the compressive strength values of SCC specimens with increases in both FA and SF content. The pozzolanic action's densification of the paste structure is responsible for this strength gain.[23]
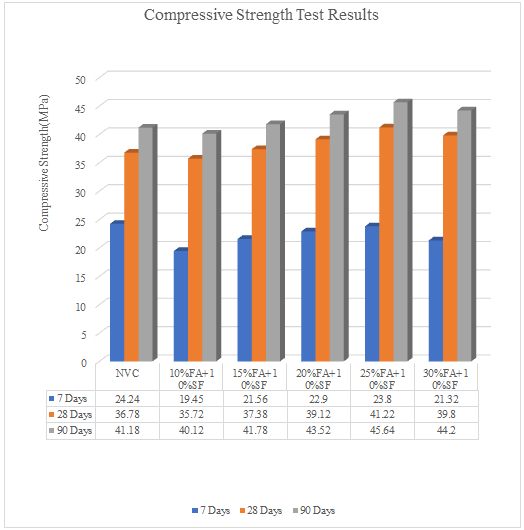
Figure- 9(Compressive Strength when SF is constant)
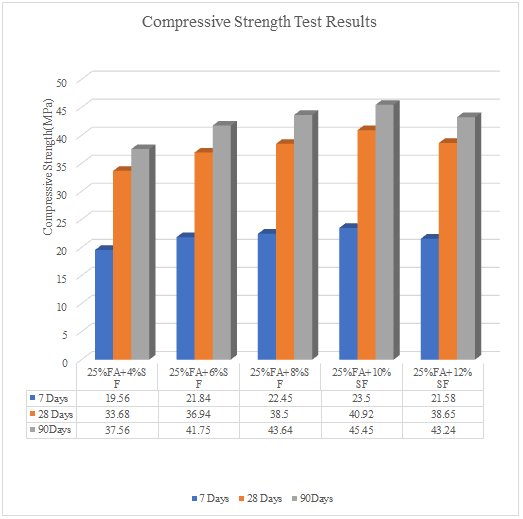
Figure- 10(Compressive Strength when FA is constant)
C. Split Tensile Strength Test
Split Tensile Strength Test results are shown in the given graph and the observations are made. At 7 days of curing the split tensile strength of NVC is 2.26 MPa which is higher than SCC mixes. At 7 days in SSC mixes the split tensile strength of proportion with 25% FA+10% SF has the highest strength with 2.33 MPa. At 28 days the blend with 25%FA+10%SF highest strength of 3.85 MPa was observed which is 5.91% greater than the NVC or reference mix. Also, after 90 days the split tensile strength of 3.08MPa for the same cement blend is highest among all proportions which is 8.07% higher than the reference mix. When FA is taken 25% constant as a replacement of cement the split tensile strength increases as the amount of SF replacement increases from 4% to 10%. At 7 days of curing the split tensile strength of all the cement blends is lower than the reference mix. At 28 days and 90 days of curing ages the split tensile strength is highest for the proportion 25%FA+10%SF which is 5.97% and 5.61% greater than reference mix at 28 days and 90 days of curing respectively. These might be accounted by the C-S-H gel forming pozzolanic reaction. However, it is clear that when FA and SF concentration are increased up to a certain limit, compressive strength increases more than tensile strength. This might be explained by the impact of the unreacted FA/SF particles on the tensile characteristics, as the splitting tensile test will have greater influence on the binding between the aggregate and the blended past.[24]
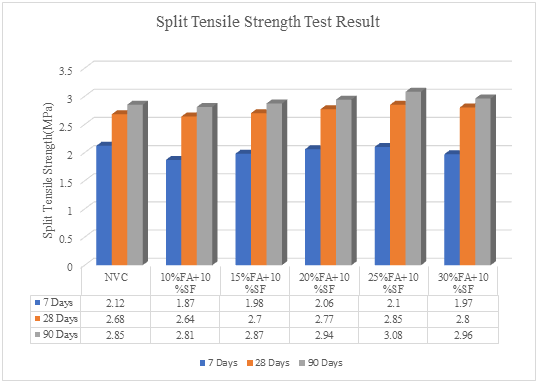
Figure- 11(Split Tensile Strength when SF is constant)
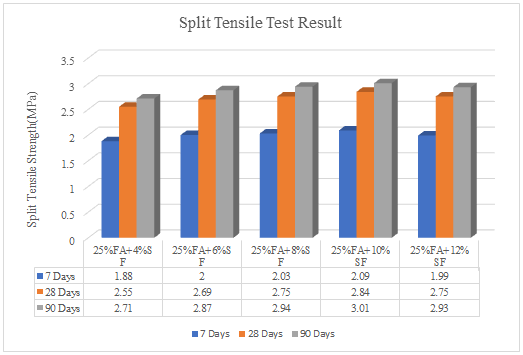
Figure- 12(Split Tensile Strength when FA is constant)
D. Flexural Strength Test
The results of the flexural strength test are shown in Figure-13&14 and we have observed that at 7 days NVC has the highest flexural strength of 3.15 MPa than all proportion mixes of SCC. At 28 days the strength of NVC is 4.01 MPa while the strength of SCC mixes increases as the amount of fly ash increases and the highest flexural strength of 4.32 was observed for the blend 25%FA+10%SF which is 7.73% greater than the reference mix. Also, after 90 days the flexural strength is highest for the same cement blend. When FA is taken 25% constant as the replacement of cement and the amount of SF increases from 4% - 12% the flexural strength increases as the amount of SF increases up to 10% SF at the curing ages 28 days and 90 days. The flexural strength observed for cement blend 25%FA+10%SF is 7.48% and 5.55% higher than the reference mix at the curing ages 28 days and 90 days respectively. The same trend of result is obtained by Dehwah et al. [25]
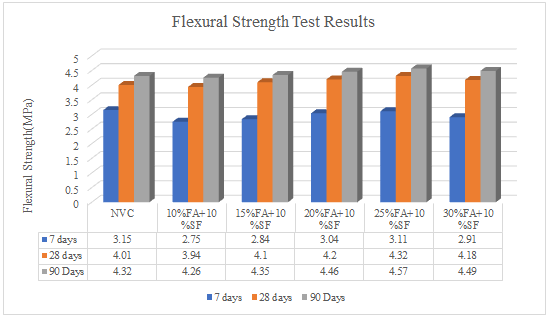
Figure- 13(Flexural Strength Test when SF is constant)
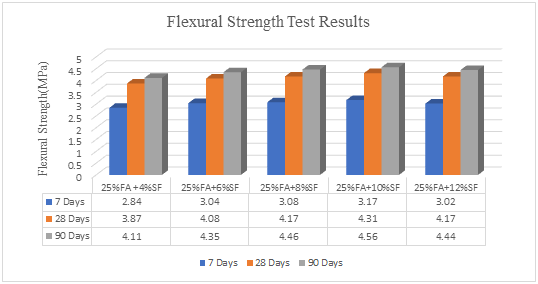
Figure- 14(Flexural Strength Test when FA is constant)
E. Ultrasonic Pulse Velocity Test
Table- shows the results obtained of Ultrasonic Pulse Velocity test performed after 28 days of curing and we observed that the value UPV increases as the replacement of FA and SF increases. It is because utilizing FA and SF simultaneously has a cumulative impact.
Concrete performs better overall thanks to the combination of the pozzolanic reaction from fly ash and densification from silica fume, which raises the UPV values [26]. In Figure-15 the relationship between compressive strength and UPV has been made and the equation of co-relation is as fck = 0.0314e1.5742V and the coefficient of regression was found as R2 = 0.995. The correlation equation and regression coefficient obtained in this study is almost equal to the parameters given in earlier studies given by Djamila (2018) et al [27].
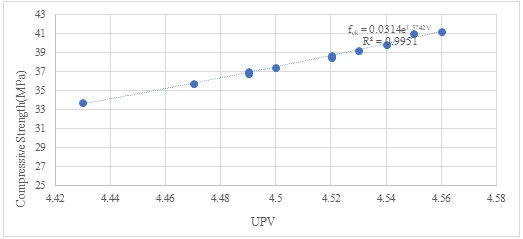
Figure- 15 (Relationship graph between UPV and Compressive Strength)
F. Rebound Hammer Test
Table- displays the findings of rebound hammer tests that were performed on each SCC mix. Table- displays an average of ten readings per specimen that were acquired after the objects' uneven surfaces were smoothed. The rebound number at 28 days of curing increases as the amount of fly ash increases when silica fume was constant. Also, when fly ash is taken constant and silica fume increases the rebound number increases. The highest rebound number was found for replacement level of 25%FA+10%SF. This is due to the microstructure becomes denser and more compact, improving strength and elasticity and raising rebound numbers as the amount of pozzolanic material was raised [28]. In Figure-16 the corelation graph between compressive strength and rebound number is established in which we have found the R² value 0.9704. Almost same trend of result and the R² value was obtained earlier by Navdeep Singh et al [29].
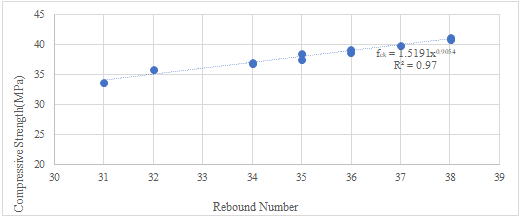
Figure- 16(Relationship graph between Rebound No. and Compressive Strength)
G. Relationship Between Mechanical Properties
After 28 days of curing the relationship between the compressive strength, split tensile strength and flexural strength was established and following results were obtained.
H. Relationship Between Compressive Strength and Split Tensile Strength
The relationship was established between compressive strength and split tensile strength which is shown in Figure-17 . The equation that corelate compressive strength and split tensile strength is fsp = 0.3723fck0.5474 and the value of regression coefficient is obtained as R2=0.999 nearly the same type of result was found earlier by Dinakar et al [30].
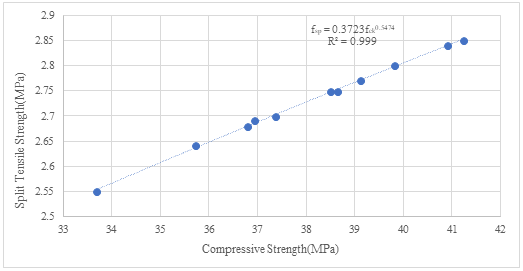
Figure- 17(Relationship graph of compressive strength and split tensile strength)
1) Relationship Between Compressive Strength and Flexural Strength
The relation between compressive strength and flexural strength has been made and the equation which corelates these is fr = 0.5297fck0.5639. The regression coefficient is found as R2 = 0.963. The co-relation equation between compressive strength and flexural strength established here is near to relation given by the IS 456:2000 (Indian Standard Code for Plain and reinforced concrete-code of practice) and the coefficient of regression is also nearly same to the coefficient given by the Hardjasaputra et al [31].
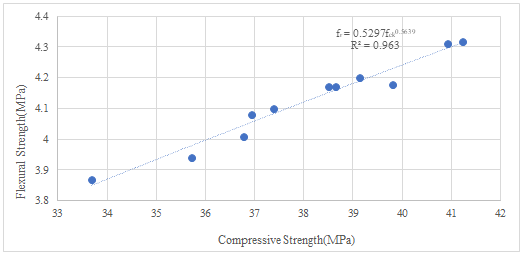
Figure- 18(Relationship graph of compressive and flexural strength)
2) Relationship Between Split Tensile Strength and Flexural Strength
The relation has been established between Split Tensile Strength and Flexural Strength in Figure-19 the equation of relation was found as fr = 0.7286fsp0.9323. The coefficient of regression was found as R2 = 0.9575. These two results are almost same the relationship earlier given by Smarzewski et al [32].
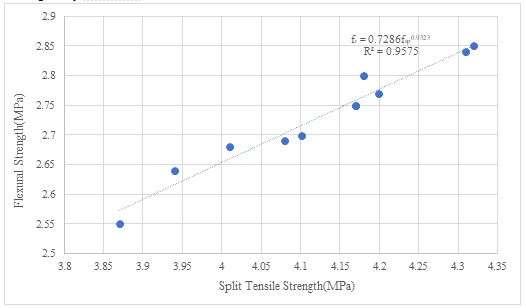
Figure- 19(Relationship of split tensile and flexural strength)
Conclusion
Based on an experimental investigation using mineral admixtures FA and SF on SCC of M30 grade, the following findings were drawn. 1) Spread diameter rises as fly ash percentage increases and silica fume percentage is constant, suggesting that fly ash reduces the SCC mixes viscosity. When silica fume percentage increases the and fly ash percentage is constant spread diameter decreases. 2) After 7 days of curing all the strength parameters like compressive strength, split tensile strength and flexural strength of SCC is lower than the reference mix at all the replacement level of cement by FA and SF. 3) After 28 days of curing the sample made with 25%FA+10%SF has the highest compressive strength with 41.22 MPa which is 12.07% higher than the reference mix. Also, for the same cement blend split tensile strength is 5.91% and Flexural strength is 7.73% greater than the reference mix. 4) As the sample of SCC made with replacement level of 25%FA+10%SF has the highest strength viz, compressive strength, split tensile strength and flexural strength thus it can be the optimum percentage for replacement. 5) Acceptable relationship has been obtained between the strength parameters. 6) The result of co-relationship between compressive strength and NDT test readings (UPV and Rebound Number) showed a good relationship.
References
[1] K. Ozawa, K. Maekawa, M. Kunishima, H. Okamura, Performance of concrete based on the durability design of concrete structures, Proc. of the Second East Asia-Pacific Conference on Structural Engineering and Construction, 1989 [2] Persson, B. (2001). A comparison between the mechanical properties of self-compacting concrete and the corresponding properties of normal concrete. Cement and concrete Research, 31(2), 193-198. [3] Yaz?c?, Halit. \"The effect of silica fume and high-volume Class C fly ash on mechanical properties, chloride penetration and freeze–thaw resistance of self-compacting concrete.\" Construction and building Materials 22.4 (2008): 456-462. [4] S.Bhanja, B.Sengupta (2004), “Influence of silica fume on the tensile strength of concrete. Cement and concrete research” Jadavpur University Kolkata, West Bengal, India. [5] Ali Behnood, Hasan Ziari (2007), “Effect of silica fume addition and water to cement ratio on the properties of high-strength concrete after exposure to high temperature” [6] Chockalingam. M, “Experimental Investigation on Self Compacting Concrete Using Marble Powder And Silica Fume”, International Journal & Magazine Of Engineering [7] üneyisi E, Geso ?glu M, Booya E, Mermerda¸s K (2015) Strength and permeability properties of self-compacting concrete with cold bonded fly ash lightweight aggregate. Constr Build Mater 74:17–24 [8] Klug Y, Holschemacher K, Wallevik O, Nielsson (2003) Comparison of the hardened properties of self-compacting and normal vibrated concrete. Paper presented at 3rd RILEM symposium on self compacting concrete, Reykjavik [9] Gaywala NR, Raijiwala DB (2011) Self compacting concrete: a concrete of next decade. J Eng Res Stud 2(4) [10] A. Yahia, M. Tanimura, A. Shimabukuro, Y. Shimoyama, Effect of rheological parameters on self compactability of concrete containing various mineral admixtures, in: A. Skarendahl, O. Petersson (Eds.), Proceedings of the First RILEM International Symposium on SelfCompacting Concrete, Stockholm, September, 1999, pp. 523 ± 535 [11] A. Askari, M.R. Sohrabi, Y. Rahmani, An investigation into mechanical properties of self compacting concrete incorporating fly ash and silica fume at different ages of curing, Adv. Mater. Res. 261–263 (2011) 3–7. [12] H. Yazici, The effect of silica fume and high-volume Class C fly ash on mechanical properties, chloride penetration and freeze-thaw resistance of selfcompacting concrete, Constr. Build. Mater. 22 (2008) 456–462. [13] Deepthi, Asha, and Gopala Krishna Sastry Deva. \"A Comparative Study on Mechanical Properties of Normal Vibrated Concrete and Self Compacting Concrete.\" International Journal of Civil and Structural Engineering Research, ISSN: 2348-7607. [14] IS: 8112-1989 Specifications for 43 Grade Ordinary Portland cement, Bureau of Indian Standards, New Delhi. [15] IS: 4031-1996 Method of Physical Tests for Hydraulic Cement, Bureau of Indian Standards, New Delhi. [16] Transportation Research Board (2009), “Self-consolidating concrete for precast, prestressed concrete bridge elements”, Technology and Engineering. [17] D.D.L.Chung (2002), “Review improving cement-based materials by using silica fume”, Journal of material science, composite materials research laboratory, state university of New York at Buffalo, USA [18] IS 383 (1970) Specification of Coarse and Fine Aggregates from Natural Sources for Concrete. Bureau of Indian Standards, India. [19] IS: 10262-2019 Indian Standards Recommended Guidelines for Concrete Mix Design, Bureau of Indian Standards, New Delhi. [20] Puthipad, Nipat, Masahiro Ouchi, and Anuwat Attachaiyawuth. \"Effects of fly ash, mixing procedure and type of air-entraining agent on the coalescence of entrained air bubbles in mortar of self-compacting concrete at fresh state.\" Construction and Building Materials 180 (2018): 437-444. [21] Bouzoubaâ, Nabil, and M. Lachemi. \"Self-compacting concrete incorporating high volumes of class F fly ash: Preliminary results.\" Cement and concrete research 31.3 (2001): 413-420. [22] Satish, Kumar, Sanjay Kumar, and Baboo Rai. \"Self compacting concrete using fly ash and silica fumes as pozzolanic material.\" Journal of Engineering Technology (ISSN: 0747-9964) 6.2 (2017): 394-407. [23] Siddique, Rafat, and Jamal M. Khatib. \"Abrasion resistance and mechanical properties of high-volume fly ash concrete.\" Materials and Structures 43 (2010): 709-718. [24] Neville AM. (1995). Properties of concrete. Fourth Edition, Longman Group UK Ltd, p. 660 [25] Dehwah, H. A. F. \"Mechanical properties of self-compacting concrete incorporating quarry dust powder, silica fume or fly ash.\" Construction and Building Materials 26.1 (2012): 547-551. [26] Mendes, Sandro ES, et al. \"Mixture design of concrete using ultrasonic pulse velocity.\" International Journal of Civil Engineering 18 (2020): 113-122. [27] Djamila, Boukhelkhal, and Guendouz Mohamed. \"The use of non-destructive tests to estimate Self-compacting concrete compressive strength.\" MATEC Web of Conferences. Vol. 149. EDP Sciences, 2018. [28] Kosmatka, Steven & Kerkhoff, Beatrix & Panarese, William. (2002). Design and Control of Concrete Mixtures.
Copyright
Copyright © 2024 Nitin Kumar Shukla, Dr. Ayush Mittal, Mr. Devi Charan Dubey, Ashwini Tiwari. This is an open access article distributed under the Creative Commons Attribution License, which permits unrestricted use, distribution, and reproduction in any medium, provided the original work is properly cited.

Download Paper
Paper Id : IJRASET64261
Publish Date : 2024-09-17
ISSN : 2321-9653
Publisher Name : IJRASET
DOI Link : Click Here
 Submit Paper Online

