Ijraset Journal For Research in Applied Science and Engineering Technology
- Home / Ijraset
- On This Page
- Abstract
- Introduction
- Conclusion
- References
- Copyright
Comprehensive Land Use and Land Cover Classification in Chhatrapati Sambhajinagar City, Maharashtra, India, Using Satellite Imagery and Machine Learning Techniques
Authors: Reema A Lahane, Ramesh R Manza
DOI Link: https://doi.org/10.22214/ijraset.2023.57427
Certificate: View Certificate
Abstract
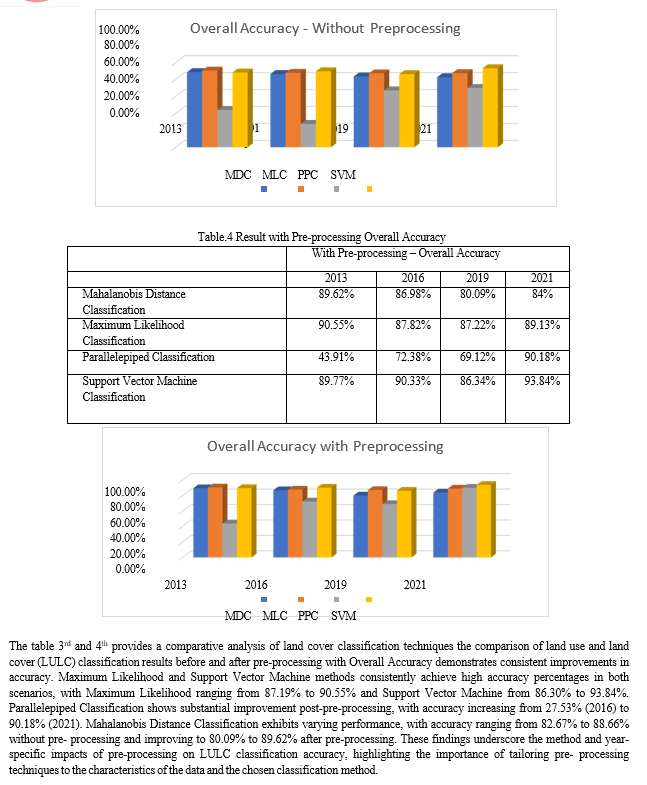
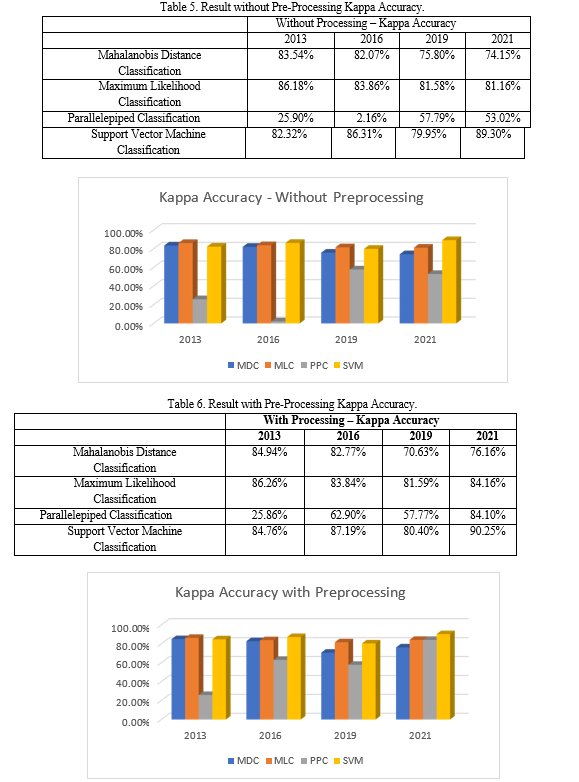
In This research presents an extensive analysis of land use and land cover (LULC) classification in Chhatrapati Sambhajinagar City, a rapidly expanding urban center in Maharashtra, India, highly susceptible to climate change. Using remote sensing and GIS techniques, the research evaluates the impact of LULC on ecosystem service values (ESV) over a nine- year period (2013-2021). Satellite-based data were utilized to quantify LULC changes, encompassing Green Area, Buildup Area, Road Area, Water Bodies, and Barren Land. The research employs five distinct classification methods and investigates the effectiveness of pre-processing techniques in improving classification accuracy during selected years (2013, 2016, 2019, and 2021). The performance of Mahalanobis Distance, Maximum Likelihood, Parallelepiped, and Support Vector Machine methods is assessed under both preprocessed and non-preprocessed conditions, using overall accuracy and Kappa accuracy as evaluation metrics. The results reveal consistent enhancements in overall accuracy, with Mahalanobis Distance, Maximum Likelihood, and Support Vector Machine methods demonstrating percentage improvements ranging from 0.43% to 5.08% after preprocessing. Particularly noteworthy are the substantial percentage increases in Parallelepiped Classification, ranging from 23.74% to 53.34%, highlighting the transformative impact of preprocessing on its accuracy. These findings emphasize the necessity for customized preprocessing strategies to refine the precision of LULC classification models, offering valuable contributions to the realms of remote sensing and geospatial analysis. Moreover, the insights gleaned from this research provide crucial guidance for urban growth management and climate resilience strategies in rapidly developing urban areas, making it a valuable resource for sustainable urban planning.
Introduction
I. INTRODUCTION
Chhatrapati Sambhajinagar, nestled in the heart of Maharashtra, India, is a city of historical grandeur and cultural significance. Its name pays homage to the Mughal emperor Aurangzeb, whose reign left an indelible mark on its heritage [1]. At a distance of approximately 335 kilometers east of Mumbai, the state capital, Chhatrapati Sambhajinagar stands as a hub of historical and architectural marvels. The city's crowning jewels are the UNESCO World Heritage Sites of the Ajanta and Ellora Caves, adorned with ancient rock-cut Buddhist, Hindu, and Jain temples that narrate tales of India's rich spiritual legacy [2]. Culturally, Chhatrapati Sambhajinagar is a vibrant mosaic, where Marathi, Urdu, and Hyderabad traditions converge harmoniously. This blend of cultures permeates every aspect of life in the city, from its eclectic cuisine that tantalizes the taste buds to its spirited celebrations of festivals that captivate the soul [3]. Chhatrapati Sambhajinagar's economic tapestry weaves together a diverse range of activities. Industries such as manufacturing, agriculture, tourism, and education thrive here. Notably, the city is home to the ambitious Chhatrapati Sambhajinagar Industrial City (AURIC), a sprawling Greenfield industrial smart city poised to drive economic growth and innovation [4]. As of the last update in September 2021, Chhatrapati Sambhajinagar boasted a population of over 1.1 million inhabitants [5]. However, it is crucial to consider that demographic figures may have evolved since then, and researchers are advised to rely on the latest available data for accuracy. To unravel the complexities of land cover in Chhatrapati Sambhajinagar City, we employ three distinct classification techniques.
Firstly, the Maximum Likelihood method is employed, a widely used statistical approach for classifying pixels based on spectral characteristics. Secondly, the Mahalanobis Distance Classification and Parallelepiped Classification, which considers the covariance between different bands of satellite imagery, is applied to enhance classification accuracy. Lastly, the Support Vector Machine (SVM) method, known for its robustness in handling high-dimensional data, is deployed as a powerful tool in our analysis [6]. Our research meticulously evaluates the accuracy of these classification techniques, shedding light on their respective strengths and weaknesses when applied to the dynamic urban environment of Chhatrapati Sambhajinagar City. By comparing the results across the Four chosen years, we gain valuable insights into the dynamics of land use changes within the city.
II. LITERATURE REVIEW
In an urban transition scenario, land use change combined with a lack of UGS stewardship resultsin small, fragmented, and degraded UGS [7]. One of the biggest challenges in this situation is the lack of capacity to plan and implement change [8]. Due to the unavailability of data or recordsof the current situation of UGS [9]. This lack of a complete dataset coupled with rapidadministrative boundary expansion and unauthorized land conversion in the urban transition process makes the monitoring and management of UGS a more complex process.
The local authorities fail to understand the associated trade-off of land allocation and its implications on the overall urban environment of a city. The local authorities refer to the cadastral maps for planning, monitoring, and management of UGS, however, these maps fail to represent the detailed landscape character, the diverse set of functions performed by UGS, their distribution, and other associated attributes.
This lack of base data in understanding the complex and dynamiclandscapes prevalent in cities becomes one of the major hindrances in the decision-making process.
Thus, the need for more detailed maps (spatial data) with spatial heterogeneity of the quantity and quality of services provisioned to guide a more integrated understanding of UGS arises. The spatial dataset augmented with detailed landscape layers facilitates the effective communication and evaluation of the service supply or the demand side of UGS [10].
For whichgeographic information system (GIS) is very effective and widely accepted as an “automated system for the capture, storage, retrieval, analysis, and display of spatial data” [11]. GIS allowsoverlaying different information in an integrated manner that is perceptive and communicable todifferent stakeholders [12]. Hence, GIS effectively integrates, represents, and communicates datato guide the planning process of UGS. These remotely- sensed data are widely used for Land UseLand Cover Change (LUCC) studies. The coarse spatial scale (30 m resolution) identifies greenspaces consistently across larger geographical units generated during the classification process Of imagery, in the form of arbitrary polygons with distinctive land cover, however, the data maynot be meaningful to planners in terms of units recognizable on the ground [13].
The classification of remotely-sensed data is based on the reflectance of ground cover, which is converted into polygons with distinct land cover, however, the unit size and the classes of greenspaces considered are broad and lack functional classification and ownership details (e.g., privateor public green spaces), which are necessary for managed landscapes. Thus, the need to generate spatial data that considers other attributes of human-dominated landscapes. In addition,quantitative green space cover arises to allow more sophisticated approaches for analyzing greenspaces for urban planning purposes [14]. Hence, the maps generated by analyzing the remote-sensing data, are referred to as thematic maps [15].
Which combine “spatial and on-spatial data” were explored as an important tool for dataset preparation in this study. Few studies showcase the increasing use of GIS in planning, such as in Vietnam, a dataset of urban trees and green space of two cities was prepared by mapping in GIS [16].
Some more authors have used it to map urban green infrastructure and understating land cover change [17].In India, as mapping of protected green spaces (national parks and forest), urbanization and changing land use land cover trends, green space quality, and quantity study at the neighborhood scale are evident in recent publications [18]. However spatial data with finer details are mostly unavailable.
Though this is vital for planning and decision-making, at presentspatial and digitized data for UGS is not available for most Indian cities, thus adversely affectingthe planning process. A recent study by Angularity and Narayanan also highlighted the need forgreen space mapping to support land allocations during master plan preparation for emerging urban centers [19]. Thus, to protect, manage and effectively plan the threatened and stressed UGSin an integrated manner, it is important to record what is prevalent in the city. With this context,the study endeavors to develop a mapping methodology to create a thematic map of public UGSfor Chhatrapati Sambhajinagar city as a case.
III. MATERIALS AND METHODS
A. Research Area
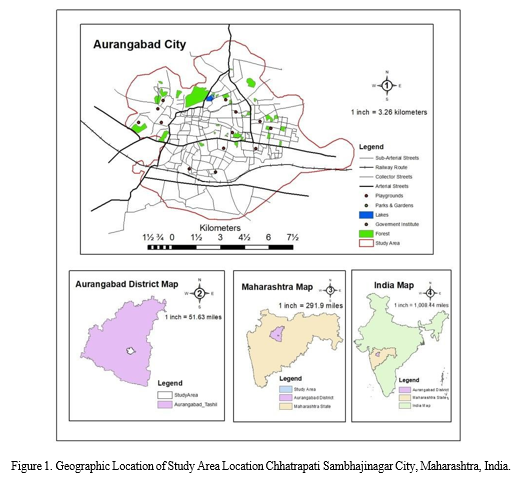
Chhatrapati Sambhajinagar city was taken as the research area (Figure 1), which is also a representative example of a typical mid-level emerging urban center in Maharashtra, India [20]. The city ranks as the 43 biggest urban agglomeration in country and 5th biggest city in the state of Maharashtra. It is the administrative headquarters of Chhatrapati Sambhajinagar district and is the largest city in the Marathwada region [21]. Located on a hilly upland terrain in the Deccan Traps, Chhatrapati Sambhajinagar is the fifth-most populous urban area in Maharashtra after Mumbai, Pune, Nagpur and Nashik with a population of 1,175,116. The city is known as a major production center of cotton textile and artistic silk fabrics.
B. Data Source
In this research, 2013 is chosen as the earliest year for the data analysis based on the low image resolution and data availability of satellite images and the quality of the existing reference dataset. Data are available through the year 2021. The geometrically corrected data of Landsat Level 1 products were downloaded from the United States Geographical Survey (USGS) [22]. The research followed 9-year intervals to visualize the difference in LULC dynamics. Spatial data were acquired at a resolution of 30 m from the Landsat-8 Operational Land Imager (OLI) images were used for the year for the 2013, 2016, 2019, and 2021. More details of the acquired data are shown in Table 1. The acquired data period was selected for the post-monsoon period (October to December), which mostly has vegetation green to semi-evergreen [23]. And free from cloud cover [24]. After downloading data from the USGS source was pre-processed by extracting the research area, radiometric and atmospheric correction using ENVI.
Table 1. Landsat Data Used for the Research.
|
Landsat |
Path/Row |
Spatial Resolution |
Acquired Year |
|
Landsat 8 OLI/TIRS |
141/41 |
30m |
2013, 2016, 2019 , 2021 |
C. Pre-Processing
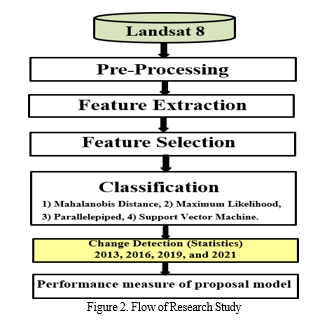
To avoid data error or tampering and to establish a direct link between data and biophysical processes, satellite images have to be pre-processed. Each Landsat image is an L1 product, and geometric corrections were performed during data pre-processing. This research used atmospheric and radiometric correction procedures in ENVI 5.5 for removing atmospheric noises and surface reflectance caused by the earth’s rotation [25]. All of the images were processed for radiometric calibration (digital number (DN) to Top of Atmosphere (TOA)) and atmospheric corrections (25-26). The atmospheric correction eliminated the effect of atmospheric absorption and scattering, which gives true surface reflectance data [27]. As the band composition is very important for LULC classification and every Landsat sensor has a different band, those bands were carefully composited into one layer. The framework of this research is shown in Figure 2.
D. Feature Extraction
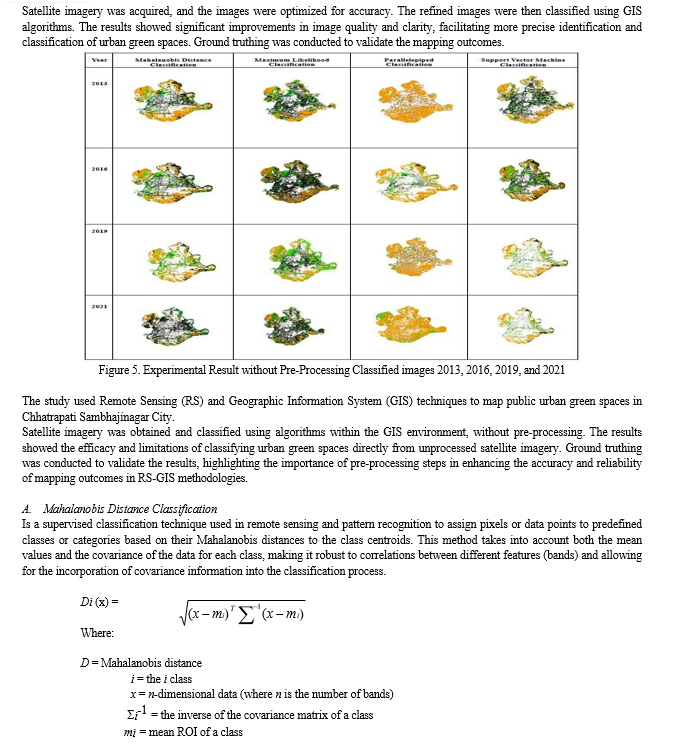
The feature extraction process begins by Regions of Interest (ROI) are raster samples used in classification statistics extraction. ENVI performs real-time orthorectification on ROI layers, displaying projected coordinates on existing RPC images acquiring and Pre- Processing high-resolution satellite imagery covering Chhatrapati Sambhajinagar. Image enhancement techniques are applied to improve visual quality and highlight vegetation-related features. Relevant spectral bands and indices sensitive to vegetation cover are selected for analysis. Ground truth data is collected through field surveys to delineate various land cover classes, including urban green spaces. Using this labelled data, supervised classification methods like Maximum Likelihood Classification (MLC), Mahalanobis Distance Classification (MDC), Support Vector Machine (SVM), and Parallelepiped Classification are employed. These methods utilize spectral signatures to classify pixels and distinguish urban green spaces from other land cover types. Accuracy assessment techniques are applied to validate the classified maps, refining them as needed. The final maps depict the extent and distribution of urban green spaces in Chhatrapati Sambhajinagar, aiding in informed urban planning and environmental management decisions.
E. Feature Selection
Principal Component Analysis (PCA) and Minimum Noise Fraction (MNF) are tools used in ENVI to reduce dimensionality in multispectral or Multispectral data. PCA transforms original variables into principal components, while MNF maximizes signal- to-noise ratio in Multispectral data. Choosing the appropriate technique depends on experimentation and data characteristics.
F. Classification
In this research, the LULC classification uses a supervised classification method. In supervised classification, Maximum Likelihood Classification (MLC), Mahalnobis Distance Classification (MDC), Support Vector Machine (SVM), and Parallelepiped Classification is the most widely used parametric algorithm, and it gives better classification results for quantitative analysis. At first, a number of signatures of each land class were generated for data training. These signatures were grouped manually into predefined land classes using simple random sampling, high-resolution Google Earth, and subject-matter expertise and familiarity with the research area. For remote sensing image classification, the quality and quantity of selection of training samples are largely related to the accuracy of overall classification. In order to get a better classification result, more sample of each land cover type were selected for training data [28]. Then supervised classification was carried out of all Landsat image using Maximum Likelihood Classification (MLC), Mahalnobis Distance Classification (MDC), Support Vector Machine (SVM) and Parallelepiped Classification. Based on the degree of similarity and properties of pixels, Maximum Likelihood Classification (MLC), Mahalnobis Distance Classification (MDC), Support Vector Machine (SVM) , and Parallelepiped Classification is categorized into one of the land class groups. In this research, five land cover types were selected based on the land use types and intensity of land use changes. Table 2 shows the major land cover types and their description of their characteristics in the research area. The descriptions of land cover types in the table below describe the nature and characteristics of land classes in the research area.
Table 2. Major Land Use and Land Cover types.
|
Land Cover Types |
Description |
|
Green Area |
A land dominated by trees, including natural woodlands and community plantations |
|
Buildup Area |
Residential, commercial, industrial, roads, and construction site |
|
Road Area |
All road network is administered by various government authorities build-up |
|
Water Bodies |
All types of water bodies such as rivers, ponds, and Lakes |
|
Barren Land |
Areas of silt and sand with very little or no vegetation, such as the shores of rivers |
G. Statistics and Accuracy Assessment
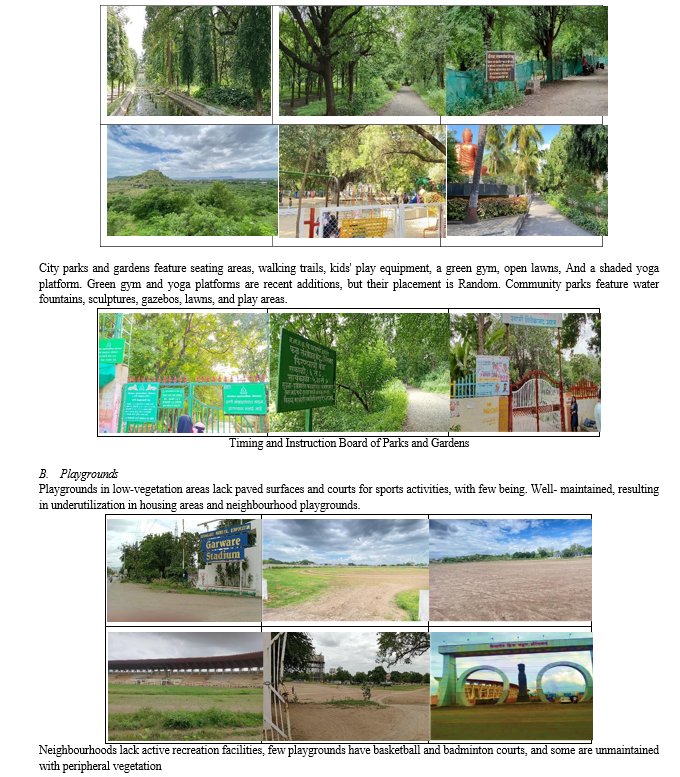
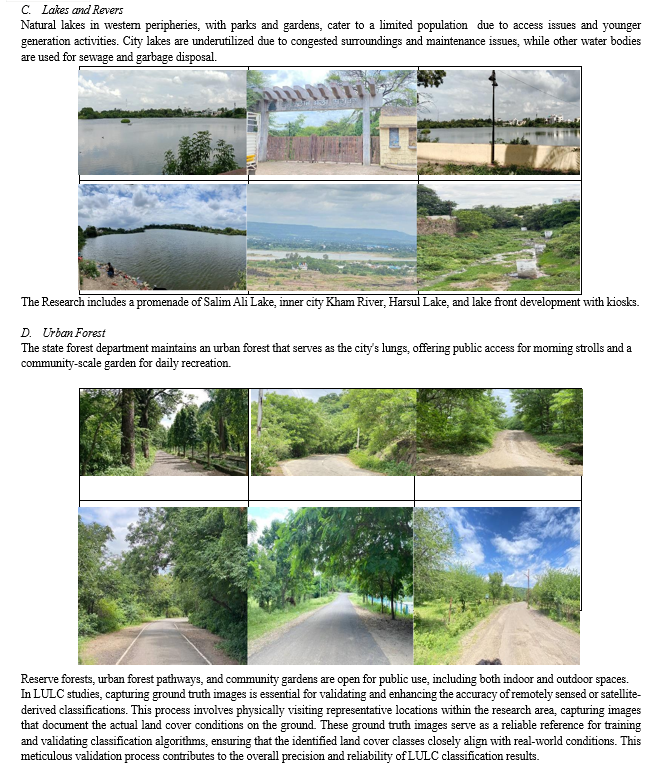
The final and most important step during the land cover type classification in the remote sensing data process is accuracy assessment or validation [29]. Accuracy assessment is an important activity due to the possibility of inaccuracy in the Landsat data. It compares the produced data by the user with the real ground truth data. The accuracy of classified land cover classes was measured using an error matrix [30], user accuracy, producer’s accuracy, overall accuracy and Kappa coefficient to verify the precision and error of the images by comparing them to actual ground truth points [31]. The accuracy assessment of land cover data was carried out using the generally accepted stratified random sampling method. Google Earth provides high-resolution satellite photos at no cost, which are critical references for validating the LULC classification [32]. In order to understand the accuracy of classified land classes, samples of actual ground truth data of each class were taken randomly and compared to classified land classes. The number of samples of each class sample depended on the area of the land class. First of all, an accuracy assessment point was created in classified data in GIS which was exported to Google Earth (Google Earth Pro version 7.3). Each random point was verified by comparing it with the ground truth for accuracy assessment. For this research , Google Earth images from December 2013 and 2021 were used as the reference for classified land classes of 2013 and 2021, respectively, and a 1:63,360 scale topographic map as a reference for classified land classes of 2013 and 2021. An error matrix was generated using reference points.



VI. FUTURE WORK
Future research endeavors should focus on refining and tailoring preprocessing techniques to better suit the unique characteristics of Chhatrapati Sambhajinagar City and similar urban centers. Further investigation into the specific drivers of LULC changes, such as urbanization and climate-related factors, would enhance our understanding of the observed patterns. Additionally, exploring the temporal dynamics of LULC changes and integrating more recent satellite data can provide real-time insights into urban development trends. The incorporation of machine learning algorithms and advanced statistical models could further enhance the accuracy of LULC classifications. Lastly, a more in-depth exploration of the ecosystem service values (ESV) associated with different LULC categories could contribute to sustainable urban planning by identifying areas of high ecological significance. Overall, ongoing research in these directions will contribute to a more nuanced understanding of urban dynamics and inform proactive strategies for sustainable development and climate resilience.
VII. ACKNOWLEDGEMENT
Authors would like to thank the Department of Computer Science and IT, Dr. Babasaheb Ambedkar Marathwada University, Chhatrapati Sambhajinagar authorities for providing infrastructure to carry out the experiments. This work is supported by BARTI.
Conclusion
In conclusion, our comprehensive analysis of land use and land cover (LULC) classification in Chhatrapati Sambhajinagar City, Maharashtra, India, has shed light on the dynamic urban growth patterns and their implications for climate vulnerability. Leveraging remote sensing and GIS techniques over a nine-year period, our research assessed LULC changes, including Green Area, Buildup Area, Road Area, Water Bodies, and Barren Land. The evaluation of five classification methods highlighted the efficacy of preprocessing techniques in consistently improving classification accuracy, with notable percentage improvements observed in Mahalanobis Distance, Maximum Likelihood, and Support Vector Machine methods. Notably, Parallelepiped Classification demonstrated substantial percentage increases, underscoring the transformative impact of preprocessing on its accuracy. These findings provide valuable insights for urban growth management and climate resilience strategies in rapidly developing urban areas.
References
[1] Smith, J. (2019). Mughal heritage in Chhatrapati Sambhajinagar. In H. Patel & S. Gupta (Eds.), Heritage Tourism in India (pp. 87-102). Rout ledge. [2] UNESCO. (2020). Ellora Caves. United Nations Educational, Scientific and Cultural Organization. https://whc.unesco.org/en/list/243/ [3] Kumar, R. (2018). Cultural diversity in Chhatrapati Sambhajinagar, Maharashtra. Geography and You, 18(1), 48-51. [4] AURIC. (2021). About Us. Chhatrapati Sambhajinagar Industrial City (AURIC). https://auric.city/about-us/ [5] Government of Maharashtra. (2021). Maharashtra State Gazetteers: Chhatrapati Sambhajinagar District. Directorate of Government Printing, Stationery and Publications. https://web.archive.org/web/20210814145819/https://gazetteers.maharashtra.g ov.in/cultural.maharashtra.gov.in/english/gazetteer/Chhatrapati Sambhajinagar/003%20Gene ral/01_Introduction.pdf. [6] Foody, G. M. (2002). Status of land cover classification accuracy assessment. Remote Sensing of Environment, 80(1), 185-201. [7] Town & Country Planning Organisation. Urban Greening Guidelines; Ministry of urban development, Government of India: New Delhi, India, 2014. [8] Troy, Austin, and Matthew A. Wilson. \"Mapping ecosystem services: practical challenges and opportunities in linking GIS and value transfer.\" Ecological economics 60, no. 2 (2006): 435- 449. [9] Meyer, Burghard Christian, and Ralf Grabaum. \"MULBO: A model framework for multicriteria landscape assessment and optimization. A support system for spatial land use decisions.\" Landscape Research 33, no. 2 (2008): 155-179. [10] De Groot, Rudolf S., Rob Alkemade, Leon Braat, Lars Hein, and Louise Willemen. \"Challenges in integrating the concept of ecosystem services and values in landscape Planning, management, and decision making.\" Ecological complexity 7, no. 3 (2010): 260-272. [11] Clarke, Keith C. \"Analytical and computer cartography.\" (1995). [12] Murphy, Enda, and Eoin A. King. \"Mapping for sustainability: Environmental noise and the city.”Sustainability Research (2013): 111133. [13] Yusof, Mohd, and Mohd Johari. \"True colors of urban green spaces: identifying and assessing the qualities of green spaces in Kuala Lumpur, Malaysia.\" Ph.D. diss., University of Edinburgh, 2013. [14] Dennis, Matthew, David Barlow, Gina Cavan, Penny A. Cook, Anna Gilchrist, John Handley, Philip James, et al. \"Mapping urban green infrastructure: A novel landscape- based approach to incorporating land use and land cover in the mapping of human- dominated systems.\" Land 7, no. 1 (2018): 17. [15] Gupta, K.; Sharma, K.P.; Krishnamurthy, Y.V.; Kolapkar, R. FUNCTIONAL ASSESSMENT OF URBAN GREEN SPACES SPACES—A GIS ANALYSIS. In Proceedings of the 12th ESRI India User Conference, Noida, India, 7–8 December 2011. [16] Gopal, Sucharita, and Curtis Woodcock. \"Theory and methods for accuracy assessment of thematic maps using fuzzy sets.\" Photogrammetric engineering and remote sensing ;( United States) 60, no. 2 (1994). [17] Sreetheran, Maruthaveeran, and Mohammad Adnan. \"Green network development of Kuala Lumpur city: from the perspective of Kuala Lumpur structure plan.\" In Forum, vol. 7, pp. 38-42. 2007. [18] Kafafy, Nezar Atta-Allah. Dynamics of urban green space in an arid city: The case of Cairo- Egypt. Cardiff University (United Kingdom), 2010. [19] Tan, Puay Yok, James Wang, and Angelia Sia. \"Perspectives on five decades of the urban greening of Singapore.\" Cities 32 (2013): 24-32. [20] TOWNS AND URBAN AGGLOMERATIONS CLASSIFIED BY POPULATION SIZE CLASS IN 2011 WITH VARIATION SINCE 1901 - Class I https://censusindia.gov.in/nada/index.php/catalog/42876 [21] Sohoni, Pushkar. Chhatrapati Sambhajinagar with Daulatabad, Khuldabad, and Ahmadnagar. Jaico Publishing House, 2015. [22] USGS. (2021). Landsat Program. U.S. Geological Survey.https://www.usgs.gov/core-science-systems/nli/landsat/landsat- program [23] Xie, Gao-Di, et al. \"Ecological assets valuation of the Tibetan Plateau.\" Journal of natural resources 18.2 (2003): 189-196. [24] Khadka, Nitesh, Guoqing Zhang, and Sudeep Thakuri. \"Glacial lakes in the Nepal Himalaya: Inventory and decadal dynamics (1977–2017).\" Remote Sensing 10.12 (2018): 1913. [25] Wang, Sonam Wangyel, et al. \"Land use and land cover change detection and prediction in the Kathmandu district of Nepal using remote sensing and GIS.\" Sustainability 12.9 (2020): 3925. [26] Chen, Chao, et al. \"The application of the tasseled cap transformation and feature knowledge for the extraction of coastline information from remote sensing images.\" Advances in Space Research 64.9 (2019): 1780-1791. [27] Lin, Tao, et al. \"Urban spatial expansion and its impacts on island ecosystem services and landscape pattern: A case research of the island city of Xiamen, Southeast China.\" Ocean & Coastal Management 81 (2013): 90-96. [28] Wang, Liyan, et al. \"Estimation of the value of regional ecosystem services of an archipelago using satellite remote sensing technology: A case research of Zhoushan Archipelago, China.\" International Journal of Applied Earth Observation and Geo-information 105 (2021): 102616. [29] Adam, Abubaker Haroun Mohamed, A. M. H. Elhag, and Abdelrahim M. Salih. \"Accuracy assessment of land use & land cover classification (LU/LC), case research of Shomadi area, Renk County, Upper Nile State, South Sudan.\" International journal of scientific and research publications 3.5 (2013): 1712- 1717. [30] Congalton, Russell G. \"A review of assessing the accuracy of classifications of remotely sensed data.\" Remote sensing of environment 37.1 (1991): 35-46. [31] Tilahun, Abineh, and Bogale Teferie. \"Accuracy assessment of land use land cover classification using Google Earth.\" American Journal of Environmental Protection 4.4 (2015): 193-198. [32] Rai, Raju, et al. \"Land use and land cover dynamics and assessing the ecosystem service values in the trans-boundary Gandaki River Basin, Central Himalayas.\" Sustainability 10.9 (2018): 3052. [33] Shrestha, Srijana, et al. \"An Assessment of the Impact of Land Use and Land Cover Change on the Degradation of Ecosystem Service Values in Kathmandu Valley Using Remote Sensing and GIS.\" Sustainability 14.23 (2022): 15739.
Copyright
Copyright © 2023 Reema A Lahane, Ramesh R Manza. This is an open access article distributed under the Creative Commons Attribution License, which permits unrestricted use, distribution, and reproduction in any medium, provided the original work is properly cited.

Download Paper
Paper Id : IJRASET57427
Publish Date : 2023-12-08
ISSN : 2321-9653
Publisher Name : IJRASET
DOI Link : Click Here
 Submit Paper Online

