Ijraset Journal For Research in Applied Science and Engineering Technology
- Home / Ijraset
- On This Page
- Abstract
- Introduction
- References
- Copyright
A Comprehensive Methodology for Analysing Options Trading: Utilizing Historical Data and the Black-Scholes Model
Authors: Haya Jafri, Shreyash Kanojiya, Hiloni Sanghavi, Anupama Jawale
DOI Link: https://doi.org/10.22214/ijraset.2024.64180
Certificate: View Certificate
Abstract
This paper presents a systematic methodology for analysing options trading, integrating user inputs with historical stock data to facilitate informed decision-making. The process begins with the collection of user-specified stock tickers and expiration dates, followed by the retrieval of historical price data to assess past stock performance. Key components of the analysis include calculating historical volatility, fetching the option chain, and filtering options into put and call categories. The methodology employs the Black-Scholes model to estimate fair option prices, which are further evaluated by calculating expected returns. The analysis culminates in the ranking of the top three put and call options based on their expected returns, providing users with actionable insights. Additionally, the methodology incorporates visual representations of stock prices and option data, alongside calculations of option Greeks to assess risk sensitivity. This comprehensive approach empowers traders to navigate the complexities of options trading with a clear understanding of potential outcomes and associated risks.
Introduction
I. INTRODUCTION
The fair value of a finance contract called an option is found through the process of option pricing. Options offer the holder the right but not the obligation to either buy or sell an economic asset, for example, stocks, money, or commodities at a certain price on or before a set date. Risk management, hedging, and trading strategies are all dependent on accurate option pricing because of this it is important in determining the value of financial market operations. To estimate the theoretical value of options, traders and investors use two tools called Black Scholes and binomial option models. By considering risk preferences and market conditions they help make decisions allowing you to hold sell or buy choices.
II. LITERATURE REVIEW
In the first paper, Abraham et al (1997) acknowledge studies on stock, foreign exchange, and commodity markets that support the existence of time-varying asset return distributions. They emphasise how crucial it is to consider how scheduled and unscheduled announcement events, like reports on the money supply, earnings, and crop yields, can affect asset returns. To give a more accurate basis for pricing options than earlier Poisson jump-diffusion models, the study develops an Event Model for European call options that specifically considers the effects of these two groups of events. The paper's parametric analysis shows that the standard models underprice options in comparison to the event model, suggesting that the event model may be effective for pricing short-term deep out-of-the-money options when scheduled events are present in the market. Additionally, the paper mentions alternate specifications for asset returns proposed in the options literature, such as stochastic processes and random variance models. However, it notes that these models have limited improvements over the standard Black Scholes model. In another paper, Shu Liu (2007) explores commonly used option pricing models such as the Black-Scholes model, Jump Diffusion Model, Binomial Tree model, Monte-Carlo valuation, and Finite Difference Method. It is shown that while there has been a lack of study employing real-time data, many empirical studies have examined the efficacy of these models using historical data. To create a new option pricing application that can process real-time or slightly delayed market quotes for pricing options, the study intends to merge computational expertise with option pricing literature. The programme is designed to aid investors in comparing market prices with anticipated prices to discover appropriate investment moments as well as researchers in testing the accuracy of pricing models and input volatility. The discussion, methodology, and testing in the study are concentrated on computational finance joint issues.
In another study, Dominique et al (2013) proposes new option pricing models based on a class of models that include jumps in Levy-type based models (such as NIGLevy, Merton-jump 2013) and Duan based models to truly reflect economic profit growth model categories mixed. Two new pricing kernel specifications—the Escher transform and the minimum entropy martingale measure—are used to generate the risk-neutral dynamics of the time series models. The study experimentally uses a European options data set based on the S&P and CAC 40 indexes of options with changing times of maturity and wealth pricing and hedging results are accurate when models include jumps and time-varying variables. The method described in another research is intriguing for option pricing when option markets are limited or non-existent. Julien et al (2008) compares the classic Black Scholes model with a European option pricing model that takes extreme events into account. It demonstrates how the conventional approach undervalues in-the-money and out-of-the-money options while overvaluing at-the-money options. To describe the historical dynamics of the rate of return on the underlying asset, the study mentions the use of the maximum likelihood method for option pricing and the assumption of a combination of Gaussian distributions. It emphasises how well suited Gaussian mixes are compared to other types of distribution. Alternative distributions like alpha-stable distributions, simple and generalised Student distributions, and hyperbolic distributions are suggested in the literature as remedies for the Gaussian distribution's limitations. Overall, the research adds to the body of knowledge by recommending a European option pricing model that more accurately accounts for exceptional occurrences and by emphasising the value of considering alternative distributions when simulating the dynamics of underlying asset returns. In the next paper, Sol Kim et al (2009) compares the performance of Câmara and Heston (2008)’s options pricing model with the Black Scholes (1973) model for pricing options on the KOSPI 200 Index. It finds that Câmara and Heston (2008)’s model shows better performance for both in-sample and out-of-sample pricing. According to the study, downward jumps play a bigger role in determining the price of stock index options rather than upward jumps. In pricing stock index options, the study emphasises the significance of extreme events, particularly downward jumps. This finding is in line with empirical evidence that the stock index options market exhibits negative skews. In another study, Zhidong Guo et al (2021) proposes a new model called the time driven model for option pricing, where the price of the underlying asset is driven by different random driving sources in different time intervals. The paper focuses on the development of a model that captures the dynamics of the underlying asset price more accurately by incorporating time intervals and different driving sources. The model aims to improve option pricing by considering the changing nature of the driving sources over time, which can have a significant impact on the pricing of options. Overall, the paper introduces a novel approach to option pricing by incorporating time intervals and different driving sources, which can potentially enhance the accuracy of option pricing models. This might improve the efficacy of option pricing models and give market players useful information.
III. METHODOLOGY
This methodology outlines a systematic approach to analyse options trading based on user inputs and historical stock data. The steps are designed to guide users through the process of selecting and evaluating options for specific stocks. This structured approach ensures a thorough analysis of options trading, allowing users to make informed decisions based on historical data and calculated projections. Methodology for Options Trading Analysis is illustrated as follows.
- Data Preparation: Start with a Cleaned Dataset: Ensure that the dataset is free of errors and irrelevant data points to facilitate accurate analysis.
- User Input: User Input (Stock Ticker, Expiry Date): Collect specific stock tickers and expiration dates from users to customize the analysis.
- Data Collection: Fetch Stock Data (Historical Prices): Retrieve historical price data for the selected stock, which is essential for understanding past performance.
- Volatility Calculation: Calculate Historical Volatility: Use historical price data to compute the stock's historical volatility. This is typically done by calculating the standard deviation of the stock's returns over a specified period, which can be annualized for consistency in options pricing
- Options Data Retrieval: Fetch Option Chain: Access the option chain data for the selected stock, which contains details about all available option contracts.
- Data Filtering: Filter Option Chain (Puts and Calls): Separate the options into two categories: put options and call options. This allows for focused analysis on each type of option.
- Financial Parameters: Set Risk-Free Interest Rate (r): Determine the current risk-free interest rate, typically based on government bond yields, to be used in option pricing calculations.
- Calculate Time to Expiration (t): Compute the time remaining until the options' expiration date based on user input.
- Pricing Model: Define Black-Scholes Formula: Establish the Black-Scholes model for option pricing, which incorporates variables such as stock price, strike price, expiration time, and volatility.
- Estimate Fair Price for Options (Puts and Calls): Apply the Black-Scholes formula to calculate the fair market value of both put and call options, providing insight into expected costs.
- Calculate Expected Return for Options: For each option, compute the expected return based on the estimated fair price, enabling users to assess potential advantages or disadvantages.
- Rank and Suggest Top 3 Put and Call Options: Analyse all available options and rank them according to their expected returns. Present the top three options in each category for user consideration.
- Results Presentation & Visualization: Display Results (Suggested Options and Stock Price): Present the recommended options alongside the current stock price, offering a comprehensive view for decision-making. Plot Stock Price and Options: Create visual representations of historical stock prices and option data to enhance user understanding of the information.
- Risk Assessment: Compute the Greeks (e.g., delta, gamma, theta, rho) for the options, which provide insights into the options' sensitivity to various factors, including price changes and time decay.
IV. RESULTS
We have achieved how to determine which options are best to buy given the impact of real time events on option prices and the implied volatility that we calculate using option Greeks. The insights we provide could be used to improve option pricing strategies and better risk management in dynamic market conditions. We use Black-Scholes model because it takes into consideration many variables that show the real-life difficulties of calculating option prices. It uses Ito's lemma and Brownian motion to predict a rough estimate of option prices given different conditions. It is the most used and a highly efficient model. We then visualise these results on a graph.

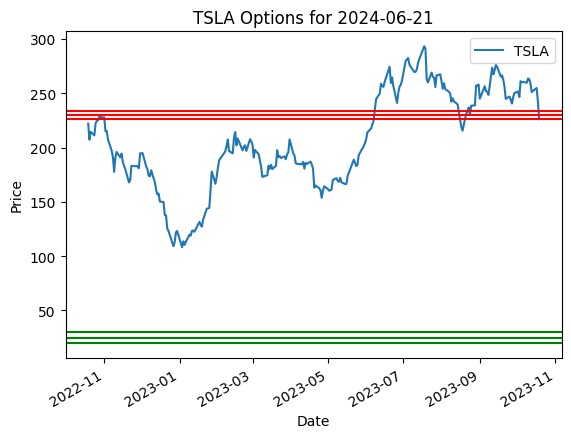
The red line is the suggested put options while the green line is the suggested call options. The blue line shows the stock price of TSLA (the ticker for Tesla). What we can observe here is the graph plots time vs price from the past 1 year of option and stock price. If we notice the blue line, we can see that the blue line ends before 11/23. If we combine our model with a stock price prediction model then we can easily estimate the best put and call options. The green and red line currently consists of the best in the money call and put options.
Amazon

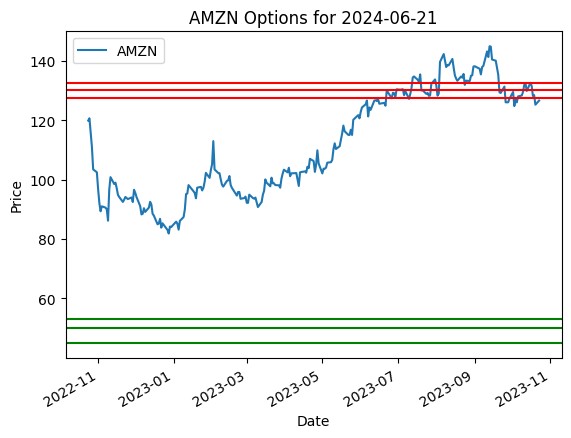
In the first 2 images we see the stock prices and option prices for various put and call option plotted on the graph for Amazon (AMZN) and Tesla (TSLA). Now, both amazon and tesla are mature companies with a huge market cap. The volatility for mature companies is significantly less due to their huge customer base and their revenue generation. Hence, when we look at the graph, we can see how there are various put and call options that can we can buy to gain profits.
Revolution Medicines Inc

Textainer Group Holdings Ltd

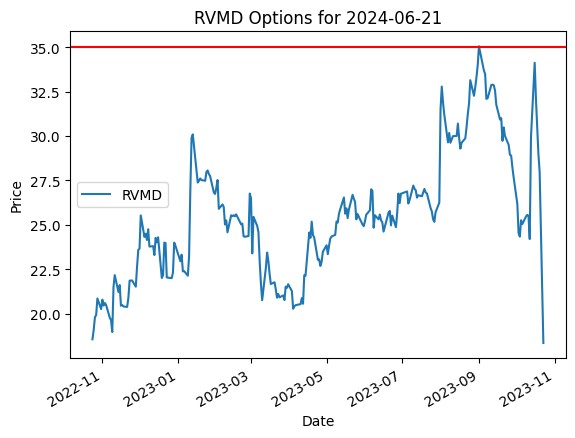
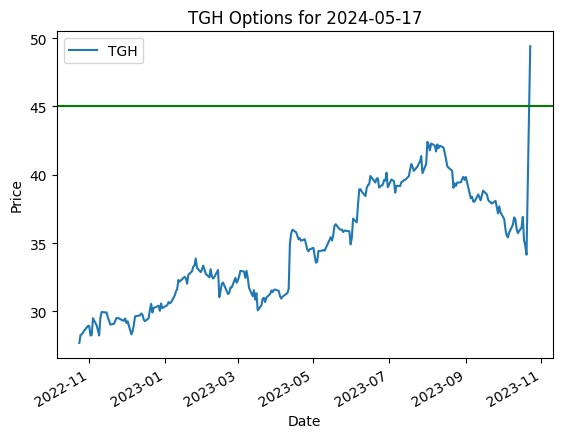
Now coming to these images which shows the graphs of RVMD – Revolution Medicines and TGH -Textainer Group Holdings. These both stock have had a negative and positive impact of real life events on their respective stock prices. This has resulted in a huge fall/rise in their prices. Which in-turn has affected the put/call options. In the RVMD case we can see that the graph only shows the put option (red line), which is shows the impact of a real time event, since the stock price fell so rapidly the model calculated the implied volatility is very high which might result in negative gains or loses. Hence it doesn’t suggest the “Call” option which gives the holder the right to buy, and only displays the “In the money” put option. For TGH the case is exactly opposite. A huge merger has resulted in their stock prices getting sky rocketed and hence the model calculates the volatility and suggests to not sell the stock and suggests the preferable call option.
V. FUTURE SCOPE
The application of option pricing with real-time implications is brilliant and can best grow with the development of quantitative techniques, information resources, and technology. Combining high-frequency trading processes with option pricing models is a useful application. High frequency trading becomes more relevant when real-time events have the ability to have an effect on option values in a given timeframe. Improved risk management techniques that adjust with changing market conditions help realize how market expectancies of volatility adjust in reaction to real-time events. It can also help include cryptocurrency and different digital asset pricing to the models because these also have their own dynamics and real-time happenings. Buyers can time their alternative purchases successfully. By thinking about the effect of real time events, they can enter positions when situations are favourable and exit or alter positions whilst conditions end up much less favourable. Real-time analysis can lessen uncertainty by way of offering a higher know-how of market sentiment and potential reactions to unique occasions. Option consumers can make greater knowledgeable decisions primarily based on these facts. By experiencing how actual-time events can affect option prices, buyers can discover risks and take steps to ease them, reducing the probability of huge losses. Monitoring actual-time financial indicators, which includes unemployment figures or GDP, can help analyse overall state of the economy and therefore approximate the general fitness of the financial system. Investors can use these statistics to make knowledgeable choices about asset allocation and portfolio changes.
References
[1] Abraham, Abraham., William, M., Taylor. (1997). An Event Option Pricing Model with [2] Scheduled and Unscheduled Announcement Effects. Review of Quantitative Finance and Accounting, 8(2), 151-162. Available from: 10.1023/A:1008249800346 [3] Shu, Liu. (2007). Review of Option Pricing Literature and An Online Real-Time Option Pricing Application Development. [4] Dominique, Guegan., Florian, Ielpo., Hanjarivo, Lalaharison. (2013). Option pricing with discrete time jump processes. Journal of Economic Dynamics and Control, 37(12), 2417-2445. Available from: 10.1016/J.JEDC.2013.07.003 [5] Julien, Idier., Caroline, Jardet., Gaëlle, Le, Fol., Alain, Monfort., Fulvio, Pegoraro. (2008). Taking into account extreme events in European option pricing. Financial Stability Review, 12(12), 39-51. [6] Sol, Kim. (2009). Option Pricing with Extreme Events: Using Câmara and Heston (2008) ‘s Model*. Asia-pacific Journal of Financial Studies, 38(2), 187-209. Available from: 10.1111/J.2041-6156.2009.TB00012.X [7] Zhidong, Guo., Xianhong, Wang., Yunliang, Zhang. (2021). Option pricing under time interval driven model. Communications in Statistics - Simulation and Computation, 1-8. Available from: 10.1080/03610918.2021.1887226
Copyright
Copyright © 2024 Haya Jafri, Shreyash Kanojiya, Hiloni Sanghavi, Anupama Jawale. This is an open access article distributed under the Creative Commons Attribution License, which permits unrestricted use, distribution, and reproduction in any medium, provided the original work is properly cited.

Download Paper
Paper Id : IJRASET64180
Publish Date : 2024-09-07
ISSN : 2321-9653
Publisher Name : IJRASET
DOI Link : Click Here
 Submit Paper Online

