Ijraset Journal For Research in Applied Science and Engineering Technology
- Home / Ijraset
- On This Page
- Abstract
- Introduction
- Conclusion
- References
- Copyright
Convolution Neural Network Based Approach for Diabetic Retinopathy Detection using Fundus Images
Authors: Sridhar N, Chandana M, Kusuma H M, Namratha M K, Sneha R
DOI Link: https://doi.org/10.22214/ijraset.2024.61225
Certificate: View Certificate
Abstract
Diabetic Retinopathy (DR) represents the most prevalent complication arising from diabetes, impacting the retina and standing as a leading cause of global blindness. Timely detection plays a pivotal role in preserving patients\' vision, yet early identification remains challenging, relying heavily on clinical experts\' interpretation of fundus images. In this investigation, a deep learning model underwent training and validation using a proprietary dataset. The intelligent model assessed the quality of test images, distinguishing them into DR-Positive and DR-Negative categories and further classifying their severity stages, encompassing mild, moderate, severe, and normal. Subsequently, expert review will scrutinize the model\'s performance based on the obtained results.
Introduction
I. INTRODUCTION
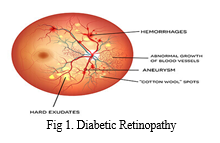
People with diabetes can have an eye disease called diabetic retinopathy. This is when high blood sugar levels cause damage to blood vessels in the retina. These blood vessels can swell and leak. Or they can close, stopping blood from passing through. Sometimes abnormal, new blood vessels grow on the retina. All of these changes can steal your vision. Diabetic Retinopathy is the most common micro-vascular complication of diabetes, and it has become the leading cause of blindness globally. It is estimated that more than 200 million people will be affected by DR in 2040 [1]. The tiny blood vessels (the lightest sensitive area) in the retina at the back of the eye are destroyed by Diabetic Retinopathy. There are two types of DR. One type is Non-Proliferative Diabetic Retinopathy (NPDR), in which the tiny blood vessels swell and leak the fluid that causes a macular edema (swelling of the central part of the retina), which is the dominant cause of mild vision loss. The second type of DR is Proliferative Diabetic Retinopathy (PDR), which is the most advanced class, in which blood vessels grow on the retina’s surface. These cracks in these blood vessels cause vitreous hemorrhages and severe vision loss. The most common risk factors of DR are diabetes (type 1 and type 2), the symptoms include blurred vision, seeing spots and floaters, dark or empty spots in the center of the retina, and decreased vision at night [2]. The detail of Diabetic Retinopathy with various symptoms are shown in Figure 1. Diabetic Retinopathy (DR) is the most significant cause of blindness among the working-class population in the United States. The prevalence of DR increases with the duration of diabetes, and it causes blindness in the case of late treatment. The CDC estimates that the number of DR patients has increased from 4.06 million to 7.69 million from 2000 to 2010, which is approximate increase of 89 percent. By 2050, this number is expected to double in the United States [3]. According to the National Diabetes survey of Pakistan [4], it has been found that 27.4 million people are affected by diabetes, which is four times higher than it was in 1998. The early detection of DR increases the chances of receiving proper and effective treatment [5]. The symptoms of DR at the initial level are not visible, and the patients do not notice the vision loss until the disease starts to damage their eyes, although this happens in the final phase [6]. The fundus photographs are used for the detection of DR, as these photographs have a high resolution, low cost, and easy storage and transmission.

Ophthalmologists mostly use fundus images to screen for DR manually, which may be biased, complex, and prone to error. It is hard to develop an automatic system consisting of image processing and machine learning approaches to identify DR accurately to overcome these manual errors [7]. Machine learning provides a rapid and practical solution to screening Diabetic Retinopathy. Sambyal et al. [8] presented a method to identify Diabetic Retinopathy using machine learning techniques. The method used various characteristics of two machine learning classifiers, Optimum-Path Forest (OPF) and the Restricted Boltzmann machine. The metrics applied to evaluate the model are accuracy, specificity, and sensitivity. Deep learning is vital in classifying complex images such as the human retina. Khan et al. [9] presented a computational approach for detecting diabetes from ocular scans. The approach classified the retinal images into DR-Positive or DR-Negative ones using deep learning Xception architecture with a dense neural network.
A. Symptoms of Diabetic Retinopathy
The early stages of diabetic retinopathy usually don’t have any symptoms. Some people notice changes in their vision, like trouble reading or seeing faraway objects. These changes may come and go. In later stages of the disease, blood vessels in the retina start to bleed into the vitreous (gel-like fluid that fills your eye). If this happens, you may see dark, floating spots or streaks that look like cobwebs. Sometimes, the spots clear up on their own — but it’s important to get treatment right away. Without treatment, scars can form in the back of the eye. Blood vessels may also start to bleed again, or the bleeding may get worse.
B. Evolving Role of Digital Technology in Evaluating Diabetic Retinopathy
Rapidly evolving computer technology is supplementing face-to-face patient examinations and expanding the reach of diabetic retinopathy evaluations. Diabetic retinopathy remains a leading cause of blindness, even though timely treatment has been proven to dramatically reduce severe vision loss. Every diabetic patient is at risk of developing retinopathy, yet many do not receive annual examinations that could detect the disease at a treatable stage. Future technological developments may one day challenge our perception of the physician's role in diagnosing diabetic retinopathy. Evaluating diabetic patients for diabetic retinopathy requires a means of viewing retinal pathology, an ability to recognize the disease and the cognitive expertise to classify its severity. The Diabetic Retinopathy Study/Early Treatment Diabetic Retinopathy Study (DRS/ETDRS), conducted in the 1970s and 1980s, showed that remote diabetic retinopathy evaluation using 35 mm slide fundus photographs was practical.1 Seven-field, stereoscopic slide pairs were sent to a reading center for severity level classification by readers who were supervised by ophthalmologists.
C. Diabetic Retinopathy Diagnosis
Drops will be put in your eye to dilate (widen) your pupil. This allows your ophthalmologist to look through a special lens to see the inside of your eye. Doctor may do optical coherence tomography (OCT) to look closely at the retina. A machine scans the retina and provides detailed images of its thickness. This helps your doctor find and measure swelling of your macula.
Fluorescein angiography or OCT angiography helps your doctor see what is happening with the blood vessels in your retina. Fluorescein angiography uses a yellow dye called fluorescein, which is injected into a vein (usually in your arm). The dye travels through your blood vessels. A special camera takes photos of the retina as the dye travels throughout its blood vessels. This shows if any blood vessels are blocked or leaking fluid. It also shows if any abnormal blood vessels are growing. OCT angiography is a newer technique and does not need dye to look at the blood vessels.
II. RELATED WORK
[1] Yau et al. (2012) conducted a comprehensive pooled analysis of global diabetic retinopathy (DR) prevalence and its major risk factors. Using data from various population-based studies, they standardized prevalence estimates across different age groups, providing insights into the prevalence rates of DR, proliferative DR, diabetic macular edema, and vision-threatening DR (VTDR). [2] Li et al. (2020) introduced CANet, a novel cross-disease attention network designed to jointly grade diabetic retinopathy (DR) and diabetic macular edema (DME). Utilizing image-level supervision, CANet incorporates disease-specific attention modules to extract relevant features for individual diseases and disease-dependent attention modules to capture their internal relationship. [3] Kumar et al. (2016) proposed an automated system for diabetic retinopathy (DR) detection using two-field mydriatic fundus photography. Their method involves multi-level wavelet decomposition for optic disc localization, blood vessel extraction via histogram analysis, and lesion detection through intensity transformation, culminating in DR classification based on aggregated lesion information. [4] Zhu et al. (2019) presented an automatic screening method for diabetic retinopathy (DR) utilizing color fundus images.
Their approach integrates edge-guided microaneurysm detection, mixed-feature-based candidate classification, and fused image- and lesion-level features for DR prediction. [5] Sambyal et al. (2022) proposed modified deep residual networks for binary and multistage classification of diabetic retinopathy (DR). Evaluating their models on the MESSIDOR dataset, they achieved notable accuracies for binary classification using various ResNet architectures. [6] Fang and Qiao (2022) introduced a novel DAG network model for diabetic retinopathy (DR) classification, leveraging multi-feature fusion of fundus images. Their model demonstrates high efficiency and accuracy, potentially aiding in the diagnosis and treatment of DR. [7] Elloumi et al. (2022) proposed an end-to-end mobile system for diabetic retinopathy (DR) screening using lightweight deep neural networks. Their approach addresses challenges in accurate detection from smartphone-captured fundus images, achieving promising results in terms of accuracy, sensitivity, specificity, and precision. [8] Kanakaprabha et al. (2023) conducted a comparative analysis of deep learning models for diabetic retinopathy (DR) detection, proposing an optimized model based on VGG-16 architecture. Their study emphasizes the importance of accurate and efficient automatic detection in cost-effective screening and prevention of retinal diseases. [9] Vives-Boix and Ruiz-Fernández (2021) evaluated a method for diabetic retinopathy (DR) detection utilizing convolutional neural networks (CNNs) with synaptic metaplasticity. Their findings highlight the potential of CNN architectures enhanced with synaptic metaplasticity in improving learning rate and accuracy. [10] Fatima et al. (2022) proposed a unified technique for entropy-enhanced diabetic retinopathy (DR) detection using a hybrid neural network. Their approach combines a novel entropy enhancement technique with a computationally efficient neural network, demonstrating significant improvements in DR classification compared to contemporary schemes.
III. PROPOSES SYSTEM

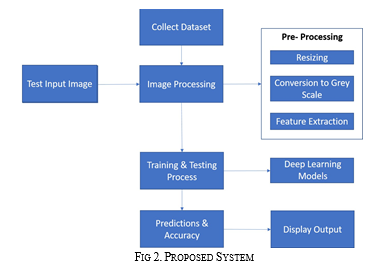
The above figure 2 shows the flow chart of proposed system. For training purpose the collected retinal images datasets are given as input and undergoes pre-processing. Then the extracted image is fed for training purpose using ML algorithm and creates a model. For testing purpose the unknown retinal image is given as input, gets pre-processed and is fed into the trained model. The information is compared with tarined dataset and predicts the output if the unknown image is DR- positive or DR- negative with the stage of infection like mild, moderate, severe or normal.
A. Experimental Datasets
Collected samples are input to the model under the different angles, which becomes the reference for development of proposed system. Kaggle allows users to collaborate with other users, find and publish datasets, so in the proposed system we have considered Kaggle and internet sources website to collect images of diabetic retinopathy fundus images and classified for mild, moderate, severe and normal stages images. All together 300+ images are considered for dataset preparation.
B. Pre-processing Techniques
Prior to being utilized for model training and inference, images need to undergo pre-processing, which includes various adjustments such as resizing, orientation, and color correction. The objective of pre-processing is to enhance the quality of the image to enable more effective analysis. Pre-processing helps to eliminate undesirable distortions and improve specific features that are crucial for the specific application at hand, which can vary depending on the use case. Pre-processing is a necessary step for the software to function properly and achieve the intended outcomes. Steps involved are:
- Orientation
- Resize & Random Flips
- Grayscale Conversion
- Different Exposure
C. Feature Extraction
Feature extraction is a technique used by data scientists as a part of feature engineering. This technique is utilized when the raw data is unsuitable for analysis. The main objective of feature extraction is to convert the raw data into numerical features that can be used by machine learning algorithms using Histogram of Oriented Gradients (HOG). It is often used when working with image files, as data scientists can extract specific features like object shapes or color values to create new features that are appropriate for machine learning applications. This step enables machine learning models to learn from the data and make accurate predictions. The formula for HOG is given as:

D. Training & Classification
Training involves the process of feeding a large amount of data images of plant leaf to the DNN, adjusting the weights between neurons, and minimizing the error between the actual and predicted values. During training, the model tries to find the best possible set of weights that can produce the most accurate output. This process is repeated for several epochs until the model can accurately predict the output.
The formula for training accuracy (Acctrain) is given as:

Classification involves using the trained model to predict the output of unseen data. Once the model is trained, it can be used to classify new data by passing the input through the network and generating an output. The output is compared to the actual output to evaluate the accuracy of the model. If the accuracy is not satisfactory, the model may need to be re-trained using more data or fine-tuning of the parameters.
E. Convolutional Neural Network Model
The size of each input image is (50, 50, 3). Keras generally processes images in batches of fixed size. So, an extra dimension is added for this purpose. Since batch size is treated as a variable, the value changes depending on the size of the dataset. So, its size is represented by None. Therefore, the input shape becomes (None, 50, 50, 3). Convolving a (50, 50) image with a (2, 2) filter, with strides and dilation rate of 1, and ‘same’ padding, results in an output of size (50, 50). Since there are 16 such filters, the output shap becomes (50, 50, 16).The MaxPooling layer with stride as 2 takes the output of the convolution layer as input. The pooling layer divides the size of the image by 2 thus leaving the output shape of this layer to (25, 25, 16).This pattern can be extended to all Conv2D and MaxPooling layers. The Flatten layer converts the pixels into a long one-dimensional vector. Therefore, an input of (6, 6, 64) is flattened to (6 * 6 * 64) resulting 2304 parameters. The number of parameters for a Conv2D layer is given by the following Equation:
????????????????????????????????????=(???????????????????????? ??????????????????*???????????????????????? ?????????????????*???????????????????? ?????????????????????????*???????????????????????? ?????????????????????????)+(???????????????????????? ????????????????????????????? ????????????? ???????????? ????????????????)
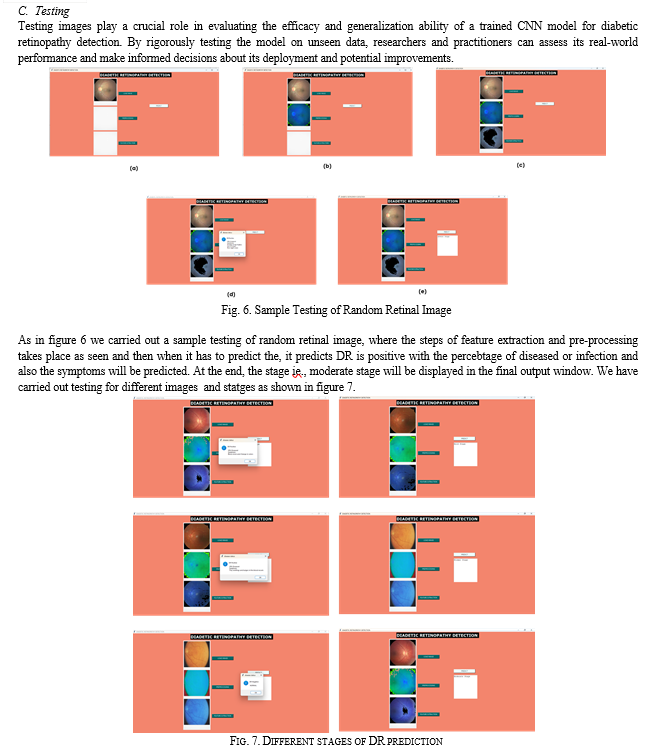
The CNN model is trained for different epochs with numerous observations in each epoch. Accuracy and loss for each epoch is calculated. After the training process is done, the model is tested on the test images. A confusion matrix with true positives, true negatives, false positives and false negatives is created. Figure 8 shows the obtained confusion matrix. The accuracy of this CNN model is found to be 75.61% which is not very impressive.
IV. RESULTS AND DISCUSSION
A. Graphical User Interface
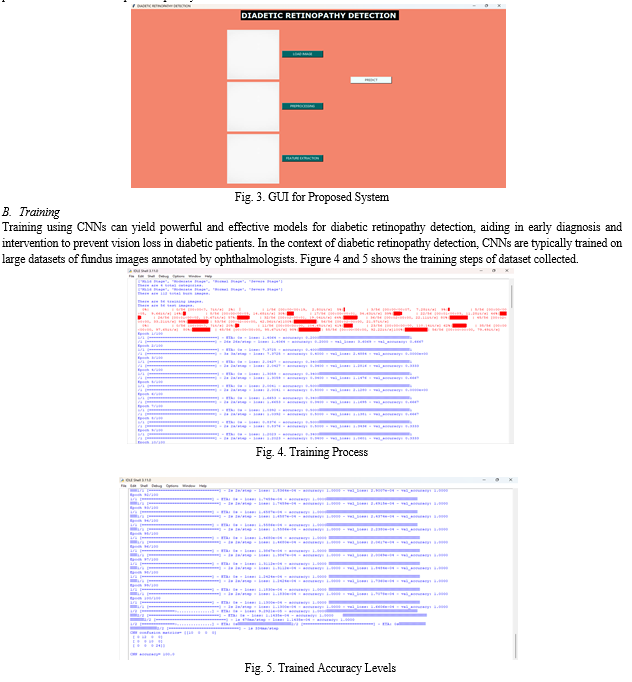
There are various options available in Python for creating a Graphical User Interface (GUI). However, we are using tkinter in our proposed concept. This is because it is a standard Python interface to the Tk GUI toolkit that comes bundled with Python. With tkinter, Python provides a simple and efficient way to develop GUI applications. Using tkinter, creating a GUI is a straightforward process that can be accomplished quickly.


Conclusion
The development and evaluation of the proposed model for diabetic retinopathy (DR) detection represent a comprehensive and systematic approach towards enhancing the early diagnosis and management of this vision-threatening condition. The model\'s inception involves meticulous data collection from diverse sources, followed by precise labeling of the dataset to facilitate supervised learning. Through the deployment of a deep learning framework, the model undergoes rigorous training and validation processes, where it learns to discern intricate patterns and features indicative of DR within fundus images. Subsequently, the model\'s accuracy is rigorously assessed to ensure its reliability in real-world applications. Upon deployment, the model seamlessly classifies unseen images into DR-positive and DR-negative categories, enabling swift and accurate identification of patients at risk. By leveraging cutting-edge technology and real-time analysis capabilities, the proposed model not only aids in the timely detection of diabetic retinopathy but also serves as a valuable tool for healthcare professionals in their decision-making process. This holistic approach underscores the model\'s potential to revolutionize DR screening protocols, ultimately leading to improved patient outcomes and vision preservation for individuals affected by this debilitating condition.
References
[1] Yau, J.W.Y.; Rogers, S.L.; Kawasaki, R.; Lamoureux, E.L.; Kowalski, J.W.; Bek, T.; Chen, S.J.; Dekker, J.M.; Fletcher, A.; Grauslund, J.; et al. Global Prevalence and Major Risk Factors of Diabetic Retinopathy. Diabetes Care 2012, 35, 556–564. [CrossRef] [PubMed] [2] Diabetic Retinopathy|AOA. Available online: https://www.aoa.org/healthy-eyes/eye-and-vision-conditions/diabetic- retinopathy?sso=y (accessed on 12 April 2022). [3] Diabetic Retinopathy Data and Statistics|National Eye Institute. Available online: https://www.nei.nih.gov/learn-about-eye- health/outreach-campaigns-and-resources/eye-health-data-and-statistics/diabetic-retinopathy-data-and-statistics (accessed on 12 April 2022). [4] Diabetic Retinopathy: A Growing Challenge in Pakistan|Blogs|Sightsavers. Available online: https://www.sightsavers.org/ blogs/2021/06/diabetic-retinopathy-in-pakistan/ (accessed on 5 August 2022). [5] Li, X.; Hu, X.; Yu, L.; Zhu, L.; Fu, C.W.; Heng, P.A. CANet: Cross-Disease Attention Network for Joint Diabetic Retinopathy and Diabetic Macular Edema Grading. IEEE Trans. Med. Imaging 2020, 39, 1483–1493. [CrossRef] [PubMed] [6] Kumar, P.N.S.; Deepak, R.U.; Sathar, A.; Sahasranamam, V.; Kumar, R.R. Automated Detection System for Diabetic Retinopathy Using Two Field Fundus Photography. Procedia Comput. Sci. 2016, 93, 486–494. [CrossRef] [7] Zhu, C.Z.; Hu, R.; Zou, B.J.; Zhao, R.C.; Chen, C.L.; Xiao, Y.L. Automatic Diabetic Retinopathy Screening via Cascaded Framework Based on Image- and Lesion-Level Features Fusion. J. Comput. Sci. Technol. 2019 346 2019, 34, 1307–1318. [CrossRef] [8] Sambyal, N.; Saini, P.; Syal, R.; Gupta, V. Modified Residual Networks for Severity Stage Classification of Diabetic Retinopathy. Evol. Syst. 2022, 1–19. [CrossRef] [9] Khan, A.I.; Kshirsagar, P.R.; Manoharan, H.; Alsolami, F.; Almalawi, A.; Abushark, Y.B.; Alam, M.; Chamato, F.A. Computational Approach for Detection of Diabetes from Ocular Scans. Comput. Intell. Neurosci. 2022, 2022, 1–8. [CrossRef] [10] Ali, R.; Hardie, R.C.; Narayanan, B.N.; Kebede, T.M. IMNets: Deep Learning Using an Incremental Modular Network Synthesis Approach for Medical Imaging Applications. Appl. Sci. 2022, 12, 5500. [CrossRef]
Copyright
Copyright © 2024 Sridhar N, Chandana M, Kusuma H M, Namratha M K, Sneha R. This is an open access article distributed under the Creative Commons Attribution License, which permits unrestricted use, distribution, and reproduction in any medium, provided the original work is properly cited.

Download Paper
Paper Id : IJRASET61225
Publish Date : 2024-04-29
ISSN : 2321-9653
Publisher Name : IJRASET
DOI Link : Click Here
 Submit Paper Online

