Ijraset Journal For Research in Applied Science and Engineering Technology
- Home / Ijraset
- On This Page
- Abstract
- Introduction
- Conclusion
- References
- Copyright
Cost-Effective Dust Detection on Solar PV Panels through Deep Learning: A Step towards Automated Maintenance Systems
Authors: Jeewan Rai, Kinzang Rangdrel Lhendup, Yeshi Jigme Choden
DOI Link: https://doi.org/10.22214/ijraset.2024.64443
Certificate: View Certificate
Abstract
Accumulation of dust on solar panels impacts the overall efficiency and the amount of energy it produces. Detecting and mitigating dust accumulation is therefore crucial for optimizing solar energy production. While various techniques exist for detecting dust to schedule cleaning, many of these methods uses licensed software like MATLAB, which can be financially burdensome. This study proposes the use of modified pre-trained ResNet-50 model architecture with an adjusted fully connected layer for binary classification. An experimental setup was installed utilizing a single 75 Wp panel with an inclination maintained at 30-degree angle. The fine dirt particles were artificially introduced and datasets of images of clean and dusty panels were collected from five different sides were taken, to compensate for the surface reflectance from the PV panel due to camera angles. Those datasets were used to train and test the model and the accuracy achieved was 90%. The model\'s ability to detect dust with minimal false positives ensures more efficient maintenance scheduling. This research demonstrates the potential of AI-driven dust detection systems to enhance the operational efficiency of solar PV installations.
Introduction
I. INTRODUCTION
Solar PV energy has become important energy mix of the 21st century that aims to answer both energy security questions and mitigate the environmental challenges faced. The performance of any solar system is dependent on various factors starting from the tilt angle of the panel to the path of the sun. One of the important factors that needs considerable attention is the soiling of PV panels due to accumulation of dirt. This is because the output of the solar system tends to decrease with increased dust accumulation on the panel.
To address this challenge, our study aims to provide cheaper alternatives for carrying out detection of accumulated dust through Deep Learning Neural Network Model. Specifically, the ResNet-50 architecture is adopted as it provides better classification performance than other models. This approach aims to offer cost-effective method for monitoring and managing the soiling of PV panels, thereby enhancing their efficiency and overall performance.
II. LITERATURE REVIEW
Deep learning is defined as a technique within the machine learning that uses networks to learn from data. Deep residual network or ResNet is one of the models developed by He et al., in 2016 [1]. The ResNet models provide advantage over other models as the performance of this models doesn’t decrease at the time when the architecture gets deeper [3].
Liang (2020) [2]: ResNet-20 deep learning model was used for image classification due to its better classification performance than other modules due to its ability to address challenges in dep neural network such as vanishing gradient. The study compares ResNet with other model’s performance using CIFAR-10 dataset which confirms the former architecture’s significant accuracy in image recognition task.
Sarwinda et al., (2020) [3]: The authors investigate use of ResNeT architecture in image classification for detection of colorectal cancer. ResNet-18 and ResNet-50 model architecture. ResNet-50 has higher accuracy than ResNet-18. ResNet variant has proved to detect colorectal cancer with accuracy between 73-88%.
Liu (2023) [4]: The author uses ResNet-50 deep convolutional neural network architecture for developing face recognition technology. The study utilized OpenCV for dataset collection and pre-processing, including random brightness adjustments.
This model achieved high accuracy and precise facial recognition with a learning rate of 0.001 or 0.002. The experimental results highlight high accuracy rates up to 98.75% with optimal training parameters.
Yadav et al., (2021) [5]: The author uses both traditional and deep learning techniques for automating food image classification in developing diet monitoring systems. Pre trained SqueezeNet and VGG-16 Convolutional Neural Network are used for food image classification. These models improve the classification accuracy using the Food-101 datasets where VGG016 model achieved higher validation accuracy of 85.07% compared to SqueezeNet’s 77.02%.
ResNet-50’s main advantage over other networks is its ability to train very deep networks with hundreds of blocks using residual blocks and skip connections for preservation of information from earlier layers.
II. METHODOLOGY
All paragraphs must be indented. All paragraphs must be justified, i.e. both left-justified and right-justified.
A. Experimental Set up
The team used a single 75Wp Poly crystalline PV panel with an inclination maintained at 30-degree angle. This angle was maintained as per the Lat & Long of Bhutanese terrain. Following items were used in making the experimental set up.
TABLE I
EQUIPMENT USED
|
SL No |
Items |
Technical Specs |
|
1 |
PV Panel |
75Wp, 12V, 4.23A |
|
2 |
iPhone 13 |
Main Camera |
|
3 |
Tri pod stand |
- |
|
4 |
Sieve |
Standard |
|
5 |
Solar Power Meter |
METRAVI pro IM-09 |
|
6 |
Geological Compass |
For measurement of Azimuth & angle |
|
7 |
Weight machine |
Model No: SF 400
|
The experiment was setup as shown in the figure below:
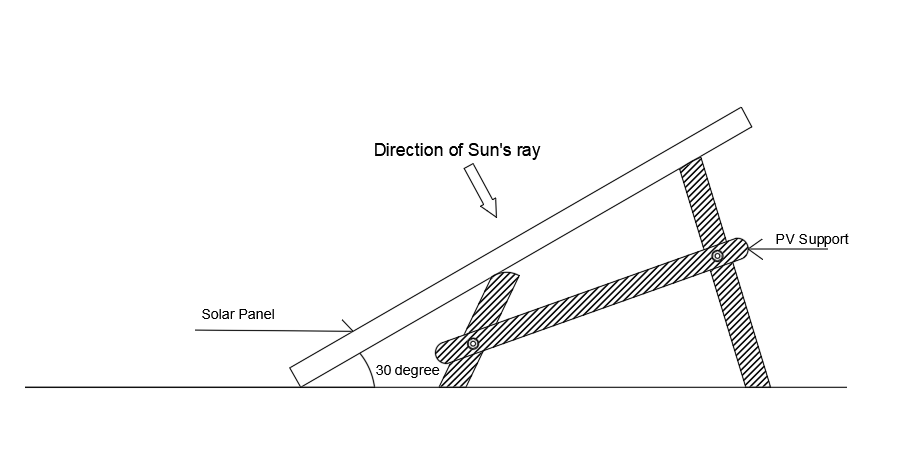
Fig. 1 Experimental Setup
B. Experiment and Data Collection
For this study, images of Clean and Dirty PV panels from five sides of the panel, at varying angles and irradiance condition was collected. From each side 10 different images were collected from 10 different angles. This was done to fully cover the image reflectance of PV at different angle. Each of these images underwent data augmentations to generate more data set. This helped to increase the size of the dataset and improve the generalization of the model without needing to collect more data.
Following picture represents the angle at which pictures were taken.
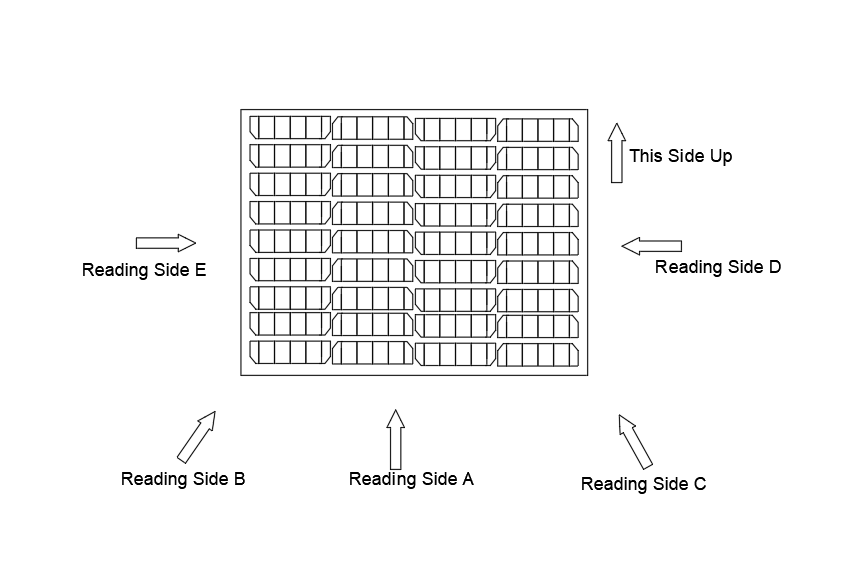
Fig. 2 Angle of pictures taken
- Clean PV panel: Image data for this condition was collected using the technique stated above. This image data would serve as a baseline for comparing the surface reflectance from the PV panel against the dusty ones.
- Dirty PV panel: The fine dirt particles were artificially introduced and datasets of images of dusty panels were collected. For dirty PV data collection, six different stages of dusting were carried out; from introduction of 5gm of dirt until the panel surface became completely opaque. This alone generated 300 unique image data. This data set underwent further augmentation. Figure below shows the image data collected for dusty PV panel.
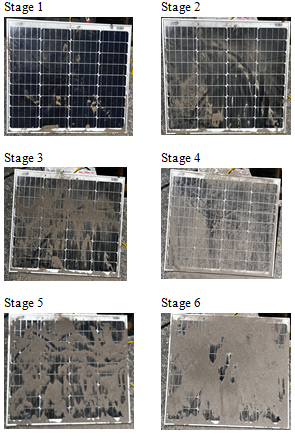
Fig. 3 Image dataset collected for dusty PV panel
3. Additional images from the internet: In order to compensate for the possible overfitting issues within the model, image data set from the Kaggle Dataset were used to further train the model in detecting the dust on the PV surface.
The total of 674 images were collected out of which 30% was for clean PV whereas remaining 70% was for dusty PV surface (of varying dirt condition). These images were necessary to prevent over fitting of the model and also to generalize the model training so that it cannot only detect dirt on our experimental PV surface but also on other PV surfaces. These images further underwent same augmentation as that of the experimental images collected.
C. Model Development and Image processing
In the field of Artificial Intelligence (AI), computer vision, ResNet-50 has emerged as popular and efficient deep neural network which is capable of object detection, image classifications, and image segmentation [6]. Thus, for extracting more features and insights of the data, more numbers of layers are integrated which can lead to issues such as overfitting or vanishing gradient problems. The gradient shrinks exponentially as more and more layers are added in the network resulting in learning of the model to stall where data fed into network slows down and clogged eventually [7]. The issue has been addressed using ResNet-50 architecture where the network contains skip links (or shortcut/bypass) which skips some of the layers, allowing more faster and stable training process.
The images collected from the experimental setup and Kaggle Dataset were used to train the model for more general approach in detection dust on PV surface. The deployed approach was aimed at balancing the dataset of clean and dirty images. However, since the level of dust collected by the PV surface varies in practice, more emphasis was given on collection of dusty PV surface images. Hence, 75% of dusty images were used in total from 1024 image data collected.
These 1024 images underwent data augmentation process whereby each image data was cropped and zoomed to generate additional 1024 images. In addition to this, 50% of the 1024 images were rotated bringing the total generated and collected image to 2560 numbers. These augmentation techniques were deployed using torchvision.transforms module. The image size used were 512x512 with the convolution kernel size of 3x3. Of the 2560 images, 90% were used for training the model while remaining 10% were used for validation of the trained model.
The Sequential Model provides foundation for adding multiple convolution layers with different parameters and multiple fully connected layers. Stacking multiple CNN layers one by one in neural network progressively extract and abstract features using kernel/filter on the in the input image. Application of multiple filters on to images helped detect patterns on the original image such as edge, corners points, texture, etc. The layers in the network stack up and combine all extracted basic features into more complex representations of the original image.
D. Simulation and Result discussion
1) Accuracy Vs Losses
The provided plot illustrates the model's performance dynamics in terms of training and validation losses. The upper curve represents the improvement in training accuracy, while the lower curve depicts the validation losses throughout the training period. As the training progresses, the model demonstrates enhanced performance, with losses gradually decreasing over time. This reduction in loss suggests that the model is making increasingly accurate predictions. The accuracy curve shows a corresponding increase, indicating that the model is progressively improving its ability to correctly classify instances. Convergence is achieved when the learning curve stabilizes, signifying that the model has effectively learned the features from the training data and has reached its optimal performance [8].
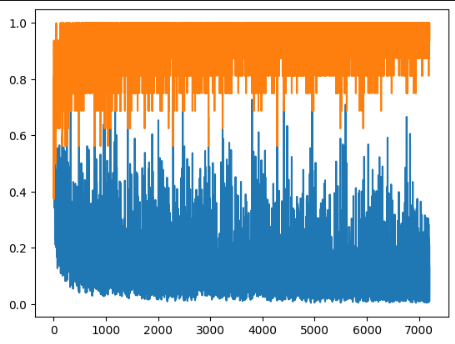
Fig. 4 Accuracy Vs Losses
2) Confusion matrix
The binary classification model effectively distinguished between dusty and clean solar panels, demonstrating high accuracy in its predictions. The model's effectiveness is evidenced by the minimal occurrence of false classifications and a high number of correct predictions relative to errors.
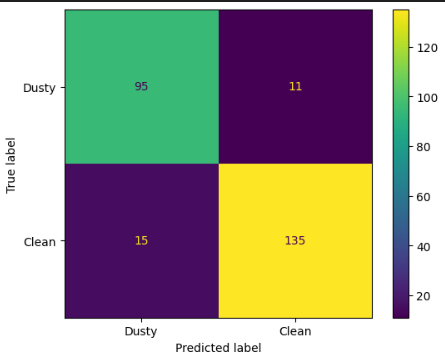
Fig. 5 Confusion Matrix
3) Classification Report
F1 score interpreted harmonic mean of precision and recall where F1 score 1 means best value and 0 means worst score (sklearn.metrics.f1_score). The harmonic means is types of mean operation which provide balanced view of taking both precision and recall into consideration trying to balance to achieve good performance of the mode. The f1 score are more influenced by the minimum value of the arithmetic operation, eventually reflecting overall effectiveness of model.
The model performance in both the classes; dusty and clean images demonstrate strong performance with overall accuracy of 90%. Both precision and recall are high for both the classes, but slightly higher for clean class compared to dusty class of solar panel. The model has a recall value of both the classes at 90% indicating the model has effective ability to correctly identify maximum number of true positives.
The model also shows a strong F1 score on both the classes indicating proper balance between precision and recall. The model performances are consistent across classes suggesting each class is treated equally as the macro average F1_score is 90%. Similarly, weighted average F1_score as well is 90% implying the model is performing robustly when considering the class distribution, reflecting model’s effectiveness on the dataset. Overall, the model is balanced well and efficiently performing classification on both dusty and clean images.
TABLE II
CLASSIFICATION REPORT
Precision recall f1-score support
Dusty 0.86 0.90 0.88 106
Clean 0.92 0.90 0.91 150
Accuracy 0.90 256
Macro avg 0.89 0.90 0.90 256
Weighted avg 0.90 0.90 0.90 256
4) Result
The model trained appears 90% over all accuracy however the model exhibits minor discrepancies distinguishing clean and dusty panel, still predicting 88% accurately on unseen dataset. The training and validation curves showed that the model improved over epochs, with decreasing loss and increasing accuracy. This indicates effective learning and reduction in misclassifications over time. The binary classification model successfully differentiated between dusty and clean solar panels with high accuracy. The model demonstrated minimal false classifications and accurate predictions overall.
The F1-Score balances precision and recall, providing a comprehensive measure of model performance. The high F1-scores and overall accuracy (90%) reflect the model’s strong performance. This study demonstrated that ResNet-50 can accurately distinguish clean and dusty panels, with an overall accuracy of 90%.
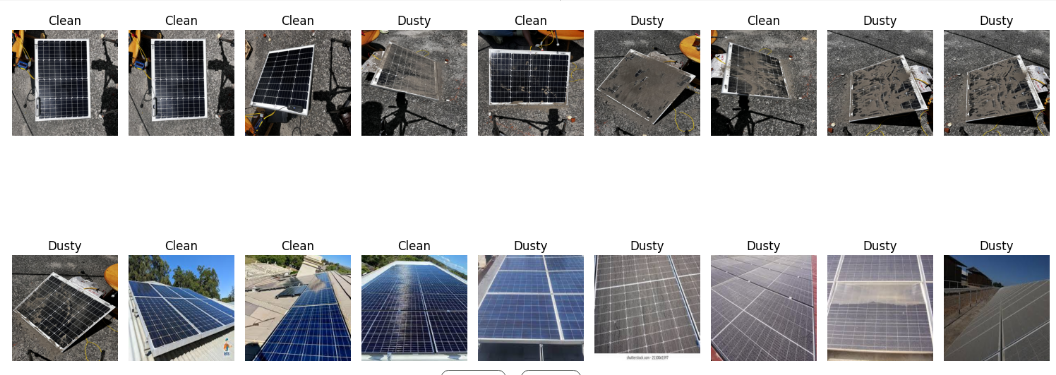 Fig. 6 Dataset used
Conclusion
This paper shows that a cost-effective alternative solution could be deployed to the actual solar farm site without the requirement of advanced system. Detecting any foreign object on the panel can potentially hamper both the generation as well as the physical integrity of the panel due to the loss of generation power and formation of heat spots. The deployment of such system in Bhutan would be a crucial part for enabling the optimum generation of solar power for answering larger energy security questions.
References
[1] He, K., Zhang, X., Ren, S., & Sun, J. (2016). Deep residual learning for image recognition. Proceedings of the IEEE conference on computer vision and pattern recognition, 770-778. [2] Sarwinda, D., Paradisa, R. H., Bustamam, A., & Anggia, P. (2021). Deep Learning in Image Classification using Residual Network (ResNet) Variants for Detection of Colorectal Cancer. Procedia Computer Science, 179, 423–431. https://doi.org/10.1016/j.procs.2021.01.025 [3] Liang, J. (2020). Image classification based on RESNET. Journal of Physics Conference Series, 1634(1), 012110. https://doi.org/10.1088/1742-6596/1634/1/012110 [4] Liu, J. (2024). Face recognition technology based on ResNet-50. Applied and Computational Engineering, 39(1), 160–165. https://doi.org/10.54254/2755-2721/39/20230593 [5] Yadav, S., Alpana, N., & Chand, S. (2021). Automated food image Classification using Deep learning approach. 7th International Conference on Advanced Computing & Communication Systems (ICACCS). https://doi.org/10.1109/icaccs51430.2021.9441889 [6] Wisdomml. (2023, March 30). Understanding ReSNet-50 in depth: architecture, skip connections, and advantages over other networks -. Wisdom ML. https://wisdomml.in/understanding-resnet-50-in-depth-architecture-skip-connections-and-advantages-over-other-networks/ [7] Agrawal, Sanjay A., Rewaskar, Vaibhav D., Agrawal Rucha A., Chaudhari, Swapnil S., Patil, Yogendra & Agrawal Nidhee S. (2023, August 8). Advancement in NSFW Content Detection: A comprehensive Review of ResNet-50 Based Approaches. International Systems and Applications in Engineering. [8] W&B. (2024, August 20). Weights & biases. W&B. https://wandb.ai/mostafaibrahim17/ml-articles/reports/A-Deep-Dive-Into-Learning-Curves-in-Machine-Learning--Vmlldzo0NjA1ODY0#:~:text=In%20the%20simplest%20terms%2C%20they,and%20the%20actual%20true%20output.
Copyright
Copyright © 2024 Jeewan Rai, Kinzang , Yeshi Jigme Choden. This is an open access article distributed under the Creative Commons Attribution License, which permits unrestricted use, distribution, and reproduction in any medium, provided the original work is properly cited.

Download Paper
Paper Id : IJRASET64443
Publish Date : 2024-10-03
ISSN : 2321-9653
Publisher Name : IJRASET
DOI Link : Click Here
 Submit Paper Online

