Ijraset Journal For Research in Applied Science and Engineering Technology
- Home / Ijraset
- On This Page
- Abstract
- Introduction
- Conclusion
- References
- Copyright
Data Visualization & Analysis of Disease X [Nipah Virus]
Authors: Sankalp Indish, Sanjay Agrawal, Vikas Chavan, Pratiksha Surse
DOI Link: https://doi.org/10.22214/ijraset.2024.61702
Certificate: View Certificate
Abstract
This article is about performing mathematical analysis and visualization of data that was researched and collected about Nipah Virus; which is treated as Disease X[deadly disease] by World Health Organization. It includes information about the field of Data Analysis and Visualization techniques which associate closely with current era and the project itself. Furthermore, there is description which provides information about the main application developed and implemented. The variety of research papers that were made use of, along-with significantly valuable data are cited too. Data Analyses has very close connection with data science, however, the key difference lies in its actual working, as Data Analysis makes extensive use of historically available data & generates important insights from them, which are very considerable for future operations. Thus, due to such complex level usage, Data Analysis has gained recognition in the recent years, which makes it important for professionals to add it as a part of daily life tasks. When it comes to real time usage, Data Analyses is used for many purposes which includes but is not limited to customer preferences, finance sectors, research in markets and also in assessment of variety of risks. Data Analysis thus, has introduced a massive number of futuristic achievable tasks by taking important notes from the ones that were conducted in the past.
Introduction
I. INTRODUCTION
A well-being & harmonized life is considered as the need of today’s world of changing technology and atmosphere. At the time when CoViD shook the world, it was a very difficult situation to tackle due to lack of making the best use of technologies to predict the occurrence of such diseases. This in turn resulted into many economic and life losses which ultimately affected the lives of human in a negative way. Data Analysis, has been observed to be a valuable field in the history of 5 years and is growing rapidly today. This progress is exceptional in the field of healthcare. The project takes motivation as a mix of the stated ideas. In the project that we developed, we came to a thought of making use of Data Analysis to predict, can there be any kind of cases in world related to NiV just like CoViD? If yes, can that specific number be recognized. This was really a thoughtful process, as prediction of number will ultimately lead to taking precautionary measures and boost the process of vaccine preparation. We found NiV, as a great place of initiation because the available data is very limited, and yet, is listed as Disease X by WHO. Though the process of vaccine is currently ongoing, our belief is that the project will help to boost the progress of vaccine development so relative measures will be ready for execution. Though the values are predicted, there are many changes that could be made in-order to improve the statistics being generated.
A. Data & Big Data Analytics Today
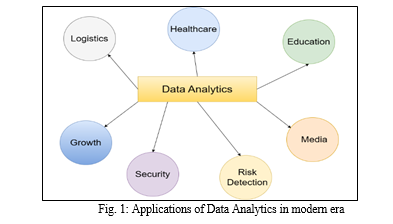
Data Analysis became a popular & progressive field in 21st Century. It gained a huge popularity in variety of markets due to its major features that drive heavy businesses today. Not only did Data Analyses very much evolve into Big Data Analysis, it also progressed in terms of usability and applicable scenarios. It’s a revolutionary field as mathematics which was once used only for computational purposes is now used for prediction in almost all IT companies, Hospitals, Banks and many such facilities. The prediction is very accurate if data is properly managed and loopholes are filled. The data not only shows the current progress of the applied field, but also helps to take better procured decision from the generated analytics for the future.
Below is a figure [15] that shows the extensive use of Data Analysis in variety of fields. These fields are subjective, and may increase or get sub-divided in future, based on how they mature ahead.
B. Overview of the Developed System
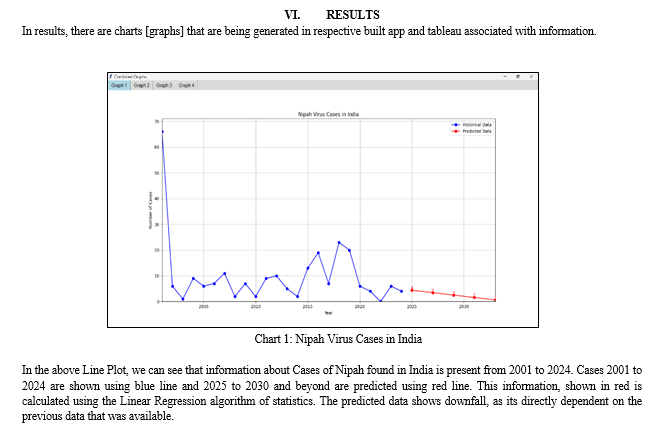
The main purpose of the system that we built is straightforward. To provide predicted values based on supplied historical data and generate visual graphs for the same. The values that are provided are mostly researched, however, to get better results, we have assumed certain values, so that accuracy stays constant. The assumed values will be certainly defined ahead in the document, however, it’s worth noting, that if Actual data becomes readily available, exceptionally from WHO itself, then the project can surely be modified accordingly with ease. As the data of NiV cases was limited, the certain number of cases are added, which will be discusses further ahead. However, this does not change the reliability and potential of the prediction that is being made. The surety of this comes from the point, that we tested this algorithmic implementation on bunch of data that was available about CoViD and it provided the results that were present in real with no errors or misreading’s.
Software evaluates information about the following:-
- The number of predicted cases in the countries: India, Malaysia and Bangladesh in the coming years.
- The relativity between the species of bats that spread the virus, and the states of the countries where the bats are probable to spread NiV.
And, Tableau evaluates about:-
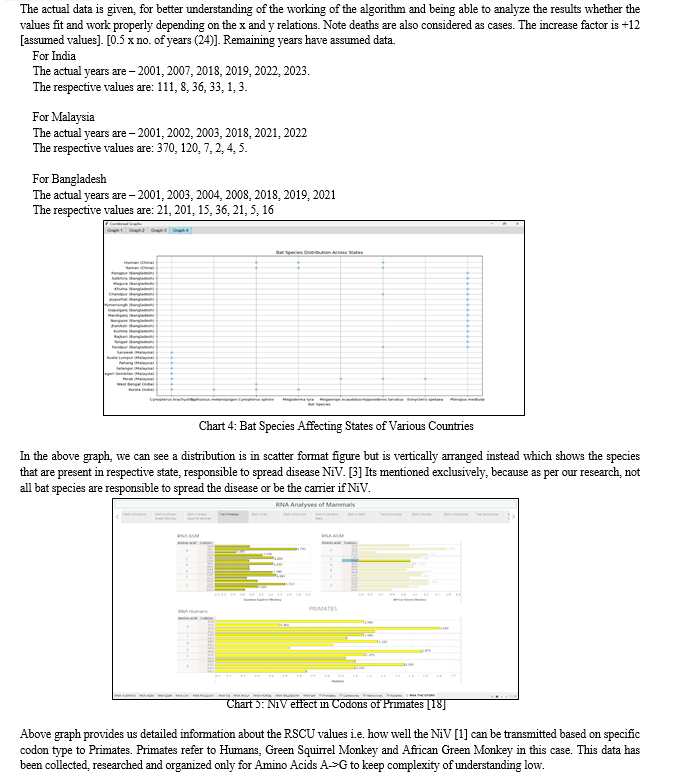
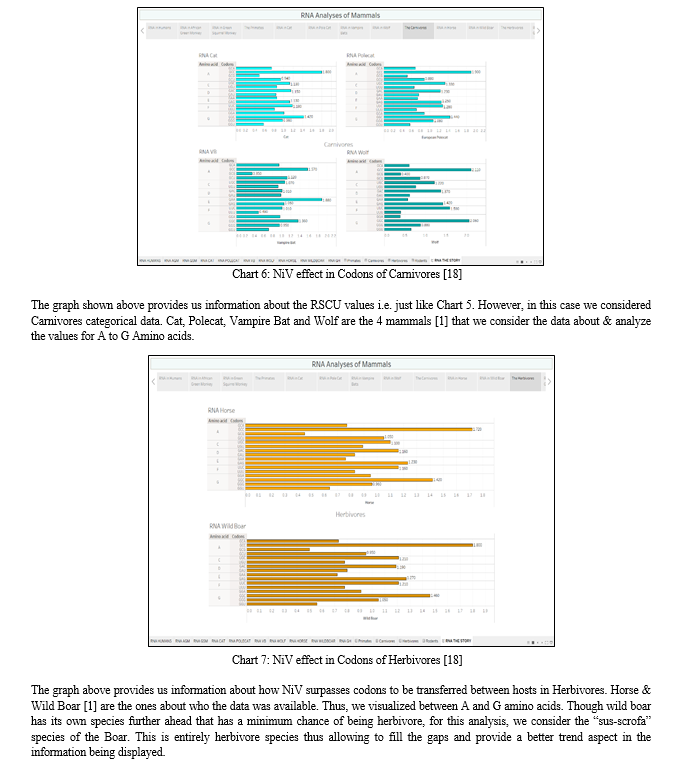
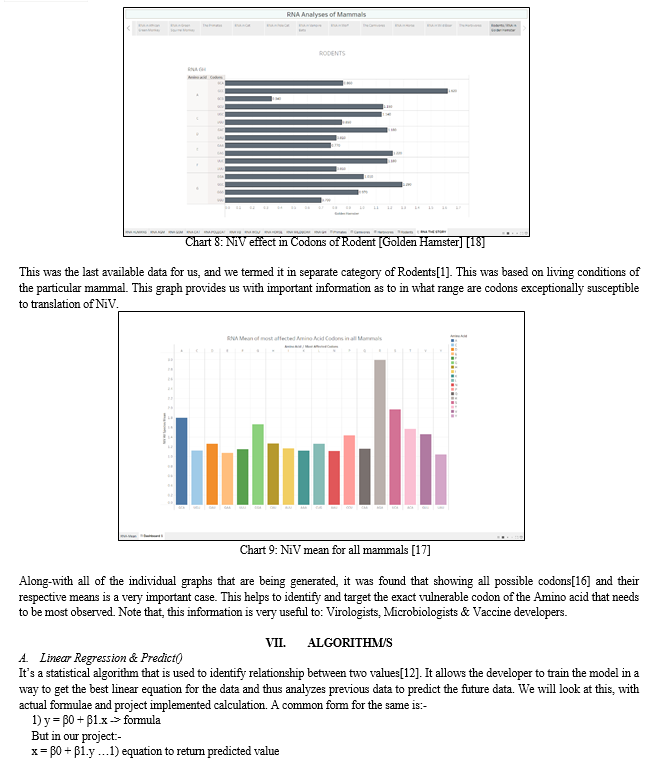
a. The effect that can happen on RNA of various mammals based on the codons and amino acids, with proper indication of types.
II. HEALTHCARE MARKET OF BIG DATA ANALYTICS
As discussed earlier, Data analysis is used very extensively in various fields. However, one of the most prominent fields is healthcare. There were more than 2000 papers published for Data Analysis and its involvement in healthcare from 2000 to 2021[4]. And the count still keeps growing.
This is due to many use cases that are being released into market every month. Data Analysis has become a core part of healthcare field and is relatively important for better sustenance and improved health of patients [7]. It’s also being used to provide personalized health treatments and medicines so the recovery time is relatively reduced for patients [5]. DA has played major role in the management of the health of entire population by generating good and productive results [6]. Due to remote monitoring of patients that has become possible, number of victims to death have been considerably reduced [8]. Data Analysis continues to develop and help patients stay engaged to the information they receive and understand thus making sure, they focus more on their personal health as well [9].
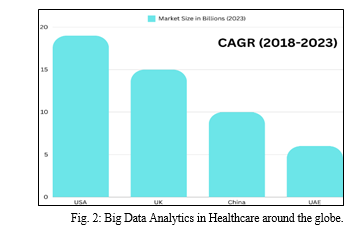
Following the information, is the graph [14] that shows the market for Big Data Analytics that is in healthcare since 2018 to year 2023 for best understanding. The graph indicates market size in billions of the respective countries. It should be noted, that many countries like India, will also be considered as scaling country if data is considered between 2020 to 2024.
III. LITERATURE REVIEW
NiV is a hazardous and life-threatening type of pathogen that continues to be a significant threat to the health of people all around the world. It was discovered in Malaysia and survey was conducted for as to which species of Bat pose the most threat [2]. Also, the areas affected were shown differently which allowed a broader study of the virus. Study was specifically made for India and mapped with other countries based on the availability of species.
Similar kind of survey was made to analyze which areas are under threat around the globe for each specific country[3]. The broad type of variance was plotted for South and Southeast Asia. The biogeography was matched accordingly and thus, relative charts were prepared. The study was conducted for the niche modelling of ecology too, which yielded significant outputs. Risk mapping was the most beneficial result of the process.
Analysis was made on the grounds of cases of NiV being reported in India [1]. The objective was to find how well the NiV adapts to the hosts. To bridge the gap as to how the possibility might be put forth, several amino acids and respective codons were considered for research. Codon usage analysis was made based on the available data of the sequence of the nucleotide of the NiV. RSCU heat mapping yielded results which portrayed the most susceptible codons.
IV. TECHNOLOGIES USED
The project has been made possible by a mix of various technologies. These helped us, to bridge variety of gaps and build a useful & insightful system.
A. Python Tkinter
Python is a high-level programming language that is prominently used for AI and its application level projects which include Deep Learning, Neural Networks, Data Science and Cloud Computing. All of these fields deal with heavy data and datasets which requires complex and fast computing, which is one of the service/functionalities provided by Python due to its massive libraries.
We made use of Python to build a dashboard [10] like structure for the graphs that are being generated through rigorous analysis. Thus, instead of 4 types of graphs being made available separately, they can be selected upon user preference. This is use is currently, just for visual ease. The libraries used were: scikit-learn, matplotlib, pandas and openpyxl.
B. MS-Excel
Microsoft Excel is a software developed by Microsoft, and is a part of MS-Office that helps to generate workbooks and manage important data in an organized and structured manner. This can be very efficient as it also provides integrability with other software’s that produce data based on some old available data.
The data that we have is for about < 25 years. Thus, to allow future operations to run smoothly, i.e. to be able to include upcoming years data that becomes available too, we used Excel, so that management operations will be easy, rather than using statically challenged data structures.
C. Tableau
Tableau is a data visualization tool or in-fact a software that provides the ability to develop interactive and shareable dashboards and graphs that are generated on those dashboards to multiple users. Reports are also generated thus providing noteworthy information to the viewers in a well-defined manner.
We didn’t want our project to be rigid and console based. As performed Data Analysis, we thought of making use of latest technology of Tableau in order to have flexible and dynamic view of the RNA data specifically[11]. Also, Tableau provides a much cleaner output for the data about RNA which is vast comparing the new comers in future. It also reduced the weight of our application.
V. SYSTEM ARCHITECTURE
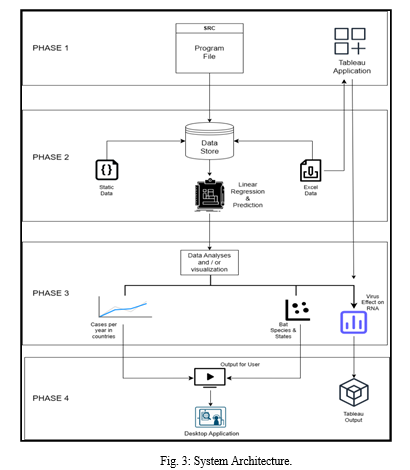
The architecture of the entire project [System] is made up of 4 total phases each of which will be explained in definite details. The phases information is as follows:-
- Phase 1: Application & Tableau run.
- Phase 2: Extraction and processing of data in the application and providing data to tableau directly.
- Phase 3: Visualization process.
- Phase 4: Demonstrating the output to the user in 2 different windows.
The following figure represents the system architecture of the project:-
a. Phase 1
In phase 1, 2 components are present. One is the source file / python code and the other is the Tableau Application. The python file is responsible to generate the results by making use of the actual code logic and fetching data from data store excel component present in Phase 2. The Tableau software also works in co-ordination of excel component and uses the data to present a visual aspect of the relation. Thus, Tableau performs task of data understanding and visualization.
b. Phase 2
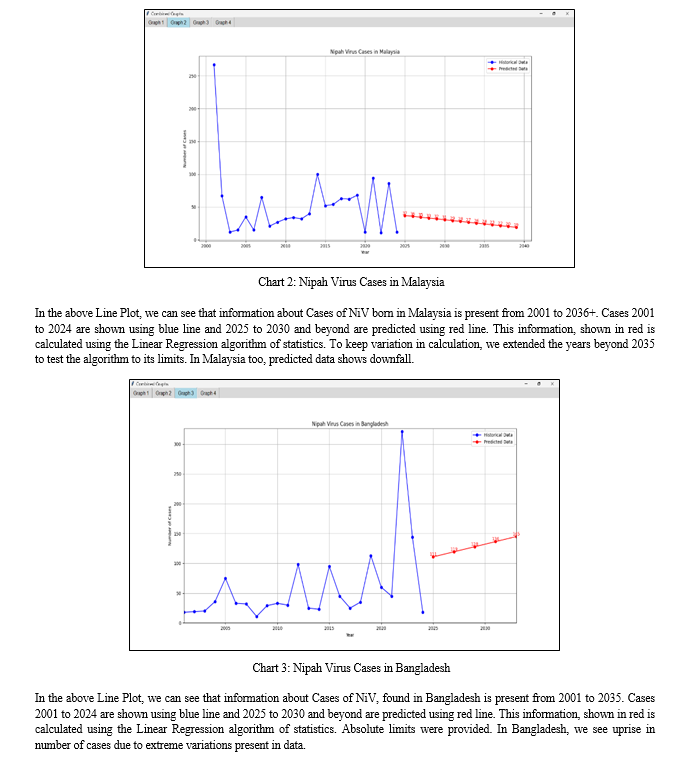
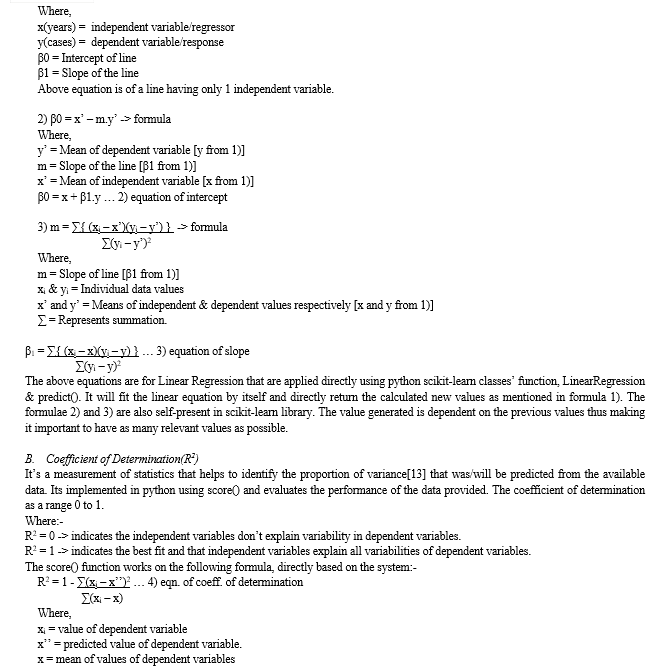
In phase 2, 4 major, core components are present. The static data, that is seen is about the bat species present in relative states that spread virus which is in the form of array-based dictionary. The states are for countries: India, China, Malaysia & Bangladesh. The excel data, is about the years from 2001 to 2024, and the columns containing the data about cases in India, Malaysia and China. The component of Linear Regression & prediction, is discussed later.
c. Phase 3
In phase 3, we have a process that is Data Analyses and/or visualization. This is the generation of actual graphs in application and on Tableau. Tableau application directly demonstrates data and thus is not a primary part/subpart of the process. However, since the graphs presented in Tkinter application are from analysis, we can see direct sub-points of bat species and cases per year. Cases per year are presented in line plot and the bat species is a scatter vertical line plot type [2] figure indicating direct relations.
d. Phase 4
It’s the last phase of the application, wherein all of the actual output to the user is shown in form of graphs. As the application is currently not made an exe, we keep it after the output. Also, the output generated by Tableau will be quite separate, due to it being a different software.
VIII. FUTURE SCOPE
The system is made with data that was researched and found as far as possible. NiV cases are distributed randomly based on data available in NCBI and WHO and thus required rigorous searching. Thus, system is developed for information calculation purposes and only and is not portrayed to public due to reliability concerns. However, algorithms work at their probable best. Once the data becomes completely reliable, the calculated values can be transferred into a .csv or .xlsx file for further knowledge and can be made public directly by developing professional Tableau dashboard for the same.
This in turn can also be improvised to take in real time data and provide real time visuals to public for warning or precautionary purposes. Also, the system is not limited to NiV only, but can be made for all types of viruses and information that is not related to just viruses itself.
IX. CREDIT AUTHOR STATEMENT
Asst. Prof. Sanjay Agrawal & Asst. Prof. Vikas Chavan: Guided & mentored through the process of project and paper publication.
Sankalp Indish: Performed tasks of gathering most relevant data, performing mathematical computations, building sophisticated algorithms, data visualizations and putting the main system together.
Pratiksha Surse: Gathered data about mammals and species, RNA and Cases.
X. DECLARATION OF COMPETING INTEREST
The authors declare that there are no conflicts of interest.
XI. ACKNOWLEDGMENTS
Making this project a good success was a combined work of many people including my team. Utmost & sincere thanks to these people who assisted us by providing guidance in the right direction. This encouragement helped to stay vigilant in all activities that were conducted as a part of project building process.
Special thanks to Asst. Prof. Vikas Chavan & Asst. Prof. Sanjay Agrawal, who provided right inspiration and mentored, to stay on the right path. The pure aid in work and best support helped to implement this project successfully.
And yes, thanks to the management of MMIT, Lohegaon for enabling us to learn the best skills by developing a project in such an interesting and curiosity filled field of Data Analysis & Visualization. The experience was truly amazing.
Conclusion
In the study that we conducted, we were able to find out, predict and perform analyses on the data that we got from the sources as cited and mentioned in the references, and generate good results. The system that we have developed, can be used for the similar type of data if available, for other type of viruses. The cases, RNA analyses and species tracking can be exclusively filtered if required for other viruses, the data absent can be filled and analyses can be performed. Though the objective was to develop system only for NiV, we were able to develop a generalized system with good accuracy while developing values. The data was assumed in some cases for getting result due to limited amount of time, but for future results to be much more accurate, the data can be deep researched to generate better results.
References
[1] Khandia R, Singhal S, Kumar U, Ansari A, Tiwari R, Dhama K, Das J, Munjal A, Singh RK. Analysis of Nipah Virus Codon Usage and Adaptation to Hosts. Front Microbiol. 2019 May 8;10:886. doi: 10.3389/fmicb.2019.00886. PMID: 31156564; PMCID: PMC6530375. [2] Plowright RK, Becker DJ, Crowley DE, Washburne AD, Huang T, Nameer PO, Gurley ES, Han BA. Prioritizing surveillance of Nipah virus in India. PLoS Negl Trop Dis. 2019 Jun 27;13(6):e0007393. doi: 10.1371/journal.pntd.0007393. Erratum in: PLoS Negl Trop Dis. 2023 Feb 10;17(2):e0011126. PMID: 31246966; PMCID: PMC6597033. [3] Deka MA, Morshed N. Mapping Disease Transmission Risk of Nipah Virus in South and Southeast Asia. Trop Med Infect Dis. 2018 May 30;3(2):57. doi: 10.3390/tropicalmed3020057. PMID: 30274453; PMCID: PMC6073609. [4] Toni Taipalus, Ville Isomöttönen, Hanna Erkkilä, and Sami Äyrämö. “Data Analytics in Healthcare: A Tertiary Study”. Springer Nature - PMC COVID-19 Collection. Published online 2022 Dec 9. doi: 10.1007/s42979-022-01507-0 [5] Pradeep Verma, Nikhil Mishra and Vishal Srivastava. Machine learning for personalized medicine: Tailoring treatment strategies through data analysis. The Pharma Innovation Journal. 2019; 8(3S): 11-14. DOI: 10.22271/tpi.2019.v8.i3Sa.25249 [6] Wells, T.S., Ozminkowski, R.J., Hawkins, K. et al. Leveraging big data in population health management. Big Data Anal 1, 1 (2016). https://doi.org/10.1186/s41044-016-0001-5. [7] Antonio Iyda Paganelli, Abel González Mondéjar, Abner Cardoso da Silva, Greis Silva-Calpa, Mateus F. Teixeira, Felipe Carvalho, Alberto Raposo, Markus Endler, Real-time data analysis in health monitoring systems: A comprehensive systematic literature review, Journal of Biomedical Informatics, Volume 127, 2022, 104009, ISSN 1532-0464, https://doi.org/10.1016/j.jbi.2022.104009. [8] Shukla, Sameer. (2023). Real-time Monitoring and Predictive Analytics in Healthcare: Harnessing the Power of Data Streaming. International Journal of Computer Applications. 185. 32-37. 10.5120/ijca2023922738. [9] Marzban S, Najafi M, Agolli A, Ashrafi E. Impact of Patient Engagement on Healthcare Quality: A Scoping Review. J Patient Exp. 2022 Sep 16;9:23743735221125439. doi: 10.1177/23743735221125439. PMID: 36134145; PMCID: PMC9483965. [10] Bezerra Beniz, Douglas & Espíndola, Alexey. (2016). USING TKINTER OF PYTHON TO CREATE GRAPHICAL USER INTERFACE (GUI) FOR SCRIPTS IN LNLS. [11] Batt, Steven, Tara Grealis, Oskar Harmon, and Paul Tomolonis. “Learning Tableau: A Data Visualization Tool.” The Journal of Economic Education 51, no. 3–4 (2020): 317–28. doi:10.1080/00220485.2020.1804503. [12] Kumari, Khushbu & Yadav, Suniti. (2018). Linear regression analysis study. Journal of the Practice of Cardiovascular Sciences. 4. 33. 10.4103/jpcs.jpcs_8_18. [13] Figueiredo, Dalson & Júnior, Silva, & Rocha, Enivaldo. (2011). What is R2 all about?. Leviathan-Cadernos de Pesquisa Polútica. 3. 60-68. 10.11606/issn.2237-4485.lev.2011.132282. [14] https://www.psmarketresearch.com/img/MAJOR-MARKETS-FOR-BIG-DATA-ANALYTICS-IN-HEALTHCARE.png (Accessed: 6th April 2024) [15] https://www.masaischool.com/blog/content/images/2022/07/Data-analytics-applications--2-.png (Accessed: 6th April 2024) [16] https://www.hgvs.org/mutnomen/codon.html (Accessed: 7th April 2024) [17] https://public.tableau.com/app/profile/sankalp.indish/viz/RNA-Mean-For-RSCU-Values-In-Mammals/Dashboard1 [18] https://public.tableau.com/app/profile/sankalp.indish/viz/RNAVisualizationForA- AminoAcids/RNATHESTORY
Copyright
Copyright © 2024 Sankalp Indish, Sanjay Agrawal, Vikas Chavan, Pratiksha Surse. This is an open access article distributed under the Creative Commons Attribution License, which permits unrestricted use, distribution, and reproduction in any medium, provided the original work is properly cited.

Download Paper
Paper Id : IJRASET61702
Publish Date : 2024-05-06
ISSN : 2321-9653
Publisher Name : IJRASET
DOI Link : Click Here
 Submit Paper Online

