Ijraset Journal For Research in Applied Science and Engineering Technology
- Home / Ijraset
- On This Page
- Abstract
- Introduction
- Conclusion
- References
- Copyright
Deep Learning-Based Classification of Fruit Diseases - A Comprehensive Approach to Automated Detection and Diagnosis
Authors: Abhishek ., Unmukh Datta
DOI Link: https://doi.org/10.22214/ijraset.2024.64245
Certificate: View Certificate
Abstract
This study aims to develop a deep learning-based model for accurate fruit disease classification using advanced architectures like ResNet50 and VGG19. The dataset includes images of fruits such as grapes, mangoes, lemons, pomegranates, and guavas, with both healthy and diseased categories. Diseases like black rot in grapes and bacterial canker in mangoes are considered for classification. The objective is to build a model capable of accurately identifying these diseases to aid in early identification and control. The approach begins with pre-processing the photographs using standardisation, resizing, and data augmentation techniques including flipping, zooming, and rotation to strengthen the model. By enhancing picture contrast with Contrast Limited Adaptive Histogram Equalisation (CLAHE), important illness characteristics can be better highlighted. We train and evaluate deep learning models by dividing the dataset into three parts: training, validation, and test. The ratio of the parts is 80:10:10. According on the results, the ResNet50 model outperforms all other accuracy at 99.77%.
Introduction
I. INTRODUCTION
Using deep learning to classify fruit diseases has been a game-changer in the realm of agricultural technology. Traditional methods of identifying fruit diseases, which rely on human inspectors, can be exhausting, error-prone, and time-consuming. As concerns about food insecurity and low agricultural yields have increased, so has the need for rapid and accurate automated fruit disease diagnostics. Convolutional neural The capacity of deep learning models, such as convolutional neural networks (CNNs), to learn structures from raw input has led to their outstanding performance in picture-based classification issues. These algorithms can detect and diagnose abnormalities with a high degree of accuracy since the large databases of fruit photos used to train them include a broad range of diseases [1]–[3].
Collecting a large and diverse dataset of images representing different fruit kinds and disease states is typically the first step in improving the quality of the neural network's input data. Preprocessing methods, such as picture resizing, normalisation, and enhancement, are vital in improving the generalisability of the deep learning model since they modify the dataset and make it more resilient to real-world scenarios. Convolutional neural networks (CNNs) extract features from input images via a sequence of pooling, fully connected, and convolutional layers.
Particularly, it excels at analysing images. Through the incremental acquisition of low-level data, such as textures and edges, followed by high-level features, such as forms and patterns, these layers enable the model to effectively differentiate between good-looking and diseased fruits. By reducing the demand for large datasets and computational capacity, advanced methods such as transfer learning have accelerated the development of fruit disease detection systems [4]–[6]. One way to train a deep learning network is to optimise a loss function, typically cross-entropy, using an optimisation method like Adam or stochastic gradient descent (SGD). In order to make the model's disease predictions more accurate, it adjusts its internal parameters, often called weights, while training. Dropout, regularisation, and early pausing are approaches that help prevent overfitting, a common problem in deep learning models. This ensures that the model performs well on unknown input. Farmers and other agricultural specialists now have a powerful tool for monitoring crop health: a trained model that can detect fruit illnesses in real time. Remote and inexpensive disease detection is now within reach with the help of these technologies and unmanned aerial vehicles (UAVs) or smartphone apps [7]–[9].
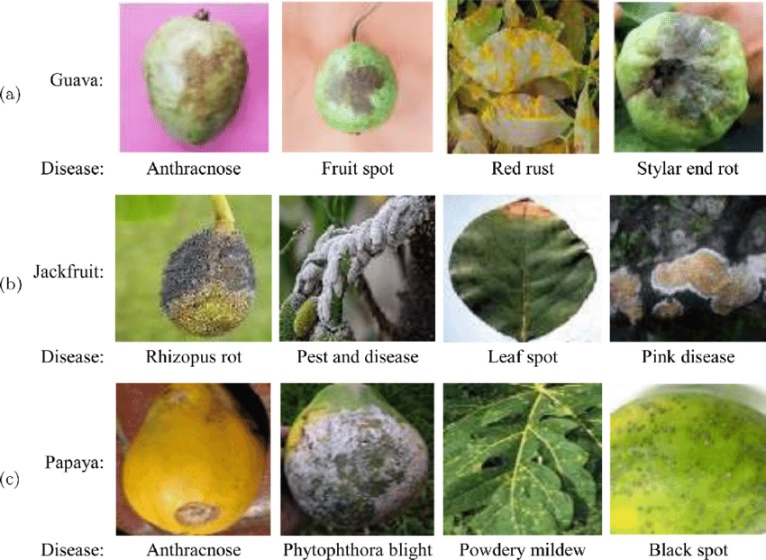
Figure 1 Common fruit disease
This allows for prompt responses that can stop the spread of disease and lower crop losses. Additionally, deep learning-based models have demonstrated considerable potential in the simultaneous detection of several diseases, a job that is extremely difficult to accomplish with conventional methods. The availability of massive annotated datasets and the use of more complex architectures, such as attention mechanisms and residual networks (ResNets), which enable the model to focus on the most relevant areas of the image, have greatly increased the accuracy of these models. Furthermore, as new data becomes available, these models may train continuously and adjust to new illness patterns. Since CNNs automatically identify the best characteristics needed for illness identification, deep learning-based classification has several advantages over traditional machine learning techniques, one of which is the elimination of manual feature extraction [10]–[12]. Notwithstanding the enormous advancements, difficulties still exist, especially when handling unbalanced datasets where some diseases may be under-represented and produce forecasts that are skewed. To solve these problems, techniques like weighted loss functions, synthetic data generation, and data augmentation have been used. Furthermore, as new data becomes available, these models may train continuously and adjust to new illness patterns. Since CNNs automatically identify the best characteristics needed for illness identification, deep learning-based classification has several advantages over traditional machine learning techniques, one of which is the elimination of manual feature extraction. Notwithstanding the enormous advancements, difficulties still exist, especially when handling unbalanced datasets where some diseases may be under-represented and produce forecasts that are skewed. To solve these problems, techniques like weighted loss functions, synthetic data generation, and data augmentation have been used. In the future, deep learning could transform fruit disease control worldwide when combined with other technologies like edge computing, the Internet of Things (IoT), and precision agriculture. Another area of interest is the deployment of deep learning models in low-resource contexts, where there are constraints on computing power and internet access. Lightweight models that can function well on edge devices are being developed in this regard [13]–[15]. To sum up, deep learning-based fruit disease classification is a game-changer in agricultural technology, providing a scalable, effective, and highly accurate response to one of the most important problems facing contemporary agriculture: maintaining crop health and enhancing food security.
II. LITERATURE REVIEW
Li et al. 2024 necrotising fungal infections are the culprits behind this phenomenon. Research into the biocontrol of postharvest diseases is an ever-evolving discipline. In recent years, researchers have begun to view the biocontrol agent, pathogen, host, physical environment, and resident microflora as interdependent components of a system, rather than as independent entities. Which is to say, we've moved from a simple to a complicated paradigm. From the discovery and commercialisation of BCAs to their modes of action and a brief overview of the biology of necrotrophic diseases, this paper covers it all in its account of the last forty years of effort in postharvest biocontrol. New research on marker-assisted selection, the fruit microbiome and its link to the pathobiome, and biocontrol methods, such as double-stranded RNA, are the primary areas of attention here. Examples of present and prospective research directions in postharvest biocontrol include the latter two subjects [16].
Kaur et al. 2024 climacteric fruit, which ripens as respiration and ethylene production rates rise. The jackfruit's worth drops during transportation and storage because the fruit's quality drops. Since there is no universally accepted harvest maturity index for jackfruit, picking it when it is too young or too old leads to spoilt, underripe fruit that spoils quickly. Because of its high perishability, cold sensitivity, and susceptibility to fruit rot, which result in significant quantitative and qualitative losses, its postharvest life is quite short. It is possible to extend the storage life using postharvest management techniques such as chemical treatment, controlled atmosphere storage, modified atmosphere packaging, edible coatings, cold storage, and non-chemical options. Making a variety of commodities based on jackfruit can help mitigate the effects of such losses. This comprehensive study investigates jackfruit's nutritional composition, ripening physiology, pre- and post-harvest quality control, value addition, and strategies to reduce post-harvest losses in the supply chain [17].
Alle et al. 2024 worked by individuals residing in remote regions across the world. Despite the increasing interest in and knowledge of the value of data on the morphological aspects of fruits and seeds for breeding crops with greater resilience to pests and diseases, there is still a dearth of such information. Researchers in Ethiopia's Bosset and Bati districts set out to accomplish just that. They surveyed three distinct land use types (LUT)—farmland (FL), home gardens (HG), and roadside (RS)—to gather comprehensive data on the fruit and seed dimensions of Ziziphus tree species. The morphology of the fruits and seeds of the varieties that lived in those LUTs was very different. Fruit breadth (6 mm), weight (28 g), length (16 mm), and width (18 mm) were all significantly higher in the Bosset farming environment than in any other. The agricultural and backyard settings in Bati had the longest average seed length (7 mm) and the heaviest hundred seed weight (5 g). Also, the correlation between the fruit's width and length was 0.78, while the correlation between the weight of 10 fruits and their width was 0.65. While length and width showed no correlation with fruit ripeness levels, weight did. There was a weak correlation between the 100-seed weight and the dimensions of the seeds, however there was a substantial correlation between the length and width of the seeds (r = 0.88). The results indicate that the Bosset district possesses superior morphological traits compared to the rest of the area. This suggests that there may be robust tree stands in this area that could be ideal for breeding programs aimed at developing pest- and disease-resistant tree varieties [18].
Xue et al. 2024 Its high nutritional and economic value makes it a popular choice among people worldwide. Researching a rapid and precise way to measure the morphological traits of cucumber fruit could improve its breeding efficiency and help modify the development models for pepo fruits. Current manual procedures are time-consuming and prone to mistakes, even though there are several defined measurement techniques and standards for characterisation of cucumber fruits. Given this, we provide CucumberAI, a system and software for recognising morphological features in cucumber fruits. To successfully identify up to fifty-one cucumber characteristics—32 of which are newly produced parameters—it combines deep learning models with image processing approaches. Using image processing algorithms, the proposed application shows how to extract cucumber shapes and segment fruits. The recognition system employs MobileNetV2 and six DL models with fruit feature detection rules to construct a decision tree for fruit shape recognition. Additionally, the system employs U-Net segmentation models for endocarp and fruit stripe separation, a MobileNetV2 model for carpel classification, a ResNet50 model for stripe classification, and a YOLOv5 model for cancer detection. We conducted validation tests and a cluster analysis of fruit appearance to look at how smooth or rough the surface of the fruit is in connection to the algorithmic and image-based manual features. Conclusively, CucumberAI provides a quick method to collect and assess phenotypes, making it an excellent tool for future genetic improvements in cucumbers [19].
Sbodio et al. 2024 Due to the prevalence of chronic fungal infections, it is necessary to enhance postharvest conditions in order to develop effective control strategies. Ultimately, we were able to mimic the spread of disease from infected fruits to nearby healthy crops during postharvest storage by developing a reliable and consistent inoculation approach. We examined dangerous postharvest infections, such as Penicillium expansum, Botrytis cinerea, Penicillium italicum, and Penicillium digitatum, to different combinations of oranges, tomatoes, and apples in this study. We tested this protocol's efficacy using multiple pathogen isolates and fruits that had undergone various postharvest treatments. We adjusted the incubation time and amount of sick tissue for each fruit-pathogen combination. We tracked disease incidence and severity to get a feel for how far the infection had progressed. With the exception of tests that employed fungicide on oranges inoculated with fungicide-sensitive Penicillium spp. isolates, all other experiments had disease incidence rates of 80% or more at the final evaluation point. Importantly, our approaches showed resilience by allowing the pathogen to establish itself in adverse settings despite the lower illness incidence. Finally, we used multispectral imaging to detect P. digitatum infections in oranges at an early stage, before the disease was visible to the naked eye but the pathogen had already planted its roots. Conclusions: By employing a non-invasive inoculation strategy, we successfully reproduced postharvest diseases caused by touch or nesting.
The high disease incidence and severity rates across several fruit commodities and fungal infections demonstrate the reliability, effectiveness, and difficulty of replicating the methods. It is feasible to adapt the protocol to deal with different pathosystems. The method can also facilitate the evaluation of new management strategies and the investigation of fruit-pathogen relationships [20].
Table 1 Literature summary
|
Author/year |
Methodology used |
Dataset used |
Research gap |
Parameters |
|
Patel/2023 [21] |
Automated fruit sorting enhances quality, production, and export efficiency. |
Dataset includes fruit images labeled by type, disease, and ripeness. |
Limited real-time deployment and accuracy for diverse fruit diseases detection. |
Key parameters include color, texture, morphology, ripeness, and disease classification. |
|
Bhat/2023 [22] |
Methodology involves reviewing ?mla's medicinal properties and validating scientific evidence. |
Dataset includes traditional uses, chemical composition, and scientific validation studies. |
Lack of scientific validation for ?mla's traditional healing properties. |
Key parameters include ascorbic acid, tannins, iron, calcium, and antioxidants. |
|
Rahman/2023 [23] |
Methodology uses GLCM for feature extraction and SVM for classification. |
Dataset includes images of tomato leaves with various disease conditions. |
Limited generalizability and real-time application of disease detection systems. |
Key parameters include statistical features, GLCM values, and disease classification. |
|
James/2023 [24] |
Methodology includes literature survey, taxonomy creation, and identifying future challenges. |
Dataset includes TinyML applications, research efforts, and domain-specific use cases. |
Need for improved TinyML techniques and practical deployment challenges remains. |
Key parameters include application domains, energy consumption, and model efficiency. |
|
Vishnoi/2023 [25] |
Methodology includes CNN with data augmentation for efficient disease detection. |
Dataset includes PlantVillage images for apple leaf diseases: Scab, Black rot, Cedar rust. |
Need for efficient, low-resource models with high accuracy and generalization. |
Key parameters include CNN layers, data augmentation, and classification accuracy. |
III. METHODOLOGY
The collection has 63 image categories, with counts ranging from 8 to 968 per category. It lists five different kinds of fruit, each of which is associated with a different set of health problems and recommended food intake. Picture preprocessing includes resizing to 256x256 pixels for consistency, normalising pixel values to the [0, 1] range, and using data augmentation techniques like rotating, flipping, and zooming to increase diversity and decrease overfit. Contrast limited adaptive histogram equalisation (CLAHE) improves contrast while numerically encoding category labels. When building and evaluating models, it's best to use a ratio of 80:10:10 for data distribution among training, validation, and test sets. We employ ResNet50, a deep learning architecture that deals with vanishing gradients using residual connections, and VGG19, a deep learning architecture famous for its nineteen layers. In order to optimise speed, VGG19 makes use of real-time data augmentation through the use of 'datagen.flow()' with callbacks like 'annealer' and 'checkpoint'. ImageNet training and layer modifications, such as "Conv2D" and "GlobalAverage Pooling2D," allow ResNet50 to be fine-tuned for multi-class classification. We evaluate the model's performance using the Adam optimiser and the categorical crossentropy loss.

Fig. 1 Proposed Flowchart
A. Data Information
The dataset contains 63 image categories with an average of 143 images per category. The number of images ranges from 8 to 968. The fruit distribution includes Grape (3,742 images), Lemon (236), Pomegranate (559), Guava (527), and Mango (4,000). The dataset covers various diseases for each fruit, such as black measles, black rot, and leaf blight for grapes, and diseases like bacterial canker and powdery mildew for mangoes. There are also healthy categories for each fruit. This comprehensive dataset is well-suited for training machine learning models in fruit disease classification.
B. Data Pre-processing
Start by standardising the image dimensions to a uniform size, say 256x256 pixels, which helps in managing computational resources and guaranteeing consistency across the dataset, so effectively preprocessing the fruit disease dataset for deep learning. Divide by 255 to normalise the pixel values inside a [0, 1] range, therefore enabling steady and fast model training. Using methods like oversampling for minority classes or undersampling for majority classes will help to balance classes in a dataset. By means of augmentation strategies like rotation, flipping, zooming, and contrast modification, enhance the diversity and robustness of the dataset so lowering overfitting and so enhancing model generalisation. Apply Contrast Limited Adaptive Histogram Equalisation (CLAHE) to increase image contrast and minimise noise, hence stressing important features for effective illness identification. One-hot or label encoding helps you translate categorical labels—such as disease categories and fruit kinds—into numerical values.
C. EDA
Understanding the structure and features of a dataset before using sophisticated analytics or deep learning methods depends on first doing exploratory data analysis (EDA). In this work, the distribution and type of images connected to fruit diseases is explored using EDA. Key visualisations illustrate the quantity of photographs by fruit variety, emphasising that grapes, mangoes, and lemons, pomegranates, and guavas are less represented while grapes and mangoes have the most images. The number of photos per ailment is shown in another bar graph, therefore highlighting the spectrum of different diseases and their frequency in the data. Extra pictures offer thorough illustrations of disease symptoms, including guavas with scab, grape leaves afflicted by black rot, and lemon leaves at several phases of disease development. These visualisations and examples help one to grasp the dataset better, hence guiding next data processing and model development activities.
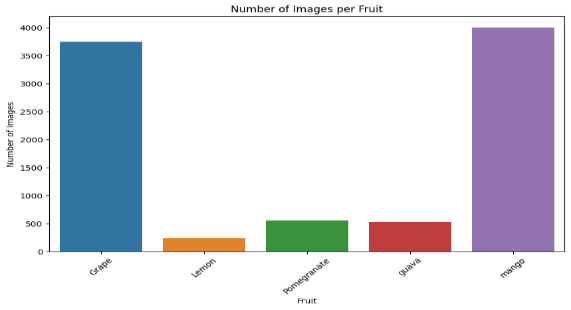
Fig. 2 Number of Images
With a bar graph labelled "Number of Images per Fruit," grapes have the most images followed by mango. There are much less pictures of lemon, pomegranate, and guaa. The distribution of picture quantities for every fruit type in the dataset is shown visually here.
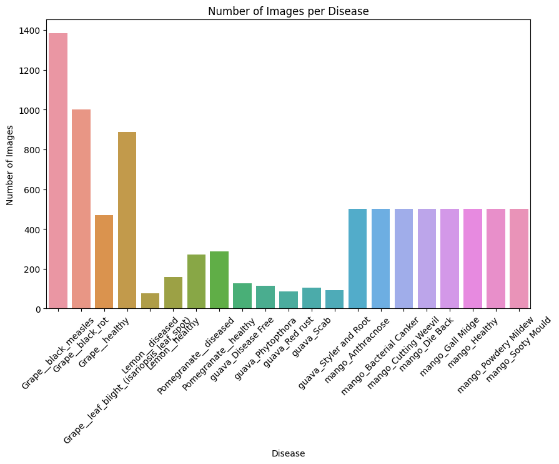
Fig.3 Number of images per disease
With the x-axis listing diseases and the y-axis giving image counts from 0 to 1400, the bar graph "Number of Images per Disease" displays the distribution of images for several disorders. Coloured from red to purple, the bars graphically depict information relevant for machine learning or medical picture analysis.

Fig.4 Lemon Disease leaves
Three lemon leaves labelled "Lemon - Lemon diseased" in the illustration depict several phases of disease development. When researching plant health and pathology, this graphic helps to show how diseases change lemon leaves over time.
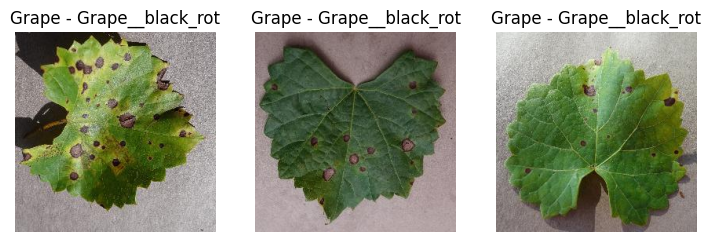
Fig. 5 Grape Black rot leaves images
The picture displays black rot disease's afflicted grape leaves. Brown lesions including black spots on the leaves point to a fungal infestation. Especially in grape farming, this graphic helps one recognise and investigate plant illnesses.
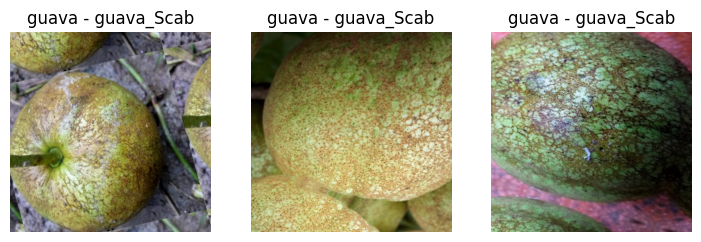
Fig. 6 Guava scab
Three guavas afflicted by the plant disease guava scab are shown in the picture. Every guava shows scab-like flaws, signifying different degrees of intensity. For agricultural research, this disorder is important and emphasises the importance of good disease control in guava farming.
D. Data Splitting
Divide the data into three sets: test, validation, and training, using an 80-10-10 ratio. Efficient training on a large dataset, validation on a separate subset to fine-tune hyperparameters and avoid overfitting, and testing on an independent set to evaluate generalisability and performance are all parts of this method. This distribution improves the model's performance and accuracy in fruit disease classification tasks by allowing for thorough training while maintaining tight validation and testing. This harmonic separation is crucial for developing a robust and trustworthy model.
E. Deep learning & Modeling
VGG19:VGG19 , a deep convolutional neural network with 19 layers for strong picture classification, is well-known for being both simple and effective.While training, the 'datagen.fit(X_train)' function of the VGG19 model is utilised to enrich the training set with real-time data using random transformations such as flipping, zooming, and rotating. This enhancement makes the model more generalisable by utilising heterogeneity in the training data. After you've used'model.fit()' to train the model with the enhanced data, you may create batches of augmented images and labels by calling 'datagen.flow(X_train, Y_trai, batch_size=BATCH_SIZE)'. By setting the'steps_per_epoch' value to 'X_train.shape[0] // BATCH_SIZE', you can select the total number of steps needed to finish one epoch, which is defined by the batch size. While the training process is running for the chosen number of epochs ('EPOCHS'), it generates progress updates with the'verbose=1' option. The usage of callbacks such as 'annealer' and 'checkpoint' further enhances efficiency. At regular intervals, the 'annealer' saves the model's weights using 'checkpoint,' typically adjusting the learning rate dynamically. You can also use validation data ('X_val', 'Y_val') to see how well the model does on raw data, which ensures that the training went well and that it can handle new samples with ease.
ResNet50:ResNet50 is a powerful deep learning model with 50 layers, leveraging residual connections to enhance performance and address vanishing gradients.Inspired on the ResNet50 architecture, the `build_resnet` function creates a convolutional neural network model. Load the ResNet50 model pre-trained on ImageNet with the top layers excluded (`include_top=False`), hence allowing the usage of ResNet50 as a feature extractor. Dimensions `(SIZE, SIZE, N_ch)` define an input layer whereby `SIZE` defines the image dimensions and `N_ch` the number of colour channels. Applying a `Conv2D` layer with three filters and a `(3, 3)` kernel size to the input helps to match the ResNet50 required input size. Following multiple layers—`GlobalAverage Pooling2D` to lower spatial dimensions, `BatchNormalization` to stabilise learning, and `Dropout` with a rate of 0.5 to prevent overfitting—the ResNet50 model produces output. ReLU activation and a dense layer with 256 units follow here, further normalised and underlined and subject to dropout. Fit for multi-class classification with 15 classes, the last output layer is a `Dense` layer with 15 units and a softmax activation function. The model is assembled with categorical crossentropy loss and the Adam optimiser set with certain values. {{model.summary()} shows the architecture of the model; the function returns the produced model.
IV. RESULT & DISCUSSION
Models' performance is assessed applying recall, accuracy, and precision criteria. Calculating the ratio of accurately predicted events to the total instances helps one to evaluate the general validity of the model. Precision shows the model's capacity to prevent false positives by evaluating the fraction of actual positive predictions among all positive predictions. Reflecting the model's capacity to find positive examples, recall measures the proportion of true positives found among all actual positives. These measures provide dependable diagnosis results and offer a whole evaluation of the effectiveness of the model in precisely categorising fruit diseases.
A. Accuracy
Calculating the fraction of properly classified cases against the overall count of cases helps one evaluate the accuracy of the model. Basically, it shows the performance of every category in the model.
Accuracy=(TP+TN)(TP+FP+TN+FN) (1)
B. Precision
A model's degree of precision shows how well it can forecast future results. The ratio of expected to actual positives decides the accuracy. Low probability of false positives—that is, high degree of accuracy—indicates that the model is good in generating positive predictions.
Precision=TPTP+FP (2)
C. Recall
Analyse a model's sensitivity or recall by seeing if it can precisely identify every instance of a given class. The accuracy rate is the percentage of accurate positives the model correctly finds. Using highly recall models is essential in medical diagnostics to effectively identify all positive cases since missing a positive case could have significant effects.
Recall=TPTP+FN (3)
D. F1-Score
An crucial statistic for assessing classifiers is the F1 score. It offers a whole performance assessment by combining memory and accuracy. By including both false positives and false negatives, the F1 score provides a fair assessment unlike accuracy, which could present a skewed picture when handling imbalanced data. It is particularly helpful in industries like cybersecurity and healthcare where exact classification is vital and in cases of unequal distribution of classes. Recall's harmonic mean offers a complete evaluation of a classifier's performance. Precision's harmonic mean likewise.
F1-score=21precision+1recall (4)
Table 2. Performance Evaluation of Proposed Deep learning Models
|
Models |
Accuracy |
Precision |
Recall |
F1-Score |
|
VGG 19 |
98.92 |
97.77 |
98.07 |
98.45 |
|
Res Net 50 |
99.77 |
99.34 |
98.56 |
98.08 |
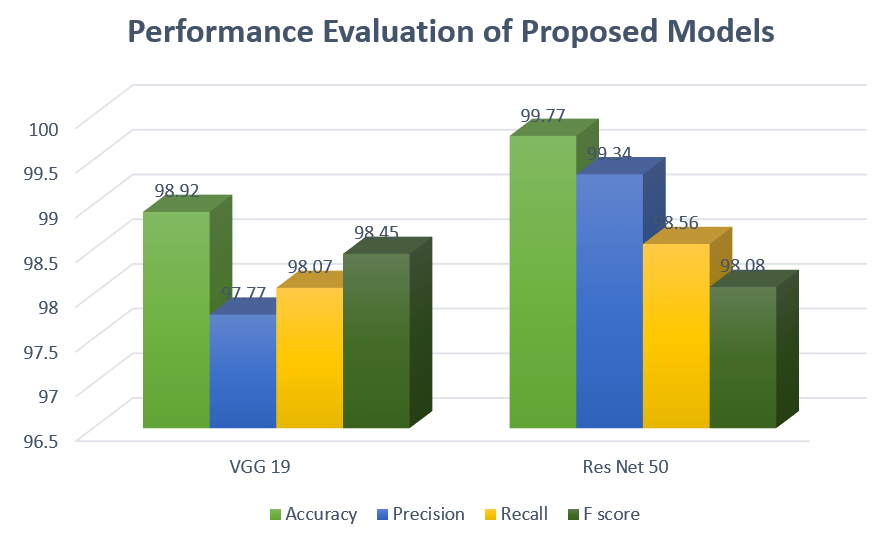
Fig. 7 Performance Evaluation of proposed Models Graph
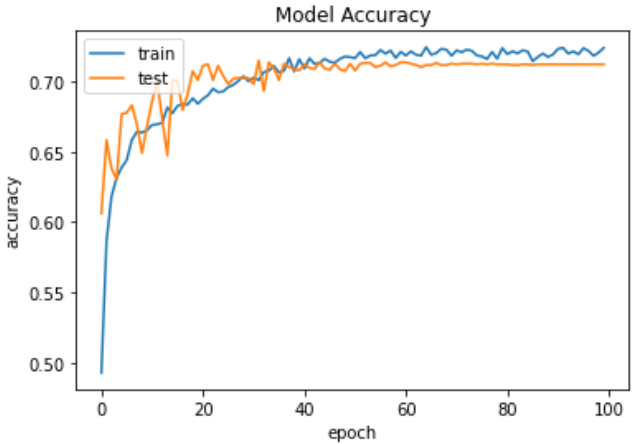
Fig.8 Accuracy graph of VGG19
Figures 8: VGG19's accuracy graph This graph shows performance gains by illustrating over time the training and testing accuracy of the VGG19 model.
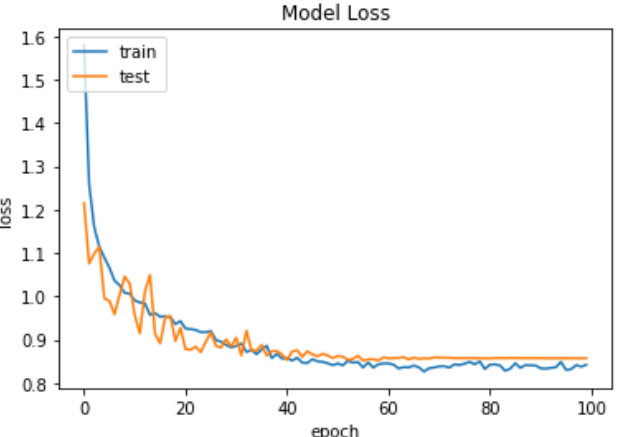
Fig.9 Loss graph of VGG19 model
Fig. 9 VGG19 model loss graph Training and testing loss of the model is shown in this graph, therefore displaying error decrease during training.
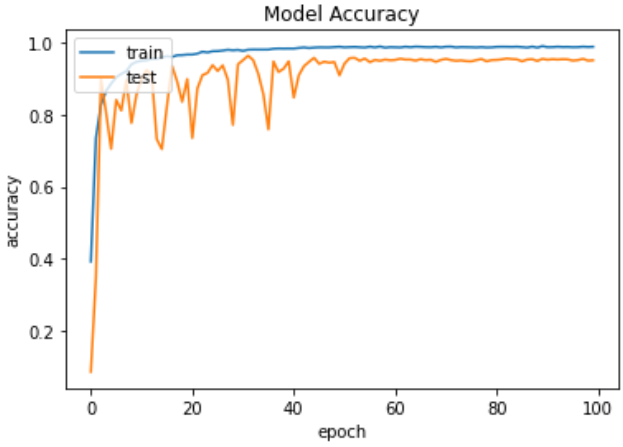
Fig. 10 Accuracy graph of ResNet 50
ResNet50's accuracy curve in Fig. 10 shows how effectively the model accurately labels fruit illnesses as training advances across consecutive epochs.
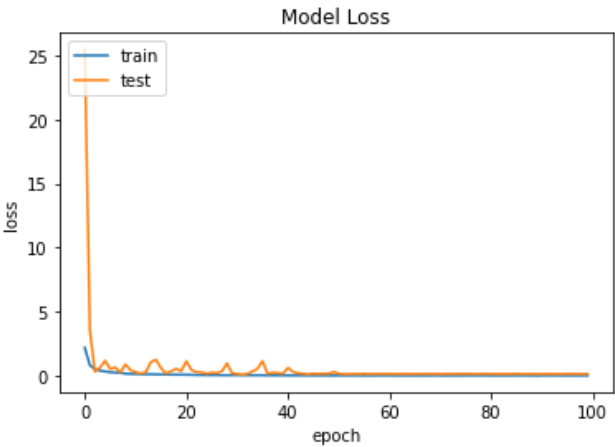
Fig.11 Loss graph of ResNet 50
ResNet50's loss graph Fig. 11 shows the drop in loss values over training epochs, therefore showing the learning efficiency of the model and the decrease in prediction errors all through the training process.
Table 3. Comparative Analysis of Proposed model and Existing Model
|
Models |
Accuracy |
Ref. |
|
Proposed ResNet 50 |
99.77 |
-- |
|
Hybrid CNN |
97.10 |
[26] |
|
VGG 19 |
99.06 |
[27] |
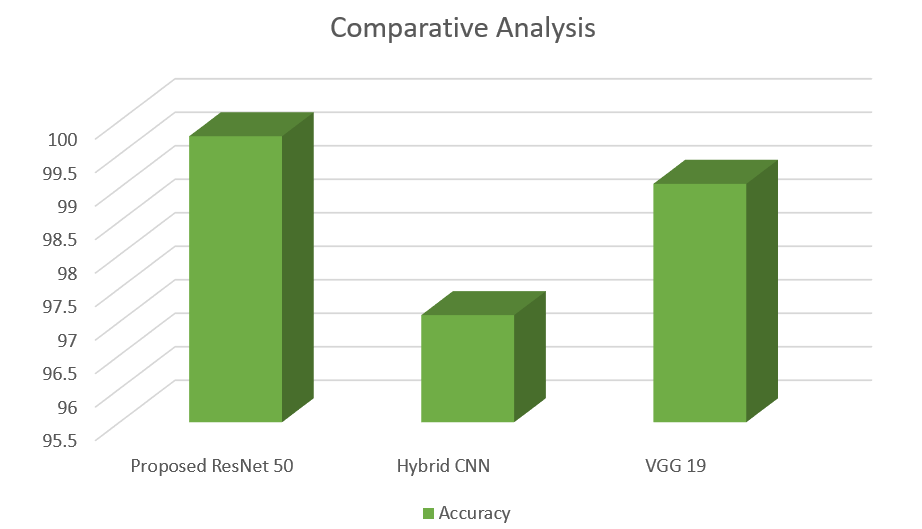
Table 3 displays a comprehensive comparison of the proposed ResNet50 model with other models that already exist. The ResNet50 model had the highest level of accuracy, reaching 99.77%, surpassing both the Hybrid CNN model with an accuracy of 97.10%, and VGG19, which obtained 99.06% accuracy. This exemplifies the exceptional efficacy of ResNet50 in categorising fruit diseases.
Conclusion
Using ResNet50 and VGG19 architectures, the work effectively created a deep learning-based model for precise fruit disease classification. There were more than 9,000 pictures in the dataset, showing both healthy and sick fruits; diseases such bacterial canker in mangoes and black rot in grapes abound. The dataset\'s resilience was improved by key pre-processing actions including image scaling, normalisation, and data augmentation. Additionally employed to enhance image contrast was the Contrast Limited Adaptive Histogram Equalisation (CLAHE) technique, therefore highlighting illness features and enhancing model performance. ResNet50 achieved 99.77% accuracy compared to 99.06% for VGG19, so surpassing VGG19 in classification accuracy. ResNet50 also showed better performance in the comparative study than current models including Hybrid CNN, which attained 97.10% accuracy. Precision, recall, and F1-score evaluation measures helped to validate ResNet50\'s ability to accurately and with less false positives identify and classify fruit illnesses. In conclusion, the combination of ResNet50 and sophisticated pre-processing methods such as CLAHE produced notable enhancements in fruit disease identification. The results show how well deep learning models might improve early illness diagnosis, hence supporting better disease control and agricultural output.
References
[1] M. M. A. N. Ranjha et al., “A comprehensive review on phytochemistry, bioactivity and medicinal value of bioactive compounds of pomegranate (Punica granatum),” Adv. Tradit. Med., vol. 23, no. 1, pp. 37–57, 2023, doi: 10.1007/s13596-021-00566-7. [2] A. Pavithra, G. Kalpana, and T. Vigneswaran, “Deep learning-based automated disease detection and classification model for precision agriculture,” Soft Comput., vol. 0, p. 7936, 2023, doi: 10.1007/s00500-023-07936-0. [3] D. A. Waly et al., “Comprehensive phytochemical characterization of Persea americana Mill. fruit via UPLC/HR-ESI–MS/MS and anti-arthritic evaluation using adjuvant-induced arthritis model,” Inflammopharmacology, vol. 31, no. 6, pp. 3243–3262, 2023, doi: 10.1007/s10787-023-01365-z. [4] X. Liu et al., “Trends and challenges on fruit and vegetable processing: Insights into sustainable, traceable, precise, healthy, intelligent, personalized and local innovative food products,” Trends Food Sci. Technol., vol. 125, pp. 12–25, 2022, doi: 10.1016/j.tifs.2022.04.016. [5] A. Rajbongshi, M. E. Islam, M. J. Mia, T. I. Sakif, and A. Majumder, “A Comprehensive Investigation to Cauliflower Diseases Recognition: An Automated Machine Learning Approach,” Int. J. Adv. Sci. Eng. Inf. Technol., vol. 12, no. 1, pp. 32–41, 2022, doi: 10.18517/ijaseit.12.1.15189. [6] K. Janacsek, T. M. Evans, M. Kiss, L. Shah, H. Blumenfeld, and M. T. Ullman, “Subcortical Cognition: The Fruit Below the Rind,” Annu. Rev. Neurosci., vol. 45, pp. 361–386, 2022, doi: 10.1146/annurev-neuro-110920-013544. [7] M. H. Saleem, J. Potgieter, and K. M. Arif, “A Performance-Optimized Deep Learning-Based Plant Disease Detection Approach for Horticultural Crops of New Zealand,” IEEE Access, vol. 10, no. July, pp. 89798–89822, 2022, doi: 10.1109/ACCESS.2022.3201104. [8] A. Elaraby, W. Hamdy, and S. Alanazi, “Classification of Citrus Diseases Using Optimization Deep Learning Approach,” Comput. Intell. Neurosci., vol. 2022, 2022, doi: 10.1155/2022/9153207. [9] A. I. Khan, S. M. . Quadri, S. Banday, and J. L. Shah, “Deep Diagnosis: A Real-Time Apple Leaf Disease Detection System Based on Deep Learning,” SSRN Electron. J., 2022, doi: 10.2139/ssrn.4019467. [10] F. J. Corpas, M. Rodríguez-Ruiz, M. A. Muñoz-Vargas, S. González-Gordo, R. J. Reiter, and J. M. Palma, “Interactions of melatonin, reactive oxygen species, and nitric oxide during fruit ripening: an update and prospective view,” J. Exp. Bot., vol. 73, no. 17, pp. 5947–5960, 2022, doi: 10.1093/jxb/erac128. [11] S. Maheshwari, V. Kumar, G. Bhadauria, and A. Mishra, “Immunomodulatory potential of phytochemicals and other bioactive compounds of fruits: A review,” Food Front., vol. 3, no. 2, pp. 221–238, 2022, doi: 10.1002/fft2.129. [12] V. G. Krishnan, J. Deepa, P. V. Rao, V. Divya, and S. Kaviarasan, “An automated segmentation and classification model for banana leaf disease detection,” J. Appl. Biol. Biotechnol., vol. 10, no. 1, pp. 213–220, 2022, doi: 10.7324/JABB.2021.100126. [13] K. Kandemir, E. Piskin, J. Xiao, M. Tomas, and E. Capanoglu, “Fruit Juice Industry Wastes as a Source of Bioactives,” J. Agric. Food Chem., vol. 70, no. 23, pp. 6805–6832, 2022, doi: 10.1021/acs.jafc.2c00756. [14] S. Zhang, J. S. Griffiths, G. Marchand, M. A. Bernards, and A. Wang, “Tomato brown rugose fruit virus: An emerging and rapidly spreading plant RNA virus that threatens tomato production worldwide,” Mol. Plant Pathol., vol. 23, no. 9, pp. 1262–1277, 2022, doi: 10.1111/mpp.13229. [15] A. S. Shah, S. V. Bhat, K. Muzaffar, S. A. Ibrahim, and B. N. Dar, “Processing Technology, Chemical Composition, Microbial Quality and Health Benefits of Dried Fruits,” Curr. Res. Nutr. Food Sci., vol. 10, no. 1, pp. 71–84, 2022, doi: 10.12944/CRNFSJ.10.1.06. [16] X. Li et al., “Current and future trends in the biocontrol of postharvest diseases,” Crit. Rev. Food Sci. Nutr., vol. 64, no. 17, pp. 5672–5684, 2024, doi: 10.1080/10408398.2022.2156977. [17] J. Kaur, Z. Singh, H. M. S. Shah, M. S. Mazhar, M. U. Hasan, and A. Woodward, “Insights into phytonutrient profile and postharvest quality management of jackfruit: A review,” Crit. Rev. Food Sci. Nutr., vol. 64, no. 19, pp. 6756–6782, 2024, doi: 10.1080/10408398.2023.2174947 [18] T. R. Alle, S. M. Andrew, M. F. Karlsson, and A. Gure, “1. Morphological traits of fruits and seeds of Ziziphus tree species growing in different land uses in Ethiopia,” Heliyon, vol. 10, no. 14, p. e34751, 2024, doi: 10.1016/j.heliyon.2024.e34751. [19] W. Xue et al., “CucumberAI: Cucumber Fruit Morphology Identification System Based on Artificial Intelligence,” Plant Phenomics, vol. 6, pp. 1–16, 2024, doi: 10.34133/plantphenomics.0193. [20] A. O. Sbodio et al., “Non-wounding contact-based Inoculation of fruits with fungal pathogens in postharvest,” Plant Methods, vol. 20, no. 1, pp. 1–11, 2024, doi: 10.1186/s13007-024-01214-2. [21] H. B. Patel and N. J. Patil, “Image Processing Based Fruit Detection and Grading Classification System: a Review,” Eur. Chem. Bull, vol. 2023, no. August, pp. 15894–15908, 2023. [22] S. A. Bhat, A. Farooq, and A. Iqbal, “A comprehensive review of Emblica officinalis ( ?mla ): Its medicinal properties and therapeutic uses,” Int. J. Unani Integr. Med., vol. 7, no. 1, pp. 1–3, 2023. [23] S. U. Rahman, F. Alam, N. Ahmad, and S. Arshad, “Image processing based system for the detection, identification and treatment of tomato leaf diseases.,” Multimed. Tools Appl., vol. 82, no. 6, pp. 9431–9445, 2023, doi: 10.1007/s11042-022-13715-0. [24] Y. Abadade, A. Temouden, H. Bamoumen, N. Benamar, Y. Chtouki, and A. S. Hafid, “A Comprehensive Survey on TinyML,” IEEE Access, vol. 11, no. September, pp. 96892–96922, 2023, doi: 10.1109/ACCESS.2023.3294111. [25] V. K. Vishnoi, K. Kumar, B. Kumar, S. Mohan, and A. A. Khan, “Detection of Apple Plant Diseases Using Leaf Images Through Convolutional Neural Network,” IEEE Access, vol. 11, no. January, pp. 6594–6609, 2023, doi: 10.1109/ACCESS.2022.3232917. [26] “INTELLIGENT SYSTEMS AND APPLICATIONS IN Fruit Disease Detection and Classification using Machine Learning and Deep Learning Techniques,” 2024. [27] I. M. Nasir et al., “Deep learning-based classification of fruit diseases: An application for precision agriculture,” Comput. Mater. Contin., vol. 66, no. 2, pp. 1949–1962, 2020, doi: 10.32604/cmc.2020.012945.
Copyright
Copyright © 2024 Abhishek ., Unmukh Datta. This is an open access article distributed under the Creative Commons Attribution License, which permits unrestricted use, distribution, and reproduction in any medium, provided the original work is properly cited.

Download Paper
Paper Id : IJRASET64245
Publish Date : 2024-09-15
ISSN : 2321-9653
Publisher Name : IJRASET
DOI Link : Click Here
 Submit Paper Online

