Ijraset Journal For Research in Applied Science and Engineering Technology
- Home / Ijraset
- On This Page
- Abstract
- Introduction
- Conclusion
- References
- Copyright
Degradation of Sugarcane Trash by Primary Treatment Methods
Authors: Girija Awaradi, Kusuma Kumari Y
DOI Link: https://doi.org/10.22214/ijraset.2024.66128
Certificate: View Certificate
Abstract
India is the second largest sugar producing country in the world and producing 70 tons/ha (28.34 tons/acre) of sugarcane. India is agricultural based country and 70% people of India depend on the agriculture. India produces the rice, wheat and other crops in the largest quantity. One ton of sugarcane trash contains 5.4 kg of N, 1.3kg of P2O5, and 3.1 kg of K2O and small quantities of micronutrients. Annual production of sugarcane is 285 Mt/Yr. and dry residue generated is 107.5 Mt/Yr. In this study degradation of sugarcane trash is conducted by vessel composting method. 100 gram of trash is taken in each container and 30 gram of treatments like pressmud, lime powder, cow dung, waste decomposer, bacteria inoculum are added in different containers. To find the fastening the degradation of sugarcane trash all these treatments are compared with trash control by conducting the NPK analysis at 0, 15, and 30days. From the experiment setup results trash with pressmud and trash with lime are showing significant results.
Introduction
I. INTRODUCTION
Sugarcane is an old agricultural crop, having top green leaves and bottom dry leaves. In the middle it is having stem structure of 2-4m tall and 5cm diameter. The bottom dry leaves are the sugarcane residue or sugarcane trash. Sugarcane produces 10-12 tons of dry leaves or trash per hectare per crop as a residue. After cutting the sugarcane tops 70-80% of residue trash is remaining on the land and 20-30% is going to the industries.Sugarcane production involves both agricultural stage and industrial stage. In the first stage farmers harvest the sugarcane on land, after 12 months of proper treatment they grown up sufficient yield, then the sugarcane tops are cutting to send to the industries. In the second stage after receiving the sugarcane in the industry they are crushed to extract the sugarcane juice. From the juice crystal sugar is produced by using different processes and chemicals. A large quantity of sugarcane waste is generated from the sugar industries every day. After crushing bagasse, sugar pressmud, spentwash and molasses are the wastes generated in sugar industries. Bagasse is used for boiler burning in the industry itself. If it is collected in large quantity then it is sent for the fiberboard and paper production. Sugar pressmud is used in the production of biofertilizers or compost. Molasses or spentwash is used in alcohol production in the distillery industries. After cutting the sugarcane tops 70-80% of residue trash is remaining on the land and 20- 30% is going to the industries along with sugarcane tops. Major attention is given to the improvement of sugarcane yield and not much attention is given to the management of sugarcane trash.. One ton of sugarcane trash contains 5.4 kg of N, 1.3kg of P2O5, and 3.1 kg of K2O and small quantities of micronutrients. Annual production of sugarcane is 285 Mt/Yr. and dry residue generated is 107.5 Mt/Yr. The management of this huge quantity of dry residue or trash is the present major problem for the farmers
A. Objectives of the Study
- To fasten the degradation of Sugarcane Trash.
- To find the effective methods of degradation.
B. Treatment Methods Used
Pre air lime treatments, Vermiconversion are the some of the methods used in the trash composting. Bacteria and fungi cultures are used in different proportions to fasten the degradation of sugarcane trash. Urea is used to improve composting quality. Sugar pressmud is used with bagasse and trash to convert into compost. Sugar pressmud is having higher nutrients which improve the soil quality. Vegetable waste, cow dung and cattle manure is used in different proportions with sugarcane residue to convert into compost. Plastic containers or trays are used for the experiments. Physical and chemical properties of compost are analysed. To convert the sugarcane trash into compost it is longer process and taking 15 to 100 days. It helps to improves the soil fertility and maintain the soil pH.
It increases the sugarcane yield. Fertilizers are used to increase the plant growth and compost is used to improve the soil fertility. In the previous researches effective microorganisms are used to fasten the biodegradation of sugarcane trash. Cow dung slurry, lime powder, press mud are also some other treatments used to fasten the degradation of sugarcane trash.
III. MATERIALS AND METHODOLOGY
In the present study raw material sugarcane trash is collected from the agricultural field, Akkimaradi village, Bagalkot district. The Sugarcane trash is shredded directly into small pieces of size 5mm approximately. For the decomposition, pressmud is collected from the Sameerawadi sugar factory. Cowdung is freshly collected locally from the farmer, lime powder is purchased from market, waste decomposer solution is purchased from Siddaganga Oil and Bio Industries LLP., Tumkur and fungal inoculums (cellulose degrading Aspergillus sps) is collected from Biotechnology department, BEC, Bagalkot. Plastic containers of different sizes are taken for the experiment setup. Six different combinations are prepared as shown below:
1] Sugarcane Trash + Lime powder ----------------------- SLP
2] Sugarcane Trash + Cow Dung -------------------------- SCD
3] Sugarcane Trash + Waste Decomposer Solution ---- SWD
4] Sugarcane Trash + Press Mud ---------------------------SPM
5] Sugarcane Trash + Fungal Inoculum -------------------SFI
6] Sugarcane Trash only – control -------------------------S
A. Preparation of inoculants / Treatment Samples
Fungal inoculum is prepared in the laboratory using the potato dextrose (PD broth) media. 20 grams of dextrose is dissolved in another 500ml of water. 250grams of washed, pealed and sliced potatoes is taken in around 500ml of water. Potato extract is obtained by boiling potato slices for 30 minutes, then filtered using muslin cloth and added to dextrose solution. Total volume is made up to 1000ml using distilled water, then it is sterilised at 15lb pressure for 15 minutes in autoclave. Fungal pure culture collected from department of biotechnology, BEC, Bagalkot is used to make fresh cultures. Spores are inoculated in PD broth and incubated at 35oC in shaking incubator for 3 days. After 3 days of growth, the fungal suspension culture is used for treatment.
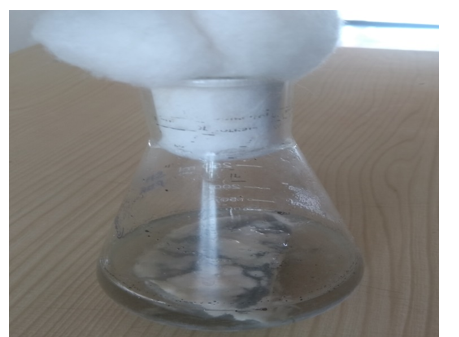
Fig 2.1 Fungal growth in PDA broth prepared in the Lab
B. Preparation of Raw materials
The dried sugarcane leaves are cleaned and cut into pieces. Then grinded to make powder form (5mm size approximately). Cleaned Plastic boxes are taken and each box is filled with 100gm of sugarcane trash and 30gms of treatment material, total 6 containers are used in the set of experiments. The materials are taken in different proportions in the plastic boxes are kept for degradation by maintaining the 60-70% of moisture content in the room temperature. The containers are monitored daily and mixed properly for uniform degradation. Compost is analysed after 15 days of interval, using colorimeter with specified wavelengths.
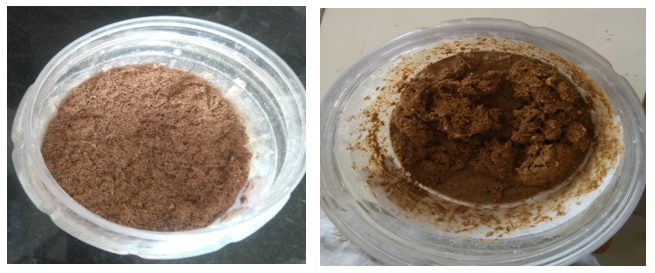
Fig 2.2 Mixing of Samples in Containers
C. Preparation of samples for analysis
Trash is an organic biomass material which is added with different treatments and water, degradation of the material will happen physically and chemically. Particle size and volume of the compost is reducing with respect to time. A biochemical reaction also exists due to the microorganisms and properties of other materials. After observing changes in all the containers, compost samples are prepared for nutrient analysis. A known quantity of liquid is filtered from the compost samples through Whatman No. 40 filter paper, from all the containers in different test tubes for analysis. Nitrogen, phosphorous, Potassium and Sulphur analysis are conducted for samples using colorimeter and titration method. Vortex mixer is used to mix the chemicals and samples homogeneously.
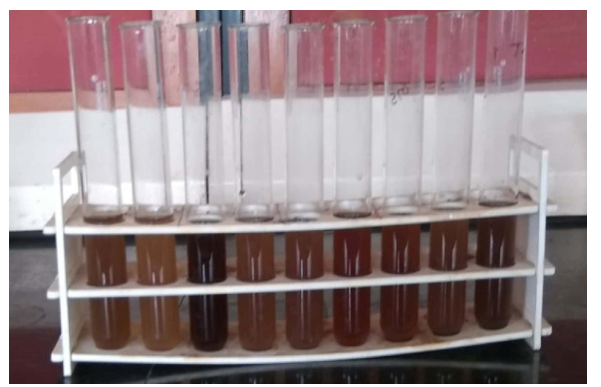
Fig 2.3 Samples for analysis
D. Experimental Setup
To achieve the objectives of this study the experimental setup is prepared. During the experimental work sugarcane trash is mixed with the other treatments in different proportions as shown in the table 2.1 and fig 2.4
Table 2.1 Treatments added to Trash
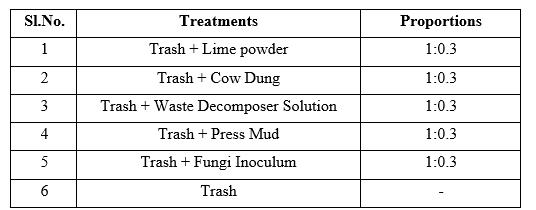
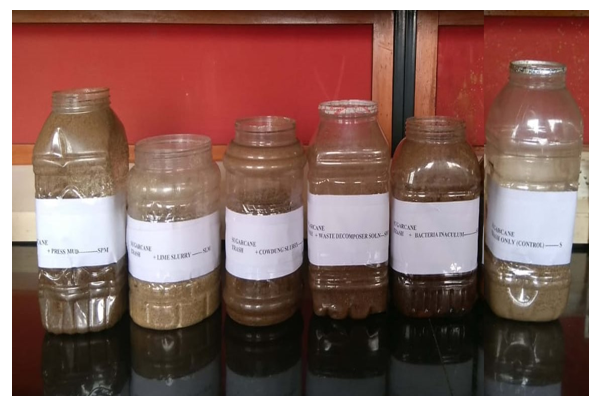
Fig 2.4 Experimental Setup of Treatments
In the above treatments to find the effective methods of fastening the degradation of trash, quality analysis of compost are conducted. By selecting the two best effective methods of fastening the degradation of trash, RSM is applied to optimize the degradation of Sugarcane Trash as per table 2.1.
III. RESULTS AND DISCUSSION
A. Experimental Analysis
In the experimental setup of samples, all the six combinations are analysed for nutrient contents. Trash is mixed with the treatments like lime powder, cowdung, waste decomposer solution, pressmud and fungi inoculum, and is kept for degradation. One control trash is also maintained to compare the results. As the time is running there is physical and chemical changes in the samples. To check the quality of the compost N, P, K and S analysis are conducted at 0 days, 15 days and 30 days and the results are as shown below.
1) Nitrogen (N) Analysis
In the Nitrogen analysis of the samples, all the combinations are analysed at 0 days, after 15 days and 30 days. The results of Nitrogen content for each combination are shown in the graph. All the bar graphs showing the results in the increasing order as the time is proceeding. They are showing at 0 days, lower values of %N, and at 30 days higher values of %N. It indicates that Nitrogen content in the compost is increasing as the degradation is proceeding. After 30 days it is showing Trash + Pressmud and Trash + Lime are having the highest % of Nitrogen. Remaining values are lesser than these values. Higher % of Nitrogen, higher is the compost quality. In the other combinations % of Nitrogen is less because of properties of other materials, and reaction with trash. (Fig 3.1). As shown in the below graph for trash, N is at 0 days is 0.35%, at 15 days it was 1.5% and at 30 days it is increased to 1.82%. For Trash + Pressmud %N is at 0 days is 1.43, at 15 days it was found 2.00 and at 30 days it was increased to 2.49. For Trash + Lime %N is at 0 days is 1.27, at 15 days it is 1.67 and at 30 days it is increased to 2.11. For Trash + Cowdung % N value at 0 days is 1.12, at 15 days it was 1.58 and at 30 days it is increased to 1.94.
For Trash + Waste Decomposer %N is at 0 days is 1.34, at 15 days it is 1.73 and at 30 days it is increased to 1.89. For Trash + Fungi Inoculum % N value at 0 days is 1.22, at 15 days the value is 1.61 and at 30 days it is increased to 1.74. (Fig 3.1).
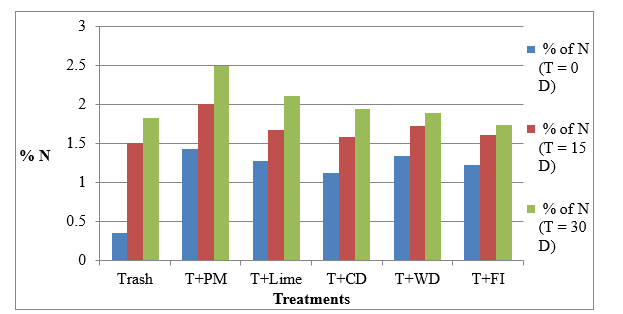
Fig 3.1 Nitrogen analysis
Trash with cowdung are showing %N value as 1.53 after 30 days of degradation. [5]. In this study Trash with cowdung are showing %N value as 1.94 after 30 days of degradation. Trash with pressmud are showing %N value as 2.82 after 30 days of degradation. [13]. In this study Trash with pressmud are showing %N value as 2.00 after 30 days of degradation.
2) Phosphorous (P) Analysis
In the Phosphorous analysis of samples, all the combinations are analysed at 0 days, after 15 days and 30 days. The results of Phosphorous content for each combination are shown in the graph. All the bar graphs showing the results in the increasing order as the time is proceeding. They are showing at 0 days, lower values of %P, and at 30 days higher values of %P. It indicates that Phosphorous content in the compost is increasing as the degradation is proceeding. After 30 days it is showing Trash + Pressmud and Trash + Lime are having the highest % Phosphorous.
Remaining values are lesser than these values. Higher % Phosphorous, higher is the compost quality. In the other combinations % Phosphorous is less because of properties of other materials and reaction with trash. As shown in the below graph for trash, P is at 0 days is 0.03%, at 15 days it was 0.04% and at 30 days it is increased to 0.13%. For Trash + Pressmud %P is at 0 days is 0.81, at 15 days it was found 0.96 and at 30 days it was increased to 1.38. For Trash + Lime %P is at 0 days is 0.76, at 15 days it is 0.89 and at 30 days it is increased to 1.43. For Trash + Cow dung %P value at 0 days is 0.37, at 15 days it was 0.69 and at 30 days it is increased to 1.24. For Trash + Waste Decomposer %P is at 0 days is 0.29, at 15 days it is 0.42 and at 30 days it is increased to 1.31. For Trash + Fungi Inoculum %P value at 0 days is 0.32, at 15 days the value is 0.54 and at 30 days it is increased to 1.24. (Fig 3.2).
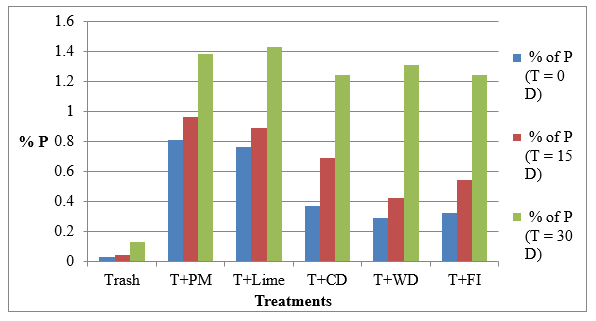
Fig 3.2 Phosphorous analysis
In this study Trash with cowdung are showing %P value as 1.53 after 30 days of degradation. [5]. Trash with cowdung are showing %P value as 2.32 after 20 weeks of degradation. [13] Trash with pressmud are showing %P value as 2.32 after 20 weeks of degradation. [13]. In this study Trash with pressmud are showing %P value as 1.38 after 30 days of degradation.
3) Potassium (K) Analysis
In the Potassium analysis of samples, all the combinations are analysed at 0 days, after 15 days and 30 days. The results of Potassium content for each combination are shown in the graph. All the bar graphs showing the results in the increasing order as the time is proceeding. They are showing at 0 days, lower values of %K, and at 30 days higher values of %K. It indicates that Potassium content in the compost is increasing as the degradation is proceeding. After 30 days it is showing Trash + Pressmud and Trash + Lime are having the highest %Potassium. Remaining values are lesser than these values. Higher % Potassium, higher is the compost quality. In other combinations % Potassium is less because of properties of other materials, and reaction with trash.As shown in the below graph for trash, K is at 0 days is 0.05%, at 15 days it was 0.09% and at 30 days it is increased to 0.12%. For Trash + Pressmud %K is at 0 days is 0.11, at 15 days it was found 0.22 and at 30 days it was increased to 0.43. For Trash + Lime %K is at 0 days is 0.12, at 15 days it is 0.28 and at 30 days it is increased to 0.37. For Trash + Cow dung %K value at 0 days is 0.07, at 15 days it was 0.13 and at 30 days it is increased to 0.22. For Trash + Waste Decomposer %K is at 0 days is 0.09, at 15 days it is 0.13 and at 30 days it is increased to 0.24. For Trash + Fungi Inoculum %K value at 0 days is 0.04, at 15 days the value is 0.08 and at 30 days it is increased to 0.21. (Fig 3.3).
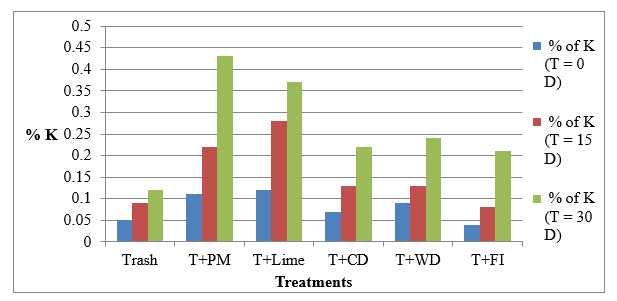
Fig 3.3 Potassium analysis
In this study Trash with cowdung are showing %K value as 0.22 after 30 days of degradation. [5]. Trash with cowdung are showing %K value as 0.31 after 20 weeks of degradation. [13] Trash with pressmud are showing %K value as 0.57 after 20 weeks of degradation. [13]. In this study Trash with pressmud are showing %K value as 0.43 after 30 days of degradation.
4) Sulphur (S) Analysis
In the Sulphur analysis of samples, all the combinations are analysed at 0 days, after 15 days and 30 days. The results of Sulphur content for each combination are shown in the graph. All the bar graphs showing the results in the increasing order as the time is proceeding. They are showing at 0 days, lower values of %S, and at 30 days higher values of %S.
It indicates that Sulphur content in the compost is increasing as the degradation is proceeding. After 30 days it is showing Trash + Pressmud and Trash + Lime are having the highest % Sulphur. Remaining values are lesser than these values. Higher % Sulphur, higher is the compost quality. In the other combinations % Sulphur is less because of properties of other materials, and reaction with trash.
As shown in the below graph for trash, S is at 0 days is 0.1%, at 15 days it was 0.38% and at 30 days it is increased to 0.56%. For Trash + Pressmud %S is at 0 days is 1.33, at 15 days it was found 1.9 and at 30 days it was increased to 2.2. For Trash + Lime %S is at 0 days is 1.27, at 15 days it is 1.89 and at 30 days it is increased to 2.15. For Trash + Cow dung %S value at 0 days is 0.87, at 15 days it was 1.56 and at 30 days it is increased to 2.00. For Trash + Waste Decomposer %S is at 0 days is 1.12, at 15 days it is 1.71 and at 30 days it is increased to 2.02. For Trash + Fungi Inoculum %S value at 0 days is 1.02, at 15 days the value is 1.46 and at 30 days it is increased to 1.93. (Fig 3.4).
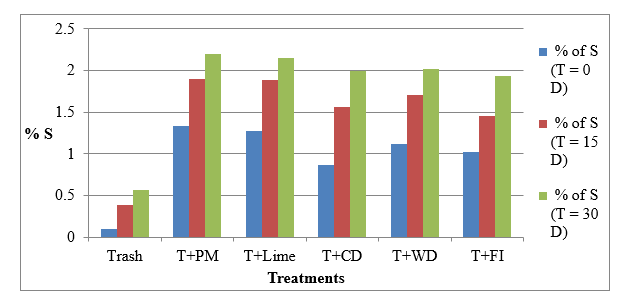
Fig 3.4 Sulphur analysis
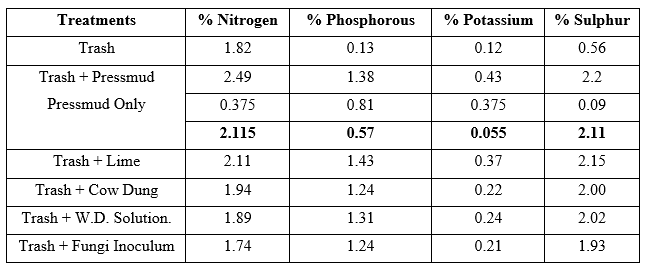
In this study Trash with cowdung are showing %S value as 2.00 after 30 days of degradation. [5]. Trash with cowdung are showing %S value as 2.31 after 20 weeks of degradation. [13] Trash with pressmud are showing %S value as 1.57 after 20 weeks of degradation. [13]. In this study Trash with pressmud are showing %S value as 1.9 after 30 days of degradation. Pressmud treatment showed significant NPKS production, hence pressmud composition is analysed. The pressmud used in the present study contains N-1.25%, P-2.7%, K-1.25%, and S-0.3%.
Table 3.10 Values of NPKS for all the treatments
Although pressmud is having nutrients, it is not permitted to use as compost directly, as it affects the human health. Hence to utilise the pressmud effectively, it is mixed with trash to convert into organic compost, which improves the soil condition and crop yield.
Conclusion
1) The effective method of degradation is found in the Trash + Lime and Trash + Pressmud to fasten the degradation Process of sugarcane trash. 2) With 60 days of results N: P: K: S is found, 2.11: 0.57: 0.055: 2.11%. Pressmud as it is a by product and not permitted to direct use as compost, hence it can be utilised to degrade the trash and convert into a very good compost, and can be recommended. 3) Sugarcane Trash may be utilized effectively, hence air pollution can be reduced. 4) Pressmud is collected in large quantity in the sugar industry can be utilized as a compost with sugarcane trash.
References
[1] Suneela Sardar, Suhaib Umer Ilyas, Shahid Raza Malik and Kashif Javaid “Compost Fertilizer production from Sugar Press Mud”, Potential of developing Sugarcane by-products based industry in India, Sugar Tech 8 (2&3) 2006:104-111. [2] Farouk K. M. Wali, “Some Physical and Chemical Properties of Compost”, Khater ESG, International Journal of Waste Resources 2015, 5:1 [3] R.H.Ellerbrock, A. Hohn, and J. Rogasik, “Functional analysis of soil organic matter as affected by long term manurial treatment”, European Journal of Soil Science, 50, March 1999, 65-71. [4] Margaret Ojone Ogundare, and Labunmi Lajide “Physico-chemical and mineral analysis of composts fortified with NPK fertilizer, ammonium chloride and kaolin” Journal of Agricultural Chemistry and Environment, 2, 2013 27-33. [5] Sneh Goyal, S.K. Dhull, and K.K. Kapoor “Chemical and biological changes during composting of different organic wastes and assessment of compost maturity”, Bioresource Technology 96, 2005, 1584–1591. [6] Lizet Rodriguez-Machin, Luis E. Arteaga-Perezb, Raul A. Perez-Bermudeza, Yannay Casas-Ledonc, Wolter Prins, and Frederik Ronssed, “Effect of citric acid leaching on the demineralization and thermal degradation behaviour of sugarcane trash and bagasse”, Biomass and Bioenergy 108, 2018, 371–380. [7] Arushdeep Sidana and Umar Farooq,“Sugarcane Bagasse: A Potential Medium for Fungal Cultures”, Hindawi Publishing Corporation Chinese Journal of Biology, 2014. [8] Surindra Suthar, “Vermistabilization of municipal sewage sludge amended with sugarcane trash using epigeic Eisenia fetida (Oligochaeta)”, Journal of Hazardous Materials 163, 2009, 199–206. [9] Romeela Mohee, and Revin Panray Beeharry, “Life cycle analysis of compost incorporated sugarcane bioenergy systems in Mauritius”, Biomass and Bioenergy 17, 1999, 73-83. [10] Raveendran Sindhu, Edgard Gnansounou, Parameswaran Binod and Ashok Pandey “Bioconversion of sugarcane crop residue for value added products An overview”, Renewable Energy an International Journal, 2016, 1-13. [11] Letha Dawson, and Raj Boopathy, “Use of post-harvest sugarcane residue for ethanol production”, Bioresource Technology 98, 2006, 1695–1699. [12] P.M Diaz, “Consequences of Compost Press Mud as Fertilizers”, DJ International Journal of Advances in Microbiology and Microbiological Research, Vol. 1(1) 2016, pp. 28-32. [13] Timothy P. Beary, Raj Boopathy, Paul Templet, “Accelerated decomposition of sugarcane crop residue using a fungal–bacterial consortium”, International Biodeterioration & Biodegradation 50, 2001, 41 – 46.
Copyright
Copyright © 2025 Girija Awaradi, Kusuma Kumari Y. This is an open access article distributed under the Creative Commons Attribution License, which permits unrestricted use, distribution, and reproduction in any medium, provided the original work is properly cited.

Download Paper
Paper Id : IJRASET66128
Publish Date : 2024-12-26
ISSN : 2321-9653
Publisher Name : IJRASET
DOI Link : Click Here
 Submit Paper Online

