Ijraset Journal For Research in Applied Science and Engineering Technology
- Home / Ijraset
- On This Page
- Abstract
- Introduction
- Conclusion
- References
- Copyright
Design and Implementation of Water PH Level and Turbidity Monitoring System
Authors: Busari Olukayode Ayodeji, Oni Adekunle Akeem, Fakunle Ayobami Olawale, Afenifere Yusuf Babatunde
DOI Link: https://doi.org/10.22214/ijraset.2024.62456
Certificate: View Certificate
Abstract
Water pollution is one of the biggest fears for the green globalization. In order to ensure the safe supply of the drinking water, the quality needs to be monitored in real time. In this paper, a design and development of a low cost system for real time monitoring of the water quality using turbidity and pH sensor was presented. The system consists of several sensors used in measuring physical and chemical parameters of water. The parameters such as pH and turbidity of the water were considered. The measured values from the sensors were processed by ATMEGA328P micro controller and displayed on the LCD used. The results showed different values on pH scale as they were examined by comparing the result values with the programmed values in order to check the acidity and alkalinity of each samples. Also the turbidity by categorizing the samples under the following parameters: clean, cloudy, dirty and the comments were satisfactory. Therefore, the classification of water according to its quality was covered and should be considered acceptable for the consumption for both man and animal.
Introduction
I. INTRODUCTION
Human well-being relies on water and the ecosystems that it supports. A watershed's water distribution, timing, storage, and quality have an impact on the social, economic, and ecological systems that affect people's daily life. Therefore, water managers are interested in how policies on water management, projects, and infrastructure operations can be implemented to enhance human well-being, as well as the quantity and quality of water as it flows through the cycle. Because drinking water quality can have a direct or indirect impact on human health, it is imperative to test it before using it in daily life[1]. The most important parameters in measuring water pollution are Potential of Hydrogen (pH) and Turbidity. In addition, low pH levels kill fish by stressing their animal systems and causing physical damage, which in turn makes them more susceptible to disease. On the other hand, alkaline water (high pH levels) can reduce the solubility of essential nutrients like phosphorus and iron, limiting their availability to primary producers and affecting the productivity of aquatic ecosystems[2]. The most common cause of water quality issues is the high content of ion(iii)oxide and magnesium in raw water. Conversely, excessive turbidity causes pollutants to be transported and dispersed more widely in water bodies, which in turn degrades the quality of the water, reduces biodiversity, and poses health hazards to both humans and aquatic life. Meanwhile, due to decreased particle trapping and dilution capability brought on by low turbidity, clear water bodies may be more susceptible to fertilizer runoff, algal blooms, and other types of pollution[3] .
A. Water Potential of Hydrogen (pH)
pH is a numerical scale that indicates how basic or acidic an aqueous solution is. The range of the scale is 0 to 14. It is more acidic if it is positioned lower on the scale. It is more basic, or alkaline, if it is positioned higher on the scale. Vegetables like kale, bell peppers, and beets are high in alkalinity, while processed foods and goods like yogurt, fish, and cheese are usually more acidic.
With a pH of 7, pure water is regarded as neutral and is situated exactly in the middle of the scale. Regretfully, water is rarely at this precise level and is not always pure. It is a concern on how the pH levels of water change. There are many contributing factors that can affect the acidity and alkalinity of water. The first and most prominent of these is the bedrock and soil composition in which the water is located. Depending on the rock type, acidity in the water might be neutralized. On the other hand, plant growth and organic material located near the water can actually increase acidity due to the emission of carbon dioxide when decomposition occurs. Other factors include the dumping of chemicals, acid precipitation, and coal mine drainage[4].
The pH levels in drinking water are monitored extremely closely and are required to be kept in a range of 6.5–8.5 by the Environmental Protection Agency (EPA). The reason for this is due to the possibility that consuming acidic or alkaline water could have negative effects if not carefully controlled. Water has an acidic nature when its pH is lower than 7.
This indicates that from plumping and many other metal fixtures, it might contain iron, copper, lead, or zinc. It's going to taste metallic and bitter. Although it doesn't endanger health, high alkaline water can have negative effects. There will be precipitate or scale buildup on dishes, utensils, fittings, and pipes. It will feel slick to the touch and taste like baking soda. Therefore, given the numerous issues that water pollution poses, it is imperative that we properly monitor the water that will be used for crops and human consumption[5].
B. Water Turbidity Level
The measurement of turbidity is a key test of water quality. Fluids can contain suspended solid matter consisting of particles of many different sizes. While some suspended material will be large enough and heavy enough to settle rapidly to the bottom of the container if a liquid sample is left to stand (the settable solids), very small particles will settle only very slowly or not at all if the sample is regularly agitated or the particles are colloidal. These small solid particles cause the liquid to appear turbid.
II. LITERATURE SURVEY
Traditional water quality measurement techniques involve samples collection on site and subsequent laboratory-based chemical analysis . Ijaradar et al., developed a real time water quality monitoring system prototype for water quality monitoring in Residential home . The development was preceded by evaluation of prevailing environment including availability of cellular network coverage at the site of operation. The system consists of a Raspberry Pi, Analog to Digital Converter, Water quality measurement sensors. It detects water temperature, dissolved oxygen, pH, and electrical conductivity in real-time and disseminates the information in graphical and tabular formats to relevant stakeholders through a web-based portal and mobile phone platforms. The experimental results show that the system has great prospect and can be used to operate in real world environment for optimum control and protection of water resources by providing key actors with relevant and timely information to facilitate quick action taking[6].
Keshipeddi Introduced internet of Things (ioT) into water monitoring system in india. In conventional systems, the monitoring process involves the manual collection of sample water from various regions, followed by testing and analysis. The sensors connected with Arduino-uno in discrete way to detect the water parameters and to display in a desktop application. The quality of water was monitored continuously, to ensure the safe supply of water from any water bodies and water resources for drinkable and using it and that continuous measurement of water condition based on the parameters IoT helps it in improving the health and living standards of all living things[7]. Bhatt and Patoliya developed a water monitoring system using internet of things (iot) . This system consists some sensors which measure the water quality parameter such as pH, turbidity, conductivity, dissolved oxygen, temperature. The measured values from the sensors are processed by microcontroller and this processed values are transmitted remotely to the core controller that is raspberry pi using Zigbee protocol. Finally, sensors data can view on internet browser application using cloud computing.[8]
Lom et al., proposed the conjunction of the Smart City Initiative and the concept of Industry 4.0. The main reasons for the emergence of the Smart City Initiative are to create a sustainable model for cities and preserve quality of life of their citizens. In the concept of Industry 4.0, the Internet of Things (IoT) was used for the development of so-called smart products. Added intelligence is used both during the manufacturing of a product as well as during subsequent handling, up to continuous monitoring of the product lifecycle (smart processes). IoT, IoS, IoP and IoE can be considered as an element that can create a connection of the Smart City Initiative and Industry 4.0 - Industry 4.0 can be seen as a part of smart cities. Interconnection of these systems can be expected to change - transport processes from design logistic processes through to their online optimization with respect to the chosen objective function and the latest information from the transport infrastructure. Linking information from process-based Industry 4.0 with intelligent transport systems of the smart city could create very effective, demand-oriented and higher productivity of manufacturing enterprises as well as sustainable development of society.[9] Kartakis et al., presented the burst detection and localization scheme that combines lightweight compression and anomaly detection with graph topology analytics for water distribution networks. It was showed that the approach was not only significantly reduces the amount of communications between sensor devices and the back end servers, but also can effectively localize water burst events by using the difference in the arrival times of the vibration variations detected at sensor locations. The results can save up to 90% communications compared with traditional periodical reporting situations.[10][11]
III. METHODOLOGY
The report then provides detailed guidance on water monitoring as a means of measuring and managing the benefits that contribute to regional security.
Characterization of water systems requires monitoring of the flow, storage and use of water, and comprehensive watershed monitoring inevitably incorporates socioeconomic parameters along with the more typical biophysical ones.
A. System Design
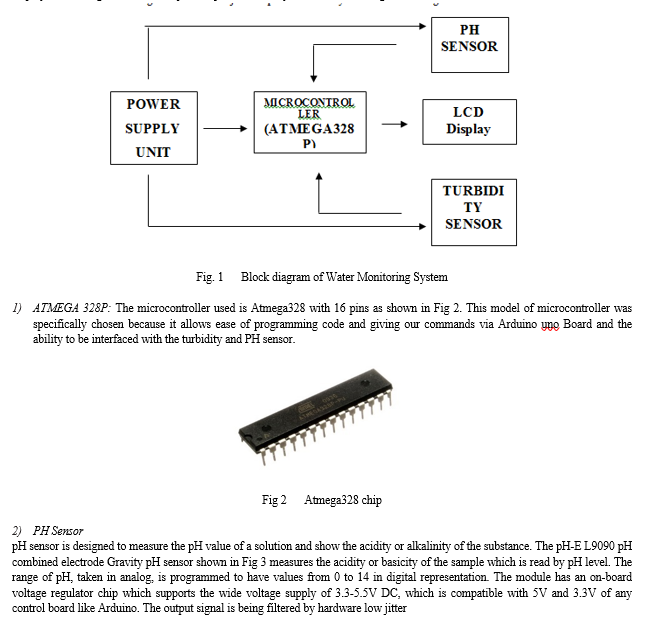
The backbone of this design the use of PH Sensor, Turbidity Sensor, Atmega Microcontroller, Voltage regulators and 16x2 LCD display. The arrangement of the major component of the system is shown in Fig 1


B. Hardware Implementation
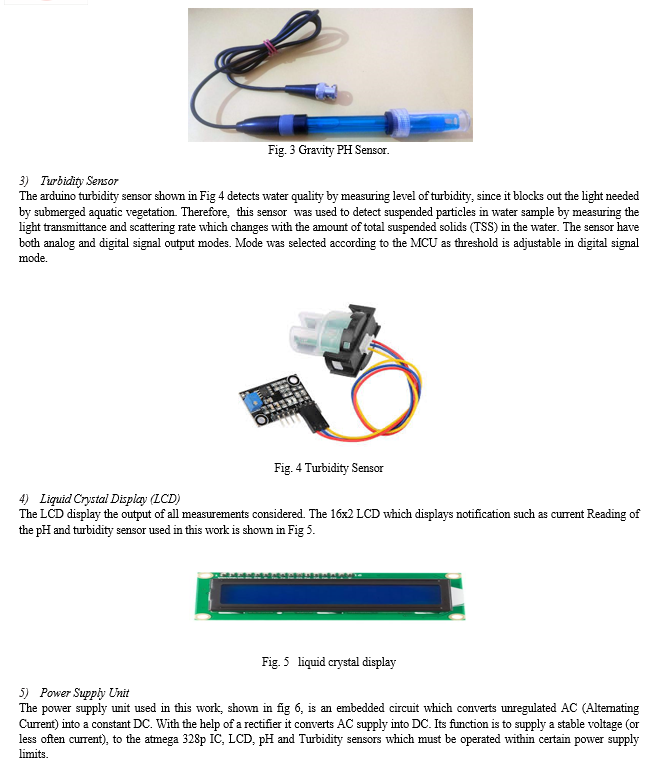
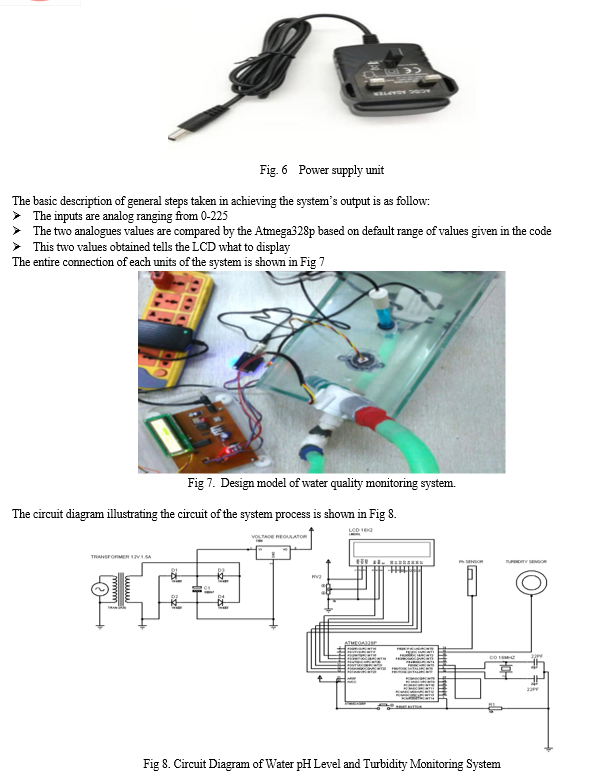
The pH meter has two basic component; the meter itself, which is a moving-coil meter (one with a pointer that moves against a scale) and a digital meter (one with a numeric display), and a probe that is inserted into the solution being tested. To make electricity flow, a complete electrical circuit has to be created; so, to make electricity flow through the test solution, two electrodes (electrical terminals) were put into it. Using one probe, both of the two electrodes are built inside it for simplicity and convenience. The electrodes aren’t like normal electrodes simple pieces of metal wire); each one is a mini chemical set in its own right. The electrode that does the most important job, which is called the glass electrode has a silver-based electrical wire suspended in a solution of potassium chloride contained inside a thin bulb (or membrane) made from a special glass containing metal salts (typically compounds of sodium and potassium). The other electrode is called the reference electrode and has a potassium chloride wire suspended in a solution of potassium chloride. This generate series of analog signals sent to the Atmega 328p IC converted to digital values ranging from 1-14, this is used to determine the PH level of the solution.
At the same time, turbidity probe works by sending a light beam into the water to be tested. This light would now scattered by any suspended particles. A light detector wass placed at (usually) a 90 degree to the light source, and detects the amount of the light that is reflected back at it. The amount reflected was used to determine the particle density within the water. The more light that was detected; the more particles were present in the water. This amount of light values were also sent to the atmega 328 IC for processing the level of turbidity, comparing these two values of the PH scale and turbidity sensor, a display is shown on the LCD indicating pH level and turbidity and also if the water is drinkable or not.
Testing Procedures
The following are the procedure taken in carrying out the test in the course of the work;
Step 1: Preparation of different water samples and some related liquid to be tested.
Step 2: Connect the sensors ( pH and Turbidity) to their respective ports.
Step 3: Connect the system to the power source and power on the system.
Step 4: Insert the sensors to the samples needed to be tested and shake the sensors in respective samples for five seconds.
Step 5: Press the start button to take the readings of the pH and turbidity.
Step 6: Record the values of the pH and turbidity readings displayed on the LCD.
Step 7: Repeat the test for accurate readings
IV. EXPERIMENTAL RESULTS
Nine different liquid samples were used to test the system. They include: such sachet water; coke drink; sea water; stream water; Limca drink; Well water; Rain water; soapy water and erosion water. It was observed that different values for turbidity and pH scale were displayed by the system through the LCD and the values were taken. The reading of the samples tested and comments for each test are shown in Table 1. The pH of the samples is said to be neutral when it is between the ranges of 6.5-8.5, it is acidic when it is below 6.5 and above 8.5 is said to be basic.
Table 1 pH and turbidity values for different samples
|
S/N |
SAMPLES |
pH READINGS |
TURBIDITY |
COMMENT |
|
1 |
Sachet water |
7.5 |
Clean |
Satisfactory |
|
2 |
Coke drink |
4.23 |
Clean |
Good |
|
3 |
Sea water |
6.59 |
Clean |
Good |
|
4 |
Stream water |
8.0 |
Clean |
Satisfactory |
|
5 |
Limca drink |
5.55 |
Cloudy/Dirty |
Good |
|
6 |
Well water |
7.49 |
Clean |
Satisfactory |
|
7 |
Rain water |
7.1 |
Clean |
Satisfactory |
|
8 |
Soapy water |
12.2 |
Cloudy |
Poor |
|
9 |
Erosion water |
7.4 |
Dirty |
Poor |
The following comment was used to classify the tested samples to show their quality in respect to both man and animal consumption:
- Satisfactory- This indicate that the samples can be consumed regularly with no negative effect on both man and animal
- Good- This indicate that the samples should not be consumed regularly due to it bad effect if too much of the content is consumed.
- Poor- This indicate that the samples is poisonous and not good for consumption.
Conclusion
The classification of water according to its quality is reviewed with a specific definition for each type. Although, water quality requirements differ depending on the proposed used of water. As reported by Tchobanoglous, “water unsuitable for one use may be quite satisfactory for another and water may be considered acceptable for a particular use if water of better quality is not available[12].” Given the results of different water samples considered, the pH levels in drinking are suggested to be kept in a range of 6.5–8.5 by the Environmental Protection Agency (EPA). The further work should consider an improvement on the efficiency of the constructed water quality by adding more quality control parameter such as temperature, dissolved oxygen, conductivity.
References
[1] Bhardwaj, Jyotirmoy, Karunesh K. Gupta, and Rajiv Gupta. \"Towards a cyber-physical era: soft computing framework based multi-sensor array for water quality monitoring.\" Drinking Water Engineering and Science 11.1 (2018): 9-17. [2] Borden, Carter, and Dimple Roy. Water quality monitoring system design. Manitoba: International Institute for Sustainable Development, 2015. [3] Ijaradar, Jyotirmaya, and Subhasish Chatterjee. \"Real-time water quality monitoring system.\" International Research Journal of Engineering and Technology 5.3 (2018): 1166-1171. [4] Khatri, Punit, Karunesh Kumar Gupta, and Raj Kumar Gupta. \"Raspberry Pi-based smart sensing platform for drinking-water quality monitoring system: A Python framework approach.\" Drinking Water Engineering and Science 12.1 (2019): 31-37. [5] Keshipeddi, Sai Bhatt. \"IoT Based Smart Water Quality Monitoring System.\" Available at SSRN 3904842 (2021). [6] Jayti Bhatt, Jignesh Patoliya, Iot Based Water Quality Monitoring System, IRFIC, 21feb,2016. [7] Silva Junior, Andouglas Goncalves da, et al. \"Towards a real-time embedded system for water monitoring installed in a robotic sailboat.\" Sensors 16.8 (2016): 1226. [8] Lom, Michal, Ondrej Pribyl, and Miroslav Svitek. \"Industry 4.0 as a part of smart cities.\" 2016 Smart Cities Symposium Prague (SCSP). IEEE, 2016. [9] Kedia, Nikhil. \"Water quality monitoring for rural areas-a sensor cloud based economical project.\" 2015 1st International Conference on Next Generation Computing Technologies (NGCT). IEEE, 2015. [10] Khatri, Punit, Karunesh Kumar Gupta, and Raj Kumar Gupta. \"Raspberry Pi-based smart sensing platform for drinking-water quality monitoring system: A Python framework approach.\" Drinking Water Engineering and Science 12.1 (2019): 31-37. [11] Sharifah Nurulhuda Tum Mahid Yasin The development of water quality monitoring system using IOT, Journals of Education and Learning Studies, University Tun Hussein Onn Malaysia, 3.1, (2020): 14-20. [12] Sokratis Kartakis, Weiren Yu, Reza Akhavan, and Julie A. McCann, IEEE First International Conference on Internet-of-Things Design and Implementation, (2016 ) 978- 1-4673-9948-7/16 © 2016IEE [13] VeerasekharReddy, B., et al. \"Water Quality Monitoring System using IoT and Cloud.\" 2023 International Conference on Sustainable Computing and Smart Systems (ICSCSS). IEEE 2023.
Copyright
Copyright © 2024 Busari Olukayode Ayodeji, Oni Adekunle Akeem, Fakunle Ayobami Olawale, Afenifere Yusuf Babatunde. This is an open access article distributed under the Creative Commons Attribution License, which permits unrestricted use, distribution, and reproduction in any medium, provided the original work is properly cited.

Download Paper
Paper Id : IJRASET62456
Publish Date : 2024-05-21
ISSN : 2321-9653
Publisher Name : IJRASET
DOI Link : Click Here
 Submit Paper Online

