Ijraset Journal For Research in Applied Science and Engineering Technology
- Home / Ijraset
- On This Page
- Abstract
- Introduction
- Conclusion
- References
- Copyright
An Experimental Investigations on Design and Weight Optimization for a Light Motor Vehicle (LMV) Drive Shaft Using a Composite Material Aluminum and Glass Fiber (Al + GF)
Authors: Shailaja V. Navghar, Sanjay A. Pawar, Rahul S. Autade, Dr. Duradundi Sawant Badkar
DOI Link: https://doi.org/10.22214/ijraset.2024.64828
Certificate: View Certificate
Abstract
Aluminum is primarily used in Metal Composites because of its lighter weight and higher strength. Glass fibers are wound around an aluminum shaft to create the composite. ANSYS results determine the relative amounts of aluminum and E-glass fiber in each shaft. The purpose of this study is to use a torsion test to evaluate the mechanical performance of a composite shaft composed of aluminum and glass fiber. The results are carefully examined for different combinations of glass fiber layers and aluminum layers. When the weight proportion of aluminum in the composite increases, the mechanical properties of the composites improve.
Introduction
I. INTRODUCTION
Torque must be transmitted to the back wheels from the engine and gearbox in order for a vehicle to drive forward or backward. To ensure a steady and smooth power delivery to the axles is a critical function of the drive shaft and differential[1]. An efficient method of altering its design to meet stiffness and strength requirements is to use a composite driveshaft. Due to their relatively lower elasticity modulus, composite materials can act as shock absorbers during torque peaks in the driveline[2]. Moreover, since the thin fibers break apart instead of shattering steel sections scattering in different directions, the chance of a composite drive shaft breaking is decreased—especially in an SUV. Composite materials are frequently utilized to enhance the performance of various building types, not only automobile parts[3].
Notably, when compared to traditional materials, composites show a higher strength-to-weight ratio and an improved stiffness-to-mass ratio. As a result, they are being more and more integrated into structural elements in a variety of industrial domains, including aerospace engineering (plane wings and helicopter rotor blades) and civil engineering (bridge structures). In order to better understand the behavior of composite materials, the next section explores basic ideas [4].
A. Introduction to Drive Shaft
Automobiles utilize a component known as the drive shaft, particularly in commercial vehicles like vans, trucks, and SUVs. Its primary function is to facilitate the transfer of motion from the engine to the rear wheelswhen the engine is more than 1.5 meters away from the back wheels, a two-piece drive shaft is employed. This component is crucial for the smooth transmission of motion from the engine to the rear wheels, playing a pivotal role in the vehicle's functionality[5].
In the current automotive landscape, there is a significant emphasis on reducing weight to conserve natural resources and optimize energy efficiency. Manufacturers are focusing on weight reduction through the incorporation of superior materials, design enhancements, and improved manufacturing processes[6]. Among the components targeted for weight reduction, the suspension drive shaft stands out as a potential candidate, as it contributes to between 10% and 20% of an automobile's unsprung weight.
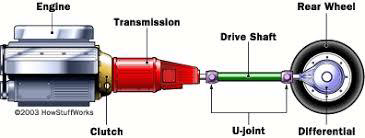
Fig. 1. One-Piece Drive Shaft
II. FINITE ELEMENT ANALYSIS
R. Courant created the finite element analysis for the first time in 1943. It is a computer-based technique that is used to model or examine the characteristics of engineering components and structures in different scenarios [7]. It is a sophisticated analytical method that takes the role of experimental testing in design. It was first applied in the nuclear and aerospace industries, where structural safety is crucial. The method's increased use nowadays can be directly linked to the recent, fast advancements in computer technology[8]. Consequently, it can handle a wide range of phenomena, including fluid flow, in addition to structural analysis problems.
Finite element analysis has a very fundamental concept. If a problem is too complicated to handle, break it up into smaller, more manageable portions that are easier to address. Then, compile all of the individual outcomes of the many components into a single solution for the overall issue, assuming that the behavior of the complex whole can be approximated by the sum of the behavior of its parts. Through the procedure, a complicated and frequently huge model is divided into small, regular-shaped subsets known as elements, resulting in a mathematical model. A limited number of connecting points, found at an element's edge and vertices, are used to watch and evaluate an element's activity as well as how it interacts with other elements. [9].
A. Steps of FEA
The FE meshing, modelling, and analysis module makes use of the commercial ANSYS program. The three phases below comprise the general structure of a finite element analysis:
- The mesh (pre-processing), the geometry, and the physical properties described.
- Using finite element analysis as a solution.
- The solution's visual representation and interpretation (post processing).
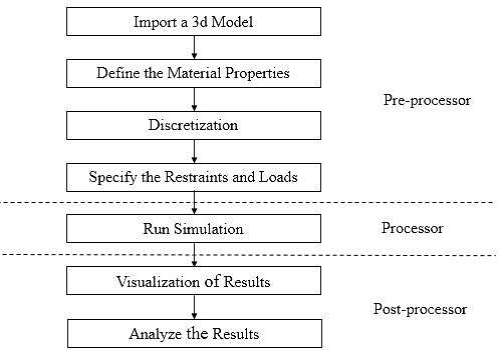
Fig.2. Process in FEA
B. Material (MS Shaft)
1) Boundary Condition
The Fig.3illustrates the boundary condition imposed on the MS (mild steel) shaft. Point "A" in represents a fixed support, indicating a location where the shaft is securely anchored and restrained from any translational or rotational movement. Meanwhile, point "B" denotes a moment applied to the shaft, specifically a moment of 59000 N-mm. This moment at point B introduces a twisting force around the shaft, potentially leading to angular deflection or deformation.
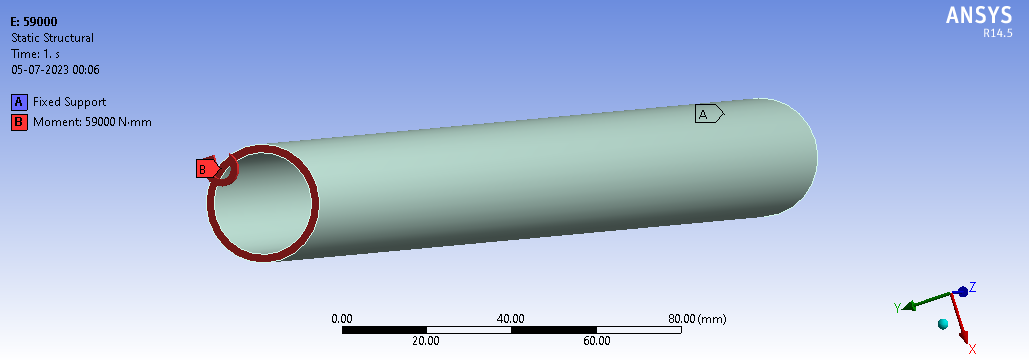 Fig.3. Boundary conditions on MS Shaft
2) Total Deformation
The Fig.4illustration displays the overall deformation experienced by the MS (mild steel) shaft in response to a moment of 59000 N-mm. In the representation, the use of the color red indicates areas of the shaft experiencing the maximum deformation, while the color blue highlights regions with the minimum deformation. Specifically, the maximum deformation, as evidenced by the red coloration in the diagram, is measured at 0.15468 mm. This information provides a visual representation of how the shaft responds to the applied moment, with varying degrees of deformation across its length.
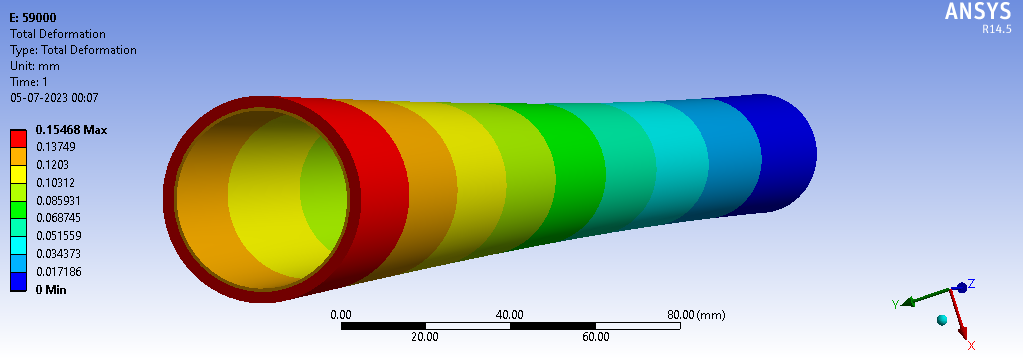 Fig.4. Total deformation of MS Shaft
3) Stress
Fig.5displays the overall stress experienced by the MS (mild steel) shaft in response to a moment of 59000 N-mm. In presentation, the use of the color red indicates areas of the shaft experiencing the maximum deformation, while the color blue highlights regions with the minimum deformation. Specifically, the maximum deformation, as evidenced by the red coloration in the diagram, is measured at 52.131 N/mm2 and minimum is 43.535 N/mm2. This information provides a visual representation of how the shaft responds to the applied moment, with varying degrees of deformation across its length.
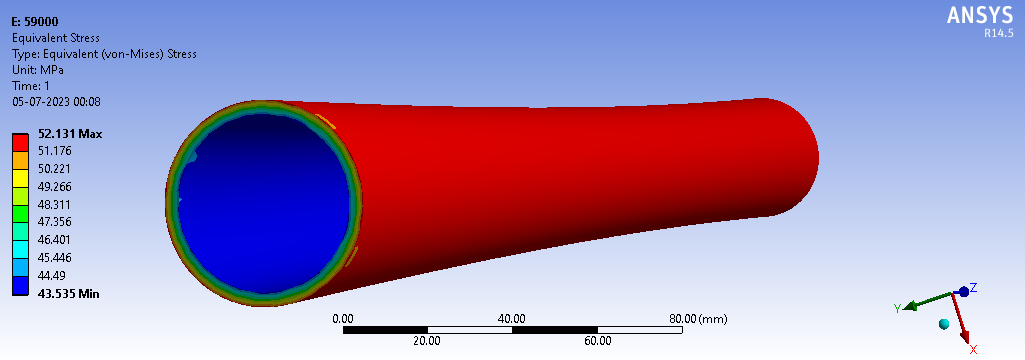 Fig.5. Stress Distribution on MS shaft
4) Shear Stress
The Fig.6 shows the overall shear stress experienced by the MS (mild steel) shaft in response to a moment of 59000 N-mm. In presentation, the use of the colour red indicates areas of the shaft experiencing the maximum deformation, while the colour blue highlights regions with the minimum deformation. Specifically, the maximum deformation, as evidenced by the red coloration in the diagram, is measured at 30.035 N/mm2 and the minimum is 25.122N/mm2. This information provides a visual representation of how the shaft responds to the applied moment, with varying degrees of deformation across its length.
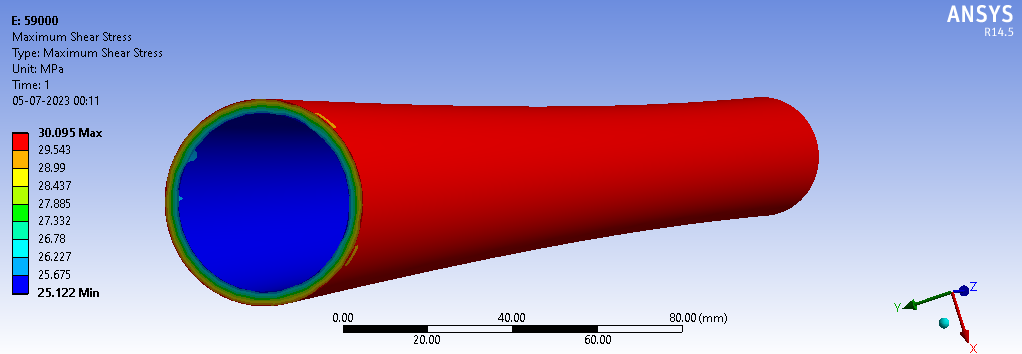 Fig.6. Shear Stress Distribution on MS shaft
C. Material 3AL + 2GF
1) Boundary Condition
The Fig.7 illustrates the boundary condition imposed on the 3AL+2GF shaft. Point "A" in the diagram represents a fixed support, indicating a location where the shaft is securely anchored and restrained from any translational or rotational movement. Meanwhile, point "B" denotes a moment applied to the shaft, specifically a moment of 59000 N-mm. This moment at point B introduces a twisting force around the shaft, potentially leading to angular deflection or deformation
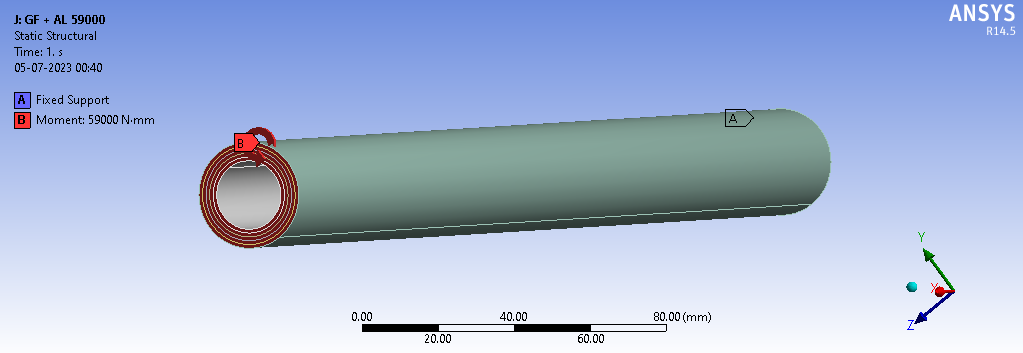 Fig.7. Boundary conditions on 3AL + 2GF shaft
2) Total Deformation
The Fig.8 illustration displays the overall deformation experienced by the3AL+2GFshaft in response to a moment of 59000 N-mm. In the representation, the use of the color red indicates areas of the shaft experiencing the maximum deformation, while the color blue highlights regions with the minimum deformation. Specifically, the maximum deformation, as evidenced by the red coloration in the diagram, is measured at 0.3756 mm. This information provides a visual representation of how the shaft responds to the applied moment, with varying degrees of deformation across its length.
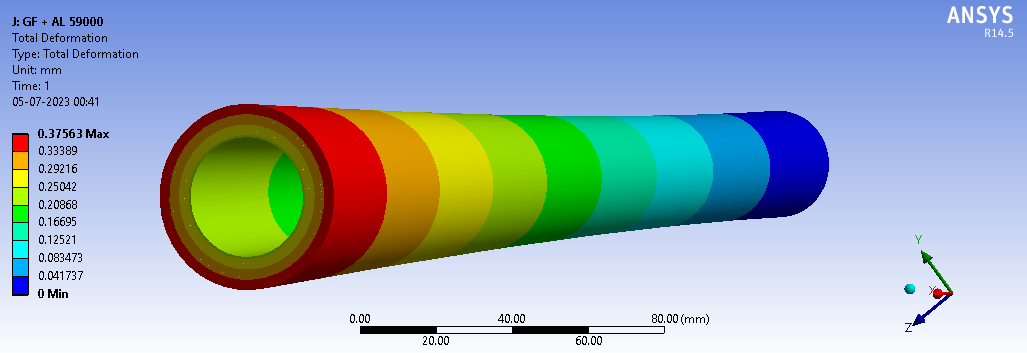 Fig.8.Total deformation on the 3AL + 2GF shaft
3) Stress
The Fig. 9 illustration displays the overall stress experienced by the 3AL + 2GF shaft in response to a moment of 59000 N-mm. In presentation, the use of the color red indicates areas of the shaft experiencing the maximum deformation, while the color blue highlights regions with the minimum deformation. Specifically, the maximum deformation, as evidenced by the red coloration in the diagram, is measured at 46.344 N/mm2 and the minimum is 2.7303 N/mm2. This information provides a visual representation of how the shaft responds to the applied moment, with varying degrees of deformation across its length.
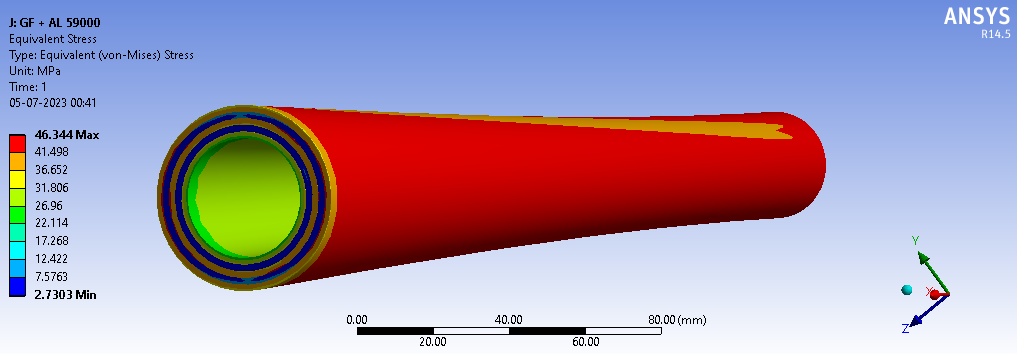 Fig.9. Stress Distribution on 3AL + 2GF shaft
4) Shear Stress
Fig.10 illustration displays the overall Shear stress experienced by the + 2GF shaft in response to a moment of 59000 N-mm. In presentation, the use of the colour red indicates areas of the shaft experiencing the maximum deformation, while the colour blue highlights regions with the minimum deformation. Specifically, the maximum deformation, as evidenced by the red colour in the diagram, is measured at 24.567 N/mm2 and the minimum is -24.568 N/mm2. This information provides a visual representation of how the shaft responds to the applied moment, with varying degrees of deformation across its length.
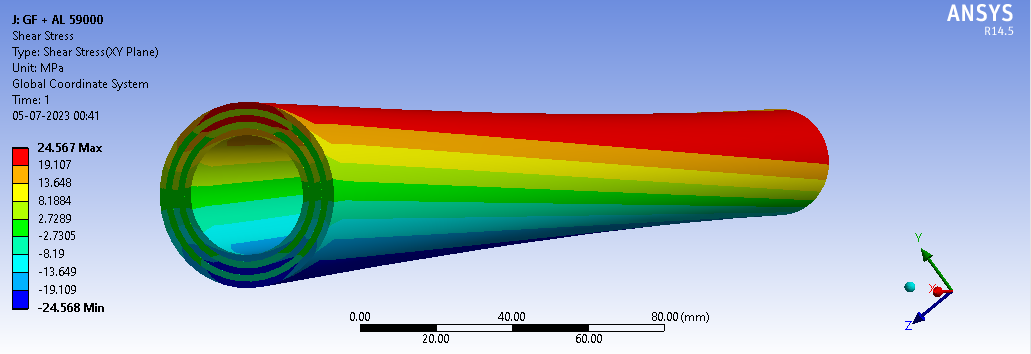 Fig.10. Shear Stress Distribution on 3AL + 2GF shaft
D. OriginalDrive Shaft Analysis
1) Boundary Condition
Fig.11 illustrates the boundary condition imposed on the Original Drive shaft. Point "A" in the diagram represents a fixed support, indicating a location where the shaft is securely anchored and restrained from any translational or rotational movement. Meanwhile, point "B" denotes a moment applied to the shaft, specifically a moment of 59000 N-mm. This moment at point B introduces a twisting force around the shaft, potentially leading to angular deflection or deformation.
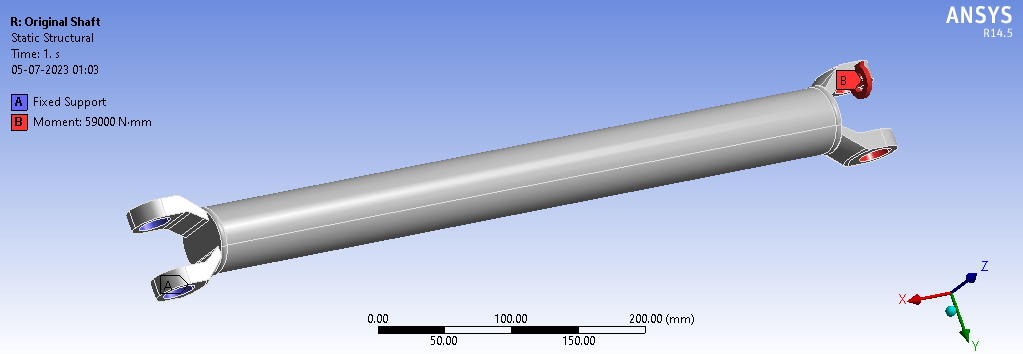 Fig.11. Boundary conditions on original drive shaft
2) Stress
Fig.12 illustration displays the overall stress experienced by the original shaft in response to a moment of 59000 N-mm. In presentation, the use of the color red indicates areas of the shaft experiencing the maximum deformation, while the color blue highlights regions with the minimum deformation. Specifically, the maximum deformation, as evidenced by the red coloration in the diagram, is measured at 20.964 N/mm2 and the minimum is 0.01707 N/mm2. This information provides a visual representation of how the shaft responds to the applied moment, with varying degrees of deformation across its length
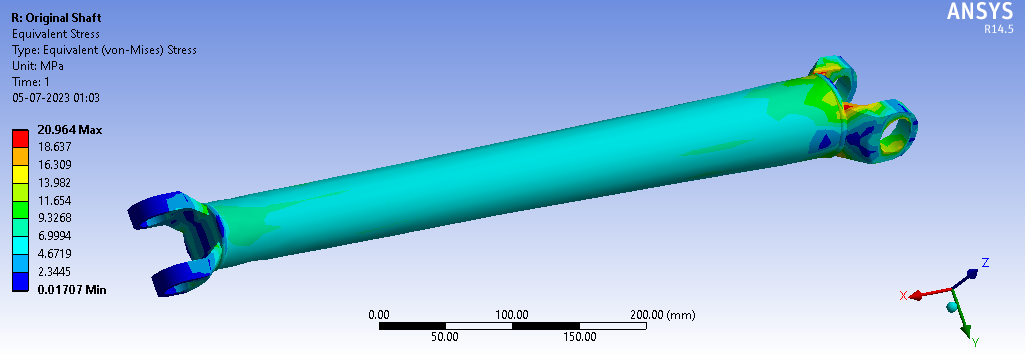 Fig.12. Stress Distribution on original shaft.
3) Deformation
Fig.13 illustration displays the overall deformation experienced by theoriginalshaft in response to a moment of 59000 N-mm. In the representation, the use of the colour red indicates areas of the shaft experiencing the maximum deformation, while the colour blue highlights regions with the minimum deformation. Specifically, the maximum deformation, as evidenced by the red coloration in the diagram, is measured at 0.056823 mm. This information provides a visual representation of how the shaft responds to the applied moment, with varying degrees of deformation across its length.
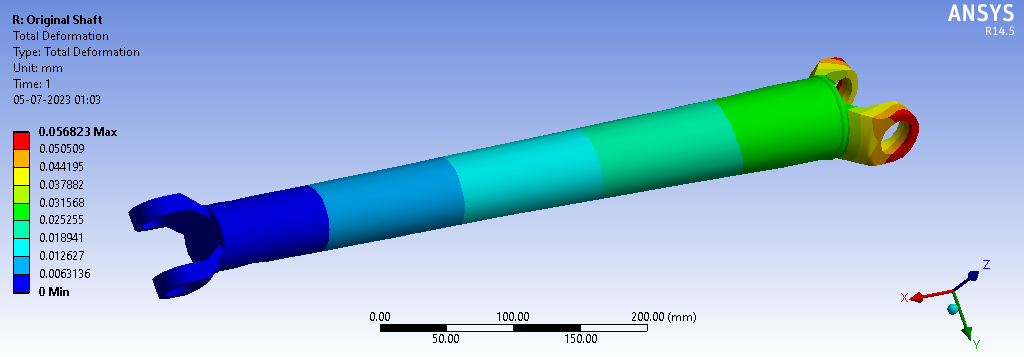 Fig.13. Total deformation on the original shaft
E. Examining the Shaft Proposal
1) Boundary Condition
The Fig.14 illustrates the boundary condition imposed on the Proposed Driveshaft. Point "A" in the diagram represents a fixed support, indicating a location where the shaft is securely anchored and restrained from any translational or rotational movement. Meanwhile, point "B" denotes a moment applied to the shaft, specifically a moment of 59000 N-mm. This moment at point B introduces a twisting force around the shaft, potentially leading to angular deflection or deformation.
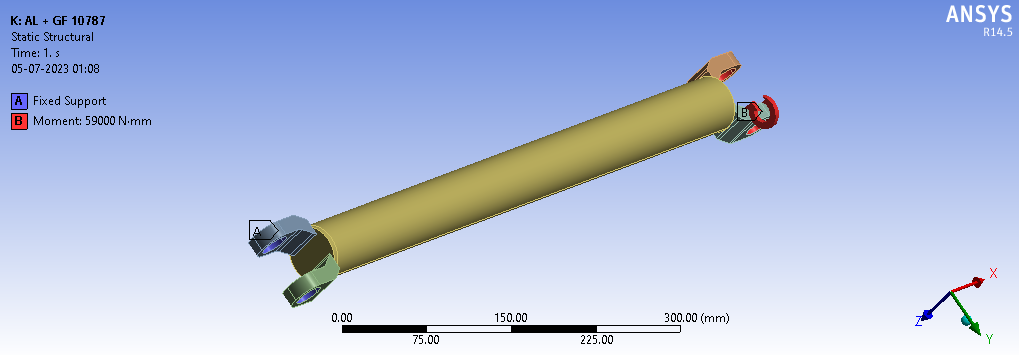 Fig.14. Boundary conditions on suggested drive shaft
2) Stress
Fig.15 illustration displays the overall stress experienced by the proposed shaft in response to a moment of 59000 N-mm. In presentation, the use of the color red indicates areas of the shaft experiencing the maximum deformation, while the color blue highlights regions with the minimum deformation. Specifically, the maximum deformation, as evidenced by the red coloration in the diagram, is measured at 38.042 N/mm2 and the minimum is 0.005078 N/mm2. This information provides a visual representation of how the shaft responds to the applied moment, with varying degrees of deformation across its length.
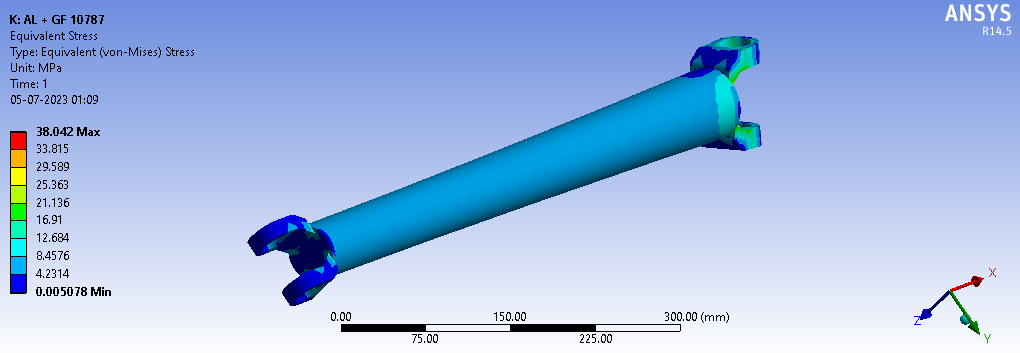 Fig.15. Stress Distribution on suggested shaft
3) Deformation
Fig.16 illustration displays the overall deformation experienced by the proposed shaft in response to a moment of 59000 N-mm. In the representation, the use of the colour red indicates areas of the shaft experiencing the maximum deformation, while the colour blue highlights regions with the minimum deformation. Specifically, the maximum deformation, as evidenced by the red coloration in the diagram, is measured at 0.13562 mm. This information provides a visual representation of how the shaft responds to the applied moment, with varying degrees of deformation across its length.
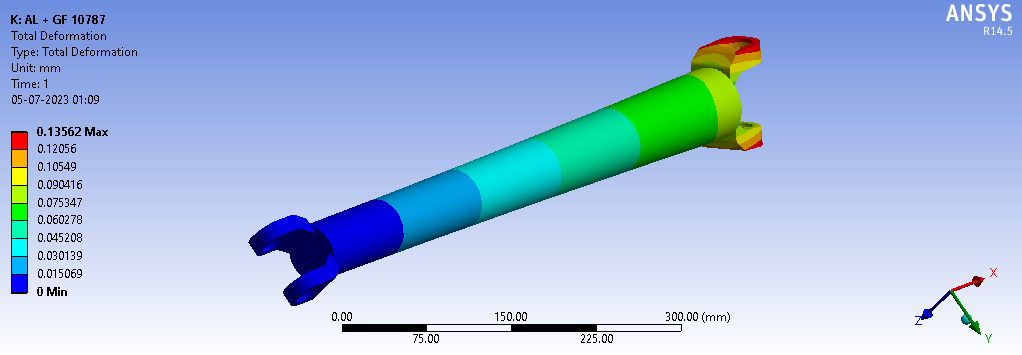 Fig.16. Total deformation on the suggested shaft
III. RESULTS AND DISCUSSION
A. FEA Results for MS shaft
Table 1 represents the FEA results for the MS shaft under different moments. The values give different results of equivalent stress, shear stress, and deformation. The same results are illustrated in Fig.17, Fig.18 and Fig.19 respectively.
Table 1 FEA result for MS Shaft
|
Sr.No. |
Moment (N-mm) |
Equivalent Stress (MPa) |
Shear Stress (MPa) |
Deformation (mm) |
|
1 |
11800 |
10.426 |
6.019 |
0.03095 |
|
2 |
23600 |
20.852 |
12.038 |
0.06187 |
|
3 |
35400 |
31.278 |
18.057 |
0.092806 |
|
4 |
47200 |
41.705 |
24.076 |
0.12374 |
|
5 |
59000 |
52.131 |
30.095 |
0.15468 |
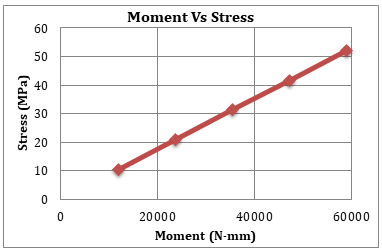
Fig. 17. Moment vs. Stress for MS Shaft
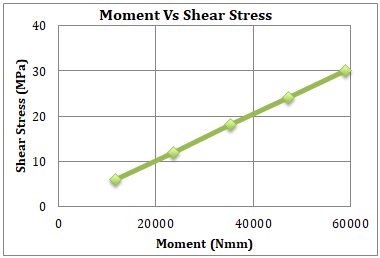
Fig. 18. Moment vs. Shear Stress for MS Shaft
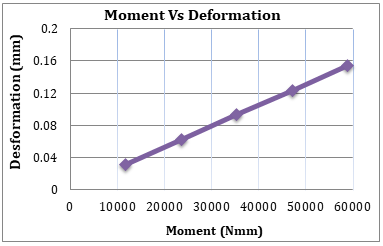
Fig. 19. Moment vs. Deformation for MS Shaft
Analysis results for the MS shaft using Finite Element Analysis (FEA) provide insights and information regarding the structural behaviour and performance of the shaft under various conditions. The FEA results offer a detailed examination of how the Mild Steel Shaft responds to different loads, stresses, and environmental factors, aiding in the assessment of its strength, stability, and overall mechanical integrity.
B. FEA and Numerical Result of MS Shaft
Table 2 gives result of FEA and hand calculation result for MS shaft.
Table 2 FEA and hand calculation result for MS Shaft
|
Sr. No. |
Moment (N-mm) |
FEA |
Hand Calculation |
||
|
Shear Stress (MPa) |
Deformation (mm) |
Shear Stress (MPa) |
Deformation (mm) |
||
|
1 |
11800 |
6.019 |
0.03095 |
5.948 |
0.02979 |
|
2 |
23600 |
12.038 |
0.06187 |
11.89 |
0.0547 |
|
3 |
35400 |
18.057 |
0.092806 |
17.84 |
0.08938 |
|
4 |
47200 |
24.076 |
0.12374 |
23.79 |
0.1199 |
|
5 |
59000 |
30.095 |
0.15468 |
29.72 |
0.1499 |
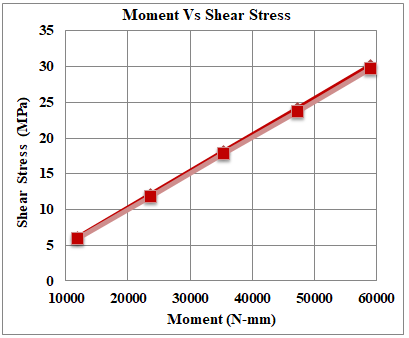
Fig.20. Graph Moment vs. Shear Stress for MS Shaft by FEA and Manual
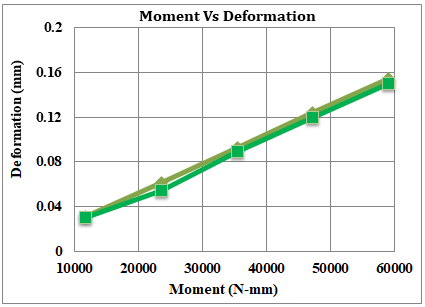
Fig.21. Graph Moment vs. Deformation for MS Shaft by FEA and Manual
The findings from both Finite Element Analysis (FEA) and manual calculations for the MS shaft give us information about how well the shaft holds up under different conditions shown in Fig.20 and Fig.21. It's like looking at the shaft's strength and stability through computer simulations (FEA) and traditional calculations done by hand. Together, these results help us understand how the steel shaft performs in real-world situations.
C. FEA Results for 2G.F. +3Al Shaft
Table 3 represents the FEA results for the 2GF+3AL shaft under different moments. The values give different results of equivalent stress, shear stress, and deformation. The same results are illustrated in Fig.22, Fig.23 and Fig.24 respectively.
Table 3 FEA result for 2GF+3AL Shaft
|
Sr.No. |
Moment (N-mm) |
Equivalent Stress (MPa) |
Shear Stress (MPa) |
Deformation (mm) |
|
1 |
11800 |
9.0804 |
5.2424 |
0.069041 |
|
2 |
23600 |
18.538 |
9.8267 |
0.15025 |
|
3 |
35400 |
27.806 |
14.74 |
0.22538 |
|
4 |
47200 |
37.075 |
19.653 |
0.3005 |
|
5 |
59000 |
46.344 |
24.567 |
0.37563 |
The results from Finite Element Analysis (FEA) for the 2GF+3AL Shaft give us insights into how the shaft behaves under different conditions. It's like a digital test that helps us understand how well the shaft can handle various forces and stresses. The FEA results provide valuable information about the performance and durability of the 2GF+3AL Shaft in practical situations.
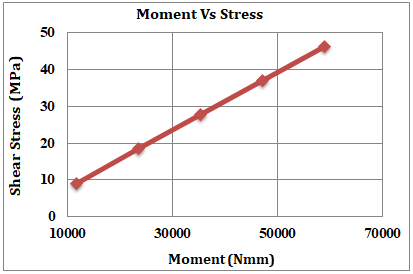
Fig.22. Graph Moment vs. Stress for 2GF+3AL Shaft
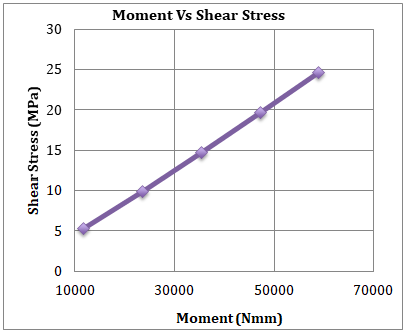
Fig.23. Graph Moment vs. Shear stress for 2GF+3AL Shaft
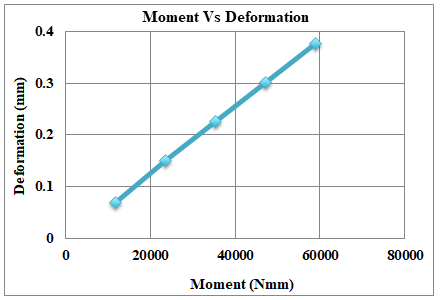
Fig.24. Graph Moment vs. Deformation for 2GF+3AL Shaft
D. FEA Results for 2AL + 3GF Shaft
Table 4 represents the FEA results for the 3GF+2AL shaft under different moments. The values give different results of equivalent stress, shear stress, and deformation. The same results are illustrated in Fig.25, Fig.26 and Fig.27 respectively.
Table 4 FEA result for 3GF+2AL Shaft
|
Sr.No. |
Moment (N-mm) |
Equivalent Stress (MPa) |
Shear Stress (MPa) |
Deformation (mm) |
|
1 |
11800 |
0.57 |
0.09 |
0.00015 |
|
2 |
23600 |
28.72 |
10.01 |
0.00839 |
|
3 |
35400 |
43.087 |
15.014 |
0.0125 |
|
4 |
47200 |
57.45 |
20.019 |
0.0167 |
|
5 |
59000 |
71.81 |
25.02 |
0.0209 |
The information obtained from Finite Element Analysis (FEA) for the 3GF+2AL Shaft gives us a closer look at how the shaft behaves in different situations. Think of it as a virtual test that helps us understand how the shaft responds to various forces and stresses.These FEA results provide valuable insights into how well the 3GF+2AL Shaft performs and holds up under real-world conditions.
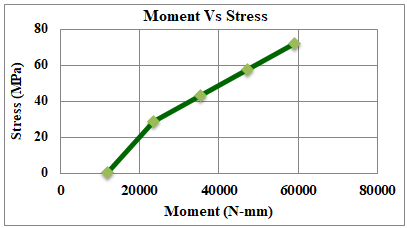
Fig.25. Graph Moment vs. Stress for 3GF+2AL Shaft
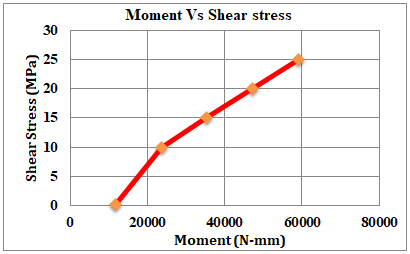
Fig.26. Graph Moment vs. Shear Stress for 3GF+2AL Shaft
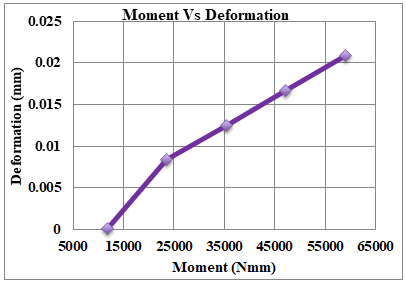
Fig. 27. Graph Moment vs. Deformation for 3GF+2AL Shaft
E. Weight
Table 5 and Fig.28 represents decrease in weight of shaft from 3.881 Kg to 2.394 Kg.It means weight optimization is achieved.
Table. 5. Weight of both Shafts
|
Sr. No. |
Material |
Weight (Kg) |
|
1 |
For the Original Shaft |
3.881 |
|
2 |
For the Proposed Shaft |
2.394 |
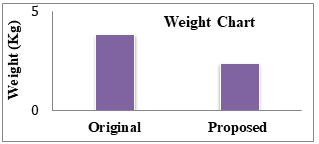
Fig. 28. Shaft Weight
F. Final Shaft
Table 6 represents equivalent stress and deformation for original and proposed shaft. Increase in stress, increase in deformation.
Table.6 Analysis results of both Shafts
|
Sr. No. |
Shaft |
Equivalent Stress (MPa) |
Deformation (mm) |
|
1 |
For the Original Shaft |
20.964 |
0.0568 |
|
2 |
For the Proposed Shaft |
38.042 |
0.1356 |
G. Final Shaft Modal
Table 7 shows Modal Analysis results of Original Shaft & Proposed shaft under different mode of vibrations
Table.7 Modal Analysis results of Original Shaft& Proposed shaft
|
Sr. No. |
Mode |
Original Shaft |
Proposed Shaft |
||
|
Frequency (Hz) |
Deformation (mm) |
Frequency (Hz) |
Deformation (mm) |
||
|
1 |
1 |
569.1 |
25.22 |
468.87 |
17.22 |
|
2 |
2 |
762.08 |
26.76 |
650.64 |
18.39 |
|
3 |
3 |
1593 |
24.406 |
1382.3 |
16.689 |
|
4 |
4 |
1947.6 |
25.608 |
1721.6 |
17.497 |
|
5 |
5 |
2500.7 |
26.082 |
2495.9 |
20.184 |
|
6 |
6 |
3034.7 |
24.69 |
2708.1 |
16.748 |
The outcomes of Modal Analysis for both the Original Shaft and the Proposed Shaft from Table 7 and Fig.29 give us a better understanding of how these shafts vibrate and move. It's like looking at how they respond to different types of shaking or vibrations. These results help us compare and see if the suggested changes in the Proposed Shaft make it better or different in terms of its movement characteristics compared to the Original Shaft.
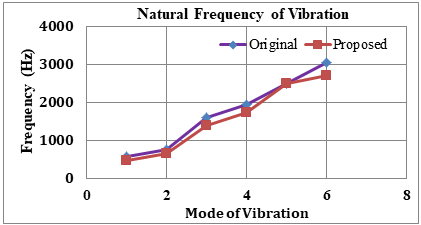
Fig.29. Graph Mode of vibration vs. Natural frequency
Conclusion
In the automotive sector, there is a strong need for products to be stronger and lighter. These requirements can be significantly met by composite materials. The current project entails the static analysis of composite and traditional steel shafts.Results shows that stress generated in metal matrix composite shaft are in allowable limit.A research comparing steel and composite shafts has been conducted. From the results it is concluded that, 1) Results from experiments are used to validate ANSYS results. 2) Decrease in weight of shaft from 3.881 Kg to 2.394 Kg is obtained. 3) After comparing sample results by using ANSYS and testing, we found that there will be getting similar results, hence we use same ANSYS method for finding out original drive shaft and new proposed drive shaft. 4) Metal matrix drive shaft having less weight original drive shaft for analyzed stress. So, we concluded that we can use metal matrix composite drive shaft for upcoming LMV.
References
[1] G. R. Chalageri, M. L. Shreeshail, G. U. Raju, and B. B. Kotturshettar, “Design optimization of light motor vehicle rear twist axle,” AIP Conf. Proc., vol. 2421, no. January, 2022, doi: 10.1063/5.0079095. [2] M. Samuel and R. B. Tayong, “3D numerical analysis of the structural behaviour of a carbon fibre reinforced polymer drive shaft,” Results Eng., vol. 18, p. 101120, 2023, doi: 10.1016/j.rineng.2023.101120. [3] P. Karthikeyan, R. Gobinath, L. Ajith Kumar, and D. Xavier Jenish, “Design and Analysis of Drive Shaft using Kevlar/Epoxy and Glass/Epoxy as a Composite Material,” IOP Conf. Ser. Mater. Sci. Eng., vol. 197, no. 1, 2017, doi: 10.1088/1757-899X/197/1/012048. [4] S. K. S. Nadeem, G. Giridhara, and H. K. Rangavittal, “A Review on the design and analysis of composite drive shaft,” Mater. Today Proc., vol. 5, no. 1, pp. 2738–2741, 2018, doi: 10.1016/j.matpr.2018.01.058. [5] D. G. Lee, H. S. Kim, J. W. Kim, and J. K. Kim, “Design and manufacture of an automotive hybrid aluminum/composite drive shaft,” Compos. Struct., vol. 63, no. 1, pp. 87–99, 2004, doi: 10.1016/S0263-8223(03)00136-3. [6] S. Mohan and M. Vinoth, “Design and Analysis of Composite Drive Shaft for Automotive Application,” Middle-East J. Sci. Res. Innov. Eng. Technol. Manag. Appl., vol. 24, pp. 110–116, 2016, doi: 10.5829/idosi.mejsr.2016.24.RIETMA118. [7] Z. Hongxue, W. Sanxia, L. Xiao, P. Zhifei, and Z. Guosheng, “Optimization for Side Structure of Vehicle Based on FEA,” Procedia Comput. Sci., vol. 208, pp. 196–205, 2022, doi: 10.1016/j.procs.2022.10.029. [8] H. Pang and G. Ngaile, “Development of a Non-isothermal Forging Process for Hollow Power Transmission Shafts,” Procedia Manuf., vol. 26, pp. 1509–1516, 2018, doi: 10.1016/j.promfg.2018.07.087. [9] S. O. Afolabi, B. I. Oladapo, C. O. Ijagbemi, A. O. M. Adeoye, and J. F. Kayode, “Design and finite element analysis of a fatigue life prediction for safe and economical machine shaft,” J. Mater. Res. Technol., vol. 8, no. 1, pp. 105–111, 2019, doi: 10.1016/j.jmrt.2017.10.007.
Copyright
Copyright © 2024 Shailaja V. Navghar, Sanjay A. Pawar, Rahul S. Autade, Dr. Duradundi Sawant Badkar . This is an open access article distributed under the Creative Commons Attribution License, which permits unrestricted use, distribution, and reproduction in any medium, provided the original work is properly cited.

Download Paper
Paper Id : IJRASET64828
Publish Date : 2024-10-26
ISSN : 2321-9653
Publisher Name : IJRASET
DOI Link : Click Here
 Submit Paper Online

