Ijraset Journal For Research in Applied Science and Engineering Technology
- Home / Ijraset
- On This Page
- Abstract
- Introduction
- Conclusion
- References
- Copyright
Design of ION Thruster
Authors: Akshit Shinde, Srushti Shah, Aditya Shinde, Jignesh Shinde, Harsh Sonavane
DOI Link: https://doi.org/10.22214/ijraset.2024.64422
Certificate: View Certificate
Abstract
Ion thrusters represent a significant advancement in electric propulsion, enhancing fuel efficiency by accelerating ions for thrust generation. These systems, demonstrated in missions such as Deep Space 1 and Dawn, facilitate substantial velocity changes with minimal propellant, making them suitable for long-duration space missions. This paper outlines the design of an ion thruster aimed at achieving a thrust of 0.2 Newton, focusing on the use of xenon as the propellant and employing high-voltage grids for ion acceleration. Key design aspects include an efficient power supply delivering at least 26 W, effective thermal management, and the integration of control systems. Performance metrics target a specific impulse of 3,000 seconds and a thrust-to-power efficiency ratio greater than 0.5. Through detailed calculations, including arc distance, flow configuration and velocity analyses and testing using different materials, this study identifies optimal configurations for thrust generation. The developed ion thruster is tailored for small satellites (700-800 kg) to enhance trajectory control and station-keeping, underscoring the importance of ion propulsion in modern space exploration.
Introduction
I. INTRODUCTION
Ion thrusters, a cornerstone of electric propulsion technology, represent a significant leap forward in the realm of spacecraft propulsion. Unlike traditional chemical rockets that rely on rapid combustion of propellant, ion thrusters generate thrust by ionizing a propellant gas and accelerating the resulting ions through an electric field. This method allows for highly efficient use of fuel, which is particularly advantageous for long-duration space missions where carrying large quantities of propellant is impractical.
The efficiency and effectiveness of ion thrusters have been demonstrated in several high-profile space missions. For example, NASA's Deep Space 1 spacecraft utilized an ion thruster to achieve a velocity change of 4.3 km/s while consuming less than 74 kg of xenon. Similarly, the Dawn spacecraft set a record with a velocity change of 11.5 km/s, showcasing the potential of ion propulsion for extended interplanetary travel. Ion thrusters are uniquely suited for missions that require gradual but continuous acceleration over long periods. This characteristic makes them ideal for deep-space exploration, precise satellite positioning, and orbital adjustments. In the vacuum of space, where sustained, gentle thrust can eventually achieve high velocities, ion thrusters offer a compelling alternative to conventional propulsion systems.
Despite their advantages, ion thrusters face limitations, such as low thrust output and significant electrical power requirements. These constraints make them unsuitable for launch from planetary surfaces with substantial gravity. While solar panels can power ion thrusters within the inner solar system, missions venturing further out require nuclear power sources, which come with their own set of challenges, including the risk of radioactive contamination in the event of a launch failure.
The concept of ion propulsion dates to the early visions of pioneers like Konstantin Tsiolkovsky and Hermann Oberth in the early 20th century. Practical implementation began in the 1960s through NASA's efforts, with significant contributions from both American and Soviet researchers. Today, ion thrusters are an integral part of modern space exploration, playing a crucial role in both robotic and crewed missions.
This paper explores the design, operational principles, and performance evaluation of ion thrusters. By delving into the intricacies of ionization methods, thrust generation, and efficiency optimization, we aim to highlight the advancements and future potential of this groundbreaking propulsion technology.
II. METHODOLOGY
A. Design Goal
To achieve a thrust of 0.2 Newton, the ion thruster design must consider several critical factors, including the choice of propellant, ionization efficiency, and the acceleration mechanism. The thrust (TTT) generated by an ion thruster is given by the equation:
T=m?veT = \dot{m} v_eT=m?ve?
where m?\dot{m}m? is the mass flow rate of the ions, and vev_eve? is the exhaust velocity. Achieving 0.2 Newton of thrust requires careful balancing of these parameters. Key considerations include:
- Propellant Choice: Xenon is typically used due to its high atomic mass and ease of ionization. Other potential propellants like krypton or argon may be considered for specific mission requirements.
- Ionization Efficiency: The ionization process needs to convert neutral atoms into ions with high efficiency. Electron bombardment ionization or radiofrequency (RF) ionization are commonly used methods.
- Acceleration Mechanism: High-voltage grids or electromagnetic fields are used to accelerate the ions. The design must ensure that the ions achieve the required exhaust velocity (vev_eve?) to generate the desired thrust.
- Mass Flow Rate (m?\dot{m}m?): The system must maintain a consistent mass flow rate of the ionized propellant to sustain the thrust. This involves precise control of the propellant feed system and the ionization process.
B. Design of Efficient Power Transmission
Efficient power transmission is critical to ensure that the ion thruster operates within its power budget while maximizing thrust output. This involves the following aspects:
- Power Supply: The power supply must be capable of delivering the required electrical power to the ionization and acceleration systems. This includes both the main thruster power and auxiliary systems such as the neutralizer.
- High-Efficiency Power Conversion: Converting the spacecraft's power source (typically solar panels or nuclear power) into the high-voltage levels needed for ion acceleration must be done with minimal losses. Advanced power electronics and high-efficiency converters are essential.
- Thermal Management: Power transmission systems generate heat, which must be effectively managed to prevent damage to the thruster components. Heat sinks, radiators, and thermal insulation are critical design elements.
- Minimizing Resistive Losses: Electrical connections and wiring must be designed to minimize resistive losses. This includes using materials with high electrical conductivity and optimizing the layout to reduce the length of high-current paths.
- Control Systems: Precise control of the power delivered to the ionization and acceleration stages is necessary for stable operation. This involves feedback systems that monitor thrust, ionization efficiency, and power consumption.
- Redundancy and Reliability: The power transmission system should include redundant pathways and components to ensure reliable operation over long missions. This involves designing for fault tolerance and including backup systems that can take over in case of primary system failure.
- Integration with Propulsion System: The power transmission system must be seamlessly integrated with the overall propulsion system, ensuring that power delivery matches the dynamic requirements of the thruster during various mission phases.
C. Performance Metrics
To evaluate the success of the design in achieving the stated goals, the following performance metrics will be monitored:
- Thrust Output: Measurement of the actual thrust produced to ensure it meets or exceeds the target of 0.2 Newton.
- Specific Impulse (IspI_{sp}Isp?): Calculation of the specific impulse to assess fuel efficiency.
- Power Efficiency: Ratio of thrust power to electrical power input, aiming for high efficiency.
- Thermal Performance: Effectiveness of thermal management in maintaining safe operating temperatures.
- System Reliability: Long-term performance and reliability of the power transmission system over the mission duration.
By focusing on these design goals and performance metrics, the ion thruster can achieve the desired thrust of 0.2 Newton with efficient power transmission, thereby enhancing its viability for long-duration space missions.
1) Calculations
- Required Power
- To determine the required power for an ion thruster for a specific satellite, we first select a use case satellite and find out the necessary thrust.
- For this, the Dawn satellite is an ideal example. The Dawn mission, which orbits the asteroids 4 Vesta and 1 Ceres to study their properties, uses a box-shaped spacecraft made of aluminium and graphite composite. It has a dry mass of 747.1 kg.
- The spacecraft is equipped with two solar panel wings and three ion thrusters that provide a maximum thrust of 92 millinewtons (mN) each.
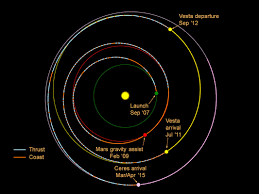
Fig. 1 Dawn Satellite Mission overview
Once the thrust is known, For the TEG fluid used in the present work, the spray. Current flow rate scaling was found to follow a power law relationship where I (nano Ampere) = 70.04Q0.427, when Q is in nano L/s. From this spray current data, the average charge to mass ratio (q/m) can be calculated from
Equation 1

The expected thrust T produced from electro sprayed droplets is also dependent on the net acceleration voltage V, and can be calculated from
Equation 2

|
Variable |
Symbol |
Value |
Unit |
|
Voltage |
V |
1041666.67 |
V |
|
Current |
I |
0.0000251 |
A |
|
Power |
P |
26.15 |
W |
Table 1 Voltage and Current calculated using above equations (1) and (2)
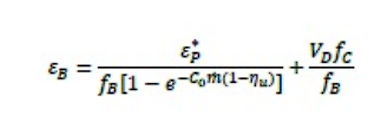
3rd equation allows us to calculate performance curves for a given thruster design
Equation 3
|
Symbol |
Description |
|
fc |
This represents the portion of the total ion current that strikes the cathode surfaces. |
|
fb |
This indicates the fraction of ions produced that are successfully extracted from the source. |
|
Co |
This value reflects the efficiency of converting primary electrons (emitted by the cathode) into ions. |
|
eps |
This represents the base energy cost (per ion) associated with creating plasma ions. |
|
TM |
This signifies the temperature of the electrons in the bulk plasma, assuming a Maxwellian distribution. |
|
eb |
This value, though not provided in the original data, is often relevant in ion thruster calculations. It represents the voltage applied to accelerate the extracted ions. |
Table 2 Description of variables considered in equation (3)
|
Variable |
Symbol |
Value |
Unit |
|
Fraction of ion current to cathode surfaces |
fc |
0.24 |
|
|
Extracted ion fraction |
fb |
0.1 |
|
|
Primary electron utilisation factor |
Co |
145 |
|
|
Baselines plasma ion energy cost |
eps |
3 x 10^4 |
eV (electron volts) |
|
Maxwellian electron temperature in bulk plasma |
TM |
10 |
eV |
Table 3 Values for variables taken in equation (3)
b) Arc Distancing Calculation
Early vacuum experimenters found that the breakdown voltage did not always follow a straight line. Instead, they found that there was a minimum voltage required to create an arc between the electrodes. This minimum voltage is called the Paschen voltage.
The Paschen curve is an important concept in electrical engineering, as it can be used to design safe and efficient electrical devices. For example, the Paschen curve can be used to design transformers, which are devices that transfer electrical energy from one circuit to another. Transformers work by creating a high voltage across a gap between two electrodes. The Paschen curve can be used to ensure that the voltage is high enough to create an arc across the gap, but not so high that it causes the transformer to break down.
Equation 4

Here's what each part represents:
- V: Breakdown voltage between the electrodes
- p: Pressure of the gas
- d: Distance between the electrodes
- A and B: Constants specific to the gas (determined experimentally)
- n: Another constant (often between 0.5 and 0.75)
The equation essentially describes the relationship between voltage, pressure, and distance for a spark to occur. As the product of pressure (p) and distance (d) increases (pd), the voltage (V) initially rises due to the increasing distance needing to be bridged. However, there's a minimum breakdown voltage (represented by B) at a specific pd value. This "sweet spot" allows for the easiest spark initiation. Beyond that pd, the term A/(pd^n) dominates, causing the voltage required to bridge the gap to again increase. The constants A, B, and n account for the specific properties of the gas, such as electron behaviour and ionization potential.
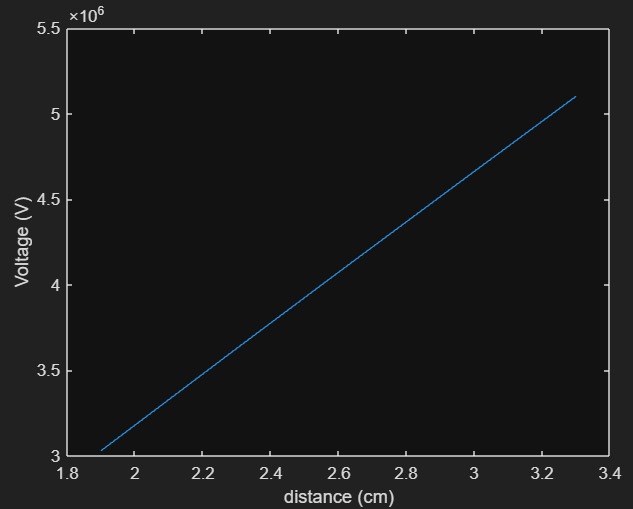
Fig. 2 Voltage vs distance graph using Paschen curve method.
D. Design For Converging Nozzle for Outlet Velocity
After finalizing the distance between the cathode and anode, which was calculated to be 19 mm, we began designing a converging structure to reduce the area and thus increase the outlet velocity. Converging structures with iterative spline shapes were designed as follows:
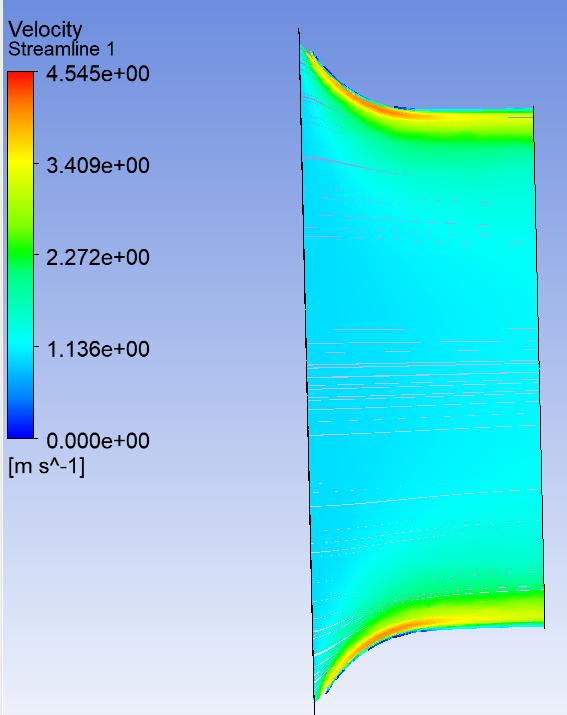
Fig. 3 Streamlines for Radius of Curvature 25 mm
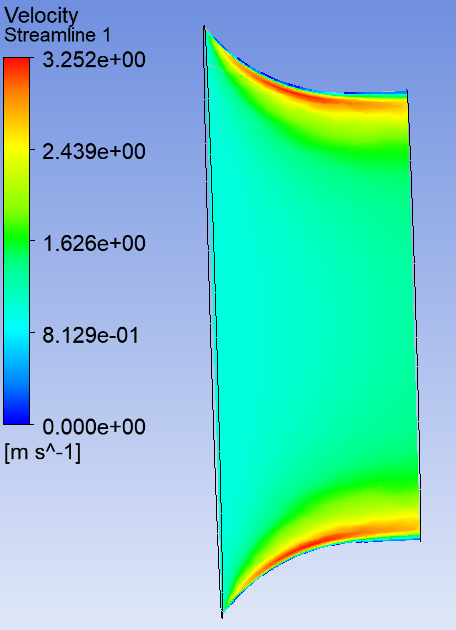
Fig. 4 Streamlines for Radius of Curvature 35 mm
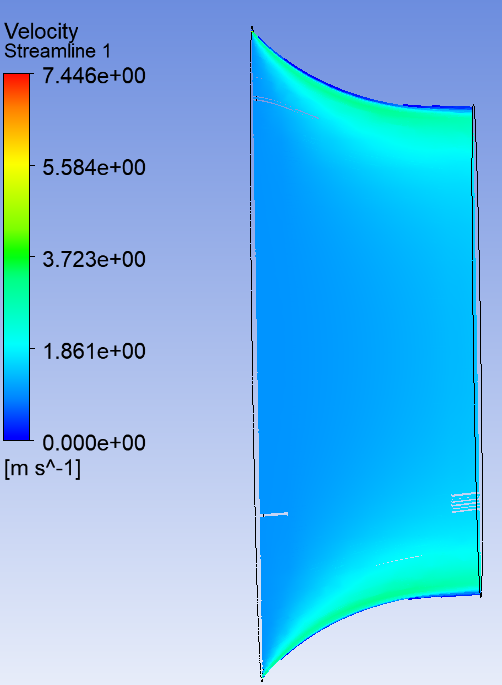
Fig. 5 Streamlines for Radius of Curvature 45 mm
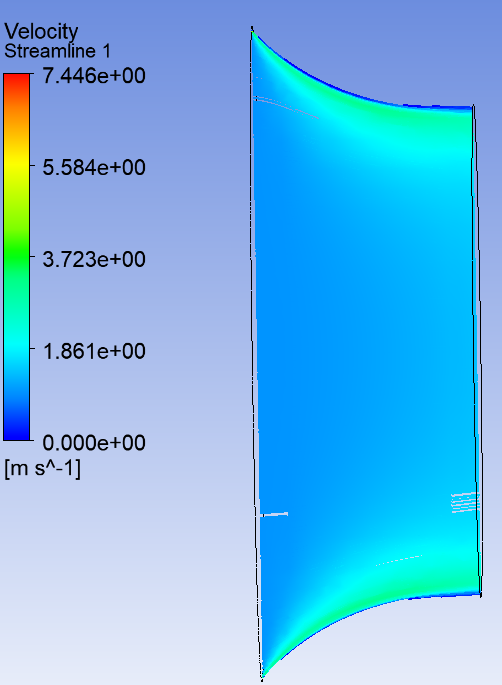
Fig. 6 Streamlines for Radius of Curvature 65 mm
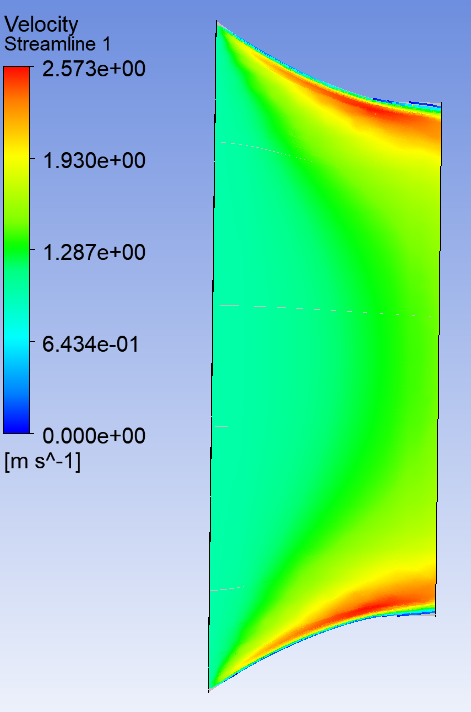
Fig. 7 Streamlines for Radius of Curvature 85 mm
|
Radius of Curvature(mm) |
Inlet Velocity (m/s) |
Exit Velocity (m/s) |
|
25 |
1 |
1.736 |
|
35 |
1 |
1.726 |
|
45 |
1 |
1.768 |
|
65 |
1 |
1.728 |
|
85 |
1 |
1.73 |
Table 4 Data for Spline design for Converging structure with CFD
Based on the iterations, a radius of curvature of 45 mm produced the maximum exit velocity and was therefore selected as the final value.
E. Deciding Number of Anode pipes
|
Number of Anode pipes |
Pressure Difference (Pa) |
|
4 |
1.4183115 |
|
5 |
1.6445086 |
|
6 |
1.806502 |
|
7 |
2.3542202 |
|
8 |
2.6357346 |
|
9 |
4.0112956 |
Table 5 Pressure Difference vs Number of Anode pipes
Pressure drop was analysed using computational fluid dynamics (CFD). As previously discussed, a convergent structure with a 45 mm radius of curvature was chosen. To determine the number of anode pipes, we need to assess the pressure drop.
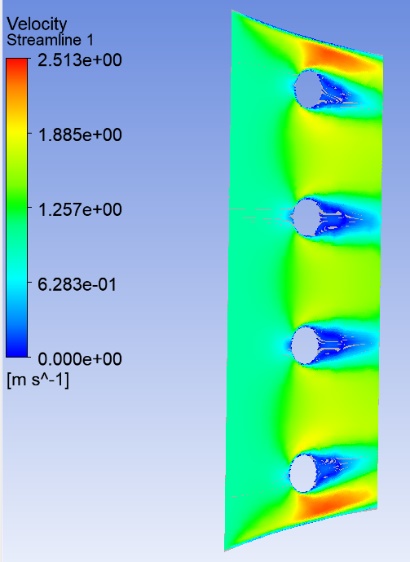
Fig. 8 Velocity Streamlines for 4 Anode Sticks
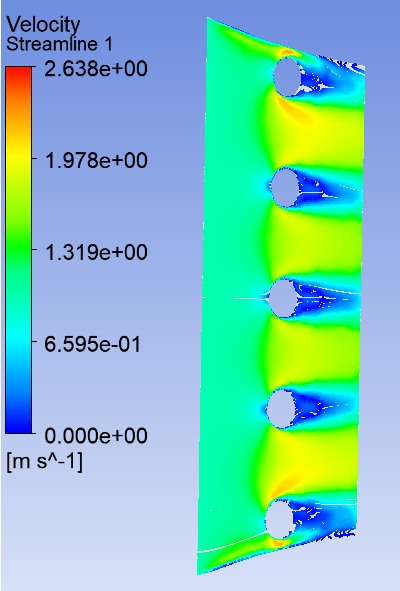
Fig. 9 Velocity Streamlines for 5 Anode Sticks
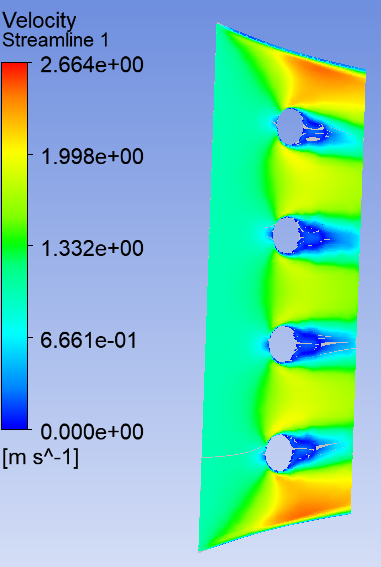
Fig. 10 Velocity Streamlines for 6 Anode Sticks
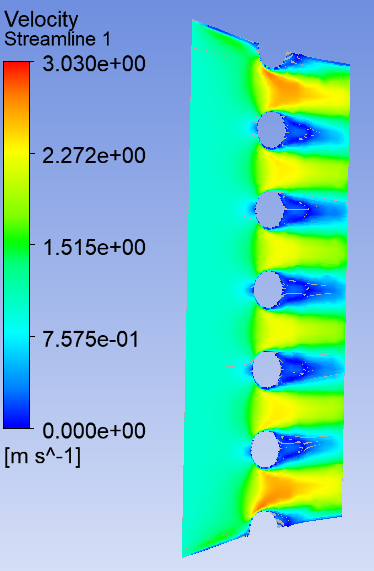
Fig. 11 Velocity Streamlines for 7 Anode Sticks
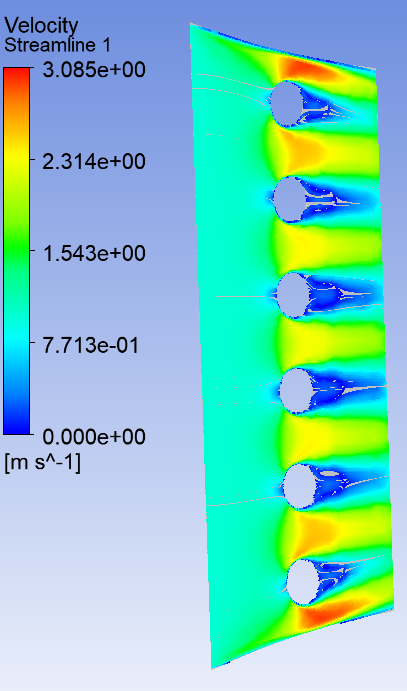
Fig. 12 Velocity Streamlines for 8 Anode Sticks
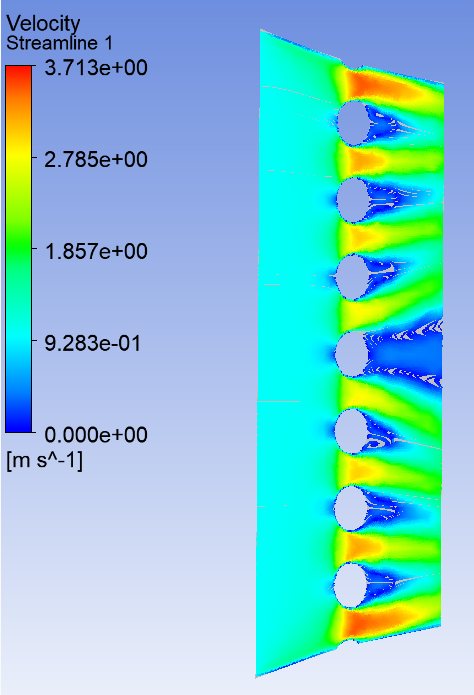
Fig. 13 Velocity Streamlines for 9 Anode Sticks
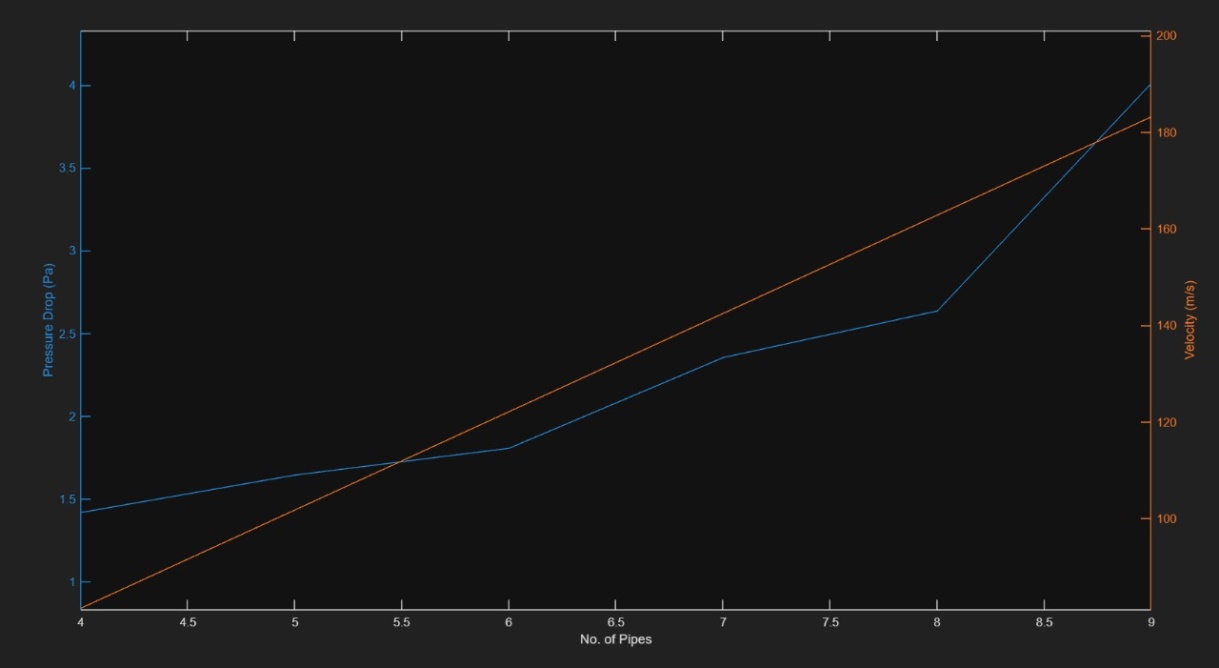 Fig. 14 Pressure drop vs Velocity for number of pipes
The analysis reveals that while increasing the number of pipes in an ionic thruster system can enhance ionization efficiency, it also leads to higher pressure drops. By plotting a combined graph of these two factors, the optimal number of pipes was found to be six. This configuration strikes a balance between maintaining a manageable pressure drop and achieving high ionization efficiency, resulting in the most effective performance for the ionic thruster system. This finding is critical for the design and operation of efficient and effective ion propulsion systems in space applications.
F. Number of Cathode Wires
- A constant potential difference of 1000 kV was maintained, with a fixed number of 6 anode rods. The number of winding wires was varied to compare the resulting velocities in each case, as shown.
- A constant potential difference of 400 kV was maintained, with a fixed number of 6 anode rods. The number of winding wires was varied to compare the resulting velocities in each case, as shown.
|
No. of Anode sticks |
No. of winding wires as cathode |
Average velocity |
Max velocity |
|
6 |
6 |
1.2 |
1.62 |
|
6 |
12 |
1.41 |
1.88 |
|
6 |
24 |
2.24 |
2.8 |
Table 6 Constant number of anode pipes, Number of winding wires and velocities for 1000 kV
|
No. of Anode sticks |
No. of winding wires as cathode |
Average velocity |
Max velocity |
|
6 |
6 |
1.06 |
1.68 |
|
6 |
12 |
1.34 |
1.78 |
|
6 |
24 |
2.98 |
3.86 |
Table 7 Constant number of anode pipes, Number of winding wires and velocities for 400 kV
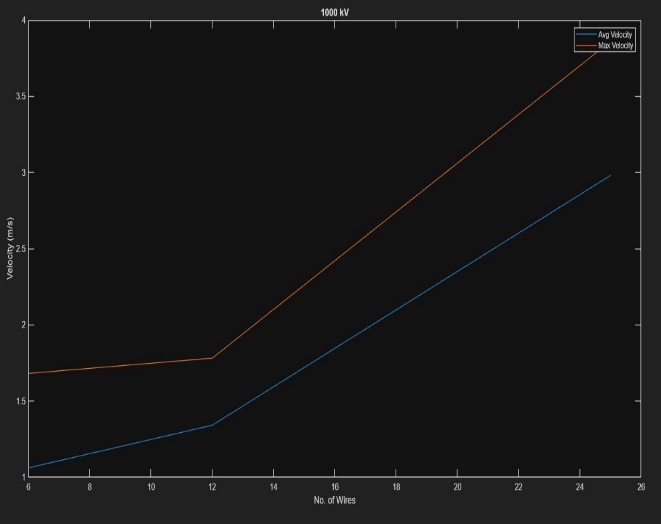
Fig. 15 Number of Cathode wires vs Velocity for 1000 kV Graph
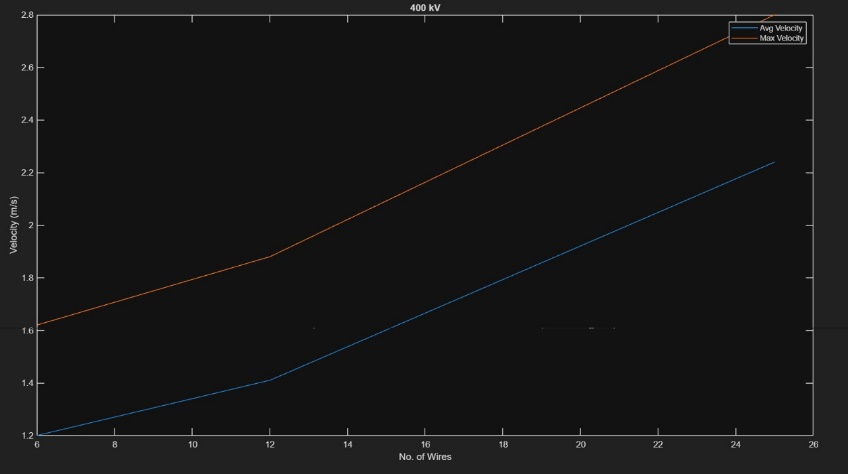
Fig. 16 Number of Cathode wires vs Velocity for 400 kV Graph
The analysis concludes that increasing the voltage levels in power transmission systems from 400 kV to 1000 kV results in several significant benefits. Higher voltage levels lead to reduced transmission losses, enhanced transmission capacity, lower voltage drops, and improved system stability. Despite the need for specialized infrastructure and the associated initial costs, the long-term advantages in efficiency and reliability make higher voltage transmission a worthwhile investment. This conclusion underscores the importance of high-voltage systems in modern power transmission networks, where efficiency and reliability are paramount.
3. Orientations for Cross and parallel for Wire Winding and Anode pipes:
|
Orientation |
Average velocity |
Max velocity |
|
Cross |
2.18 |
2.54 |
|
Parallel |
2.2 |
2.81 |
Table 8 Velocity analysis with cross and parallel iterations
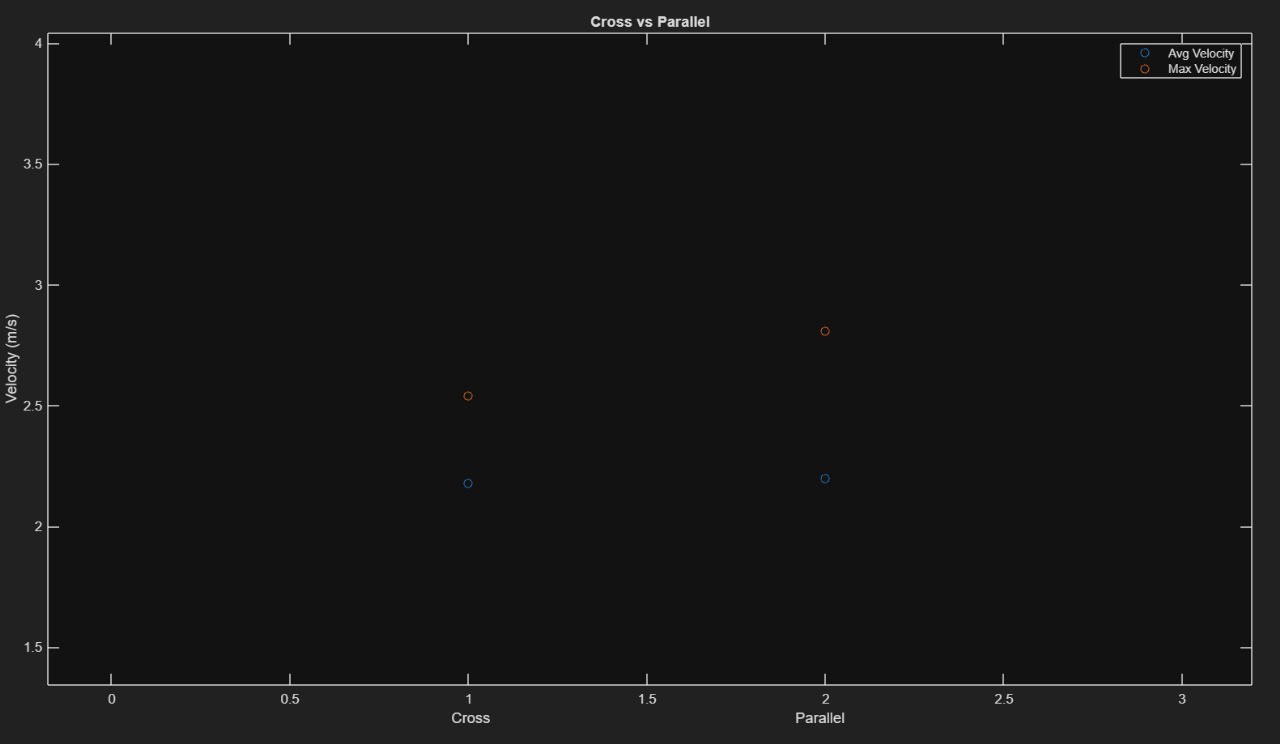 Fig. 17 Cross vs Parallel orientation Velocity analysis.
When comparing cross flow and parallel flow configurations in ionic thruster systems, parallel flow demonstrates several advantages over cross flow. The primary benefit of parallel flow is the promotion of laminar flow, which reduces turbulence, enhances ion distribution, and improves control over ion trajectories. This leads to increased efficiency and better overall performance of the thruster. While cross flow may introduce greater turbulence and pressure drops, parallel flow ensures a more stable and effective operation, making it the preferable configuration for optimizing the performance of ionic thrusters.
4. The following distancing iterations were performed to analyse the changes in velocities for both copper and aluminium:
|
Material: Aluminium |
||
|
Distance(mm) |
Average velocity |
Max velocity |
|
19 |
1.72 |
2.25 |
|
23 |
0.74 |
1.25 |
|
26 |
0.57 |
0.94 |
|
30 |
0.37 |
0.62 |
|
33 |
0.03 |
0.09 |
|
19 |
1.72 |
2.25 |
Table 9 Distancing for Aluminium material Anode and Velocity Analysis
|
Material: Copper |
||
|
Distance(mm) |
Average velocity |
Max velocity |
|
19 |
2.2 |
2.81 |
|
23 |
1.47 |
2.31 |
|
26 |
1.36 |
1.75 |
|
30 |
0.97 |
1.35 |
|
33 |
0.26 |
0.76 |
|
19 |
2.2 |
2.81 |
Table 10 Distancing for Copper material Anode and Velocity Analysis
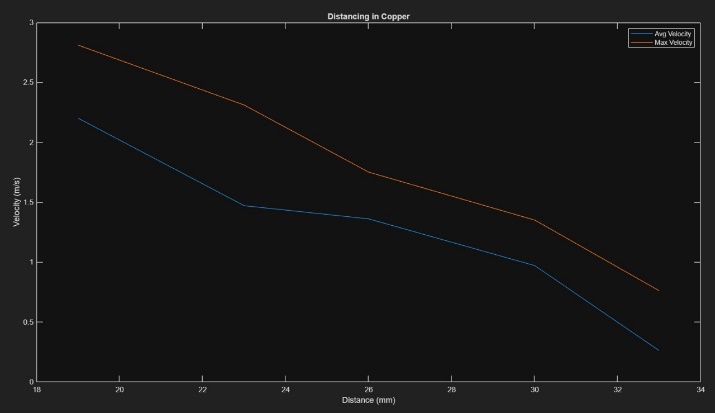
Fig. 18 Distancing for Copper material Anode and Velocity Analysis
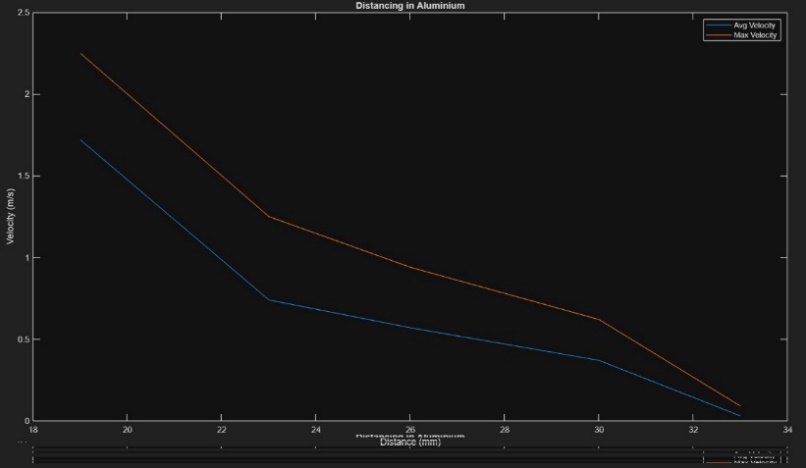
Fig. 19 Distancing for Aluminium material Anode and Velocity Analysis
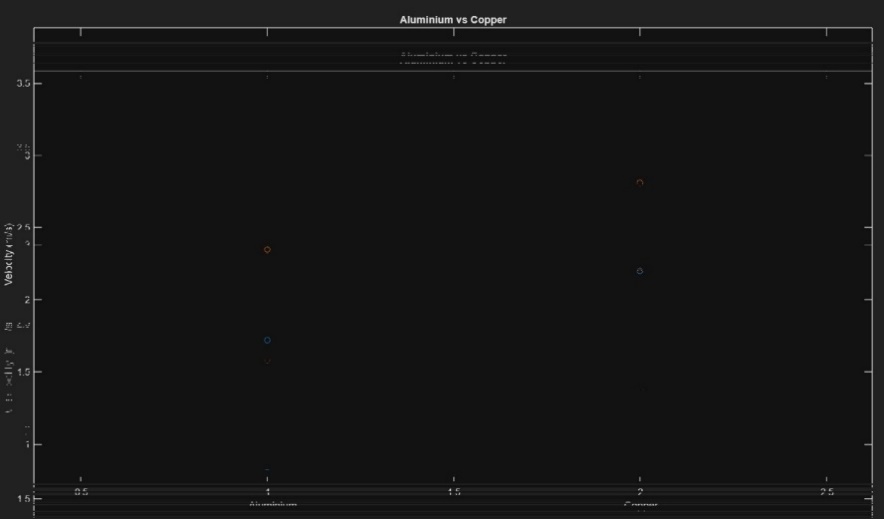
Fig. 20 Velocity Comparison for two different Anode pipe materials, Aluminium and Copper
III. RESULTS AND DISCUSSION
In our ionic thruster project, we explored various parameters and configurations to optimize the outlet velocity and overall performance. Through experimental data analysis, we observed significant variations based on different factors.
A. Experimental Data Analysis
- By maintaining a constant potential difference of 1000 kV with 6 anode rods, varying the number of winding wires as cathode showed a direct impact on velocity. As the number of winding wires increased from 6 to 24, both average and maximum velocities notably escalated.
- Similarly, at a constant potential difference of 400 kV with 6 anode rods, altering the number of winding wires influenced the velocities. The increase in the number of winding wires led to higher average and maximum velocities.
- Exploring orientations for wire winding and anode pipes (cross and parallel), we observed that the cross orientation resulted in slightly higher velocities compared to the parallel orientation.
- Analysis of distancing iterations for copper and aluminium materials at different distances showcased varying effects on average and maximum velocities. Copper consistently outperformed aluminium in terms of velocity at each distance iteration.
???????B. Computational Fluid Dynamics (CFD) for Pressure Drop
As the number of anode ticks increases from 4 to 9, the pressure drop also increases. Initially, at 4 anode ticks, the pressure drop is 1.4183 units, gradually rising to 1.6445 and 1.8065 units for 5 and 6 ticks, respectively. A more significant increase is observed as the ticks reach 7, with a pressure drop of 2.3542 units. This trend continues with 8 anode ticks at 2.6357 units and peaks at 9 anode ticks, where the pressure drop reaches 4.0113 units.
Conclusion
We have developed an ionic thruster specifically designed for orbit trajectory control, station-keeping, and attitude control of small satellites weighing between 700 and 800 kg. Through extensive calculations and multiple iterations, we have optimized the positioning of the cathode and anode, as well as the power supply, to achieve the desired velocity and thrust. Our ionic thruster exhibits low acceleration but can maintain thrust for extended durations. This characteristic makes it ideal for small satellites, enabling them to travel for long periods while maintaining precise orbital directions. The sustained thrust provided by the thruster ensures reliable and efficient control over the satellite’s movement and orientation in space. Overall, our findings underscore the importance of factors such as potential difference, number of winding wires, material choice, and configuration orientation in optimizing the performance of ionic thrusters. These insights are pivotal for enhancing the efficiency and output of future ionic thruster designs.
References
[1] Rahaman, S. E., Barik, R. K., Singh, A. K., Shukla, S. K., Min, S. H., & Park, G. S. (2017). “Design of high efficiency and high thrust grid system for ion thruster. Journal of Electromagnetic Waves and Applications” , 31(17), 1816–1825. [2] Machida, K., Toda, Y., Murakami, H., & Kudo, I. (1982) , “DESIGN OF ION THRUSTER SYSTEM FOR SATELLITE POSITION CONTROL.” IFAC Proceedings Volumes, 14(2),2283–2289. [3] G.R. Scmidt, M.J. Patterson, S.W. Benson — The NASA Evolutionary Xenon Thruster (NEXT): The next step for U.S. deep space propulsion, IAC-08-C4.4.2, NASA Glenn Research Centre. [4] Brophy, J. R., Kakuda, R. Y., Polk, J. E., Anderson, J. R., Marcucci, M. G., Brinza, D., Henry, M. D., Fujii, K. K.,Mantha, K. R., & Stocky, J. F. (2000). “Ion propulsion system (NSTAR) DS1 technology validation report” JPL Publication 00-10, October, August 2014, 52. [5] E.Y. Choueiri — “New Dawn for Electric Rockets”, Scientific American, Feb 2009, 58 – 65 [6] F.M. Curran, J.S. Sovey, R.M. Myers — Electric propulsion: An evolutionary technology, IAF-91-241, 42nd Congress of the International Astronautical Federation, Montreal, CA, Oct. 5-11, 1991. [7] P. Fortescue, G. Swinerd, J. Stark — Spacecraft System Engineering, Fourth Edition, A John Wiley & Sons, Ltd., 2011. R.G. Jahn , “Physics of electric propulsion” 1st ed., New York, McGraw-Hill, 1968. [8] W. Ley, K. Wittmann, W. Hallmann — Handbook of Space Technology, First Edition, A John Wiley & Sons, Ltd., 2008. National Aeronautics and Space Administration — Anatomy of an Ion Engine. [9] National Aeronautics and Space Administration — NASA’s Evolutionary Xenon Thruster - The NEXT Ion Propulsion System for Solar System Exploration, Briefing prepared for New Frontiers AO, 200.
Copyright
Copyright © 2024 Akshit Shinde, Srushti Shah, Aditya Shinde, Jignesh Shinde, Harsh Sonavane. This is an open access article distributed under the Creative Commons Attribution License, which permits unrestricted use, distribution, and reproduction in any medium, provided the original work is properly cited.

Download Paper
Paper Id : IJRASET64422
Publish Date : 2024-09-30
ISSN : 2321-9653
Publisher Name : IJRASET
DOI Link : Click Here
 Submit Paper Online

