Ijraset Journal For Research in Applied Science and Engineering Technology
- Home / Ijraset
- On This Page
- Abstract
- Introduction
- Conclusion
- References
- Copyright
Determination of Average Water Demand and Diurnal Consumption Pattern for a Multifamily Apartment Complex in Peshawar
Authors: Bilal Khan, Salman Saeed
DOI Link: https://doi.org/10.22214/ijraset.2024.64799
Certificate: View Certificate
Abstract
Accurately estimating and understanding domestic water demand and consumption patterns is essential for the efficient planning and management of drinking water supply systems. Traditional methods for estimating water demand are labor-intensive and often rely on assumptions. To overcome these limitations, this study employed a novel approach using high-precision data loggers to monitor water levels continuously in rooftop tanks at 5-minute intervals within a residential apartment complex in Peshawar, Pakistan. The findings indicate that per capita water consumption varies between 97 and 209 liters per capita per day (lpcd), with an average consumption of 173 lpcd. This methodology offers enhanced accuracy in quantifying water usage, providing a robust alternative to conventional estimation techniques.
Introduction
I. INTRODUCTION
Water has been recognized as one of the most significant natural resources and crucial for health. (Lyu et al., 2019). It is estimated that about 99% of the Earth's liquid freshwater is located within subterranean aquifers, upon which approximately a quarter of the global population relies for extracting water (Gabriel & Khan, 2006). Accurately determining a community’s water requirements is a fundamental component in the planning and development of water supply systems. It is essential for guiding key activities, including the design and implementation of new water supply projects, as well as ensuring effective water resource management. Water consumption patterns in developed countries have been widely studied. However, there is a lack of research focusing on consumption patterns within apartment complexes in Pakistan. Hence, this research study was carried out to identify the per capita water demand for a high-rise residential apartment complex in an urban area of Peshawar, Pakistan.
The primary objective of this research was to assess the per capita water consumption (lpcd) in a residential apartment complex situated in an urban area of Peshawar. This was achieved through continuous monitoring using an ultrasonic water level sensor paired with a data logger. These IoT-based data loggers were used to measure water levels in Overhead water tanks and by observing the difference in level of water, the daily water consumption was estimated. The findings of this research are expected to provide a foundation for future studies, enabling further exploration of water resources management and the optimization of water distribution systems.
II. LITERATURE REVIEW
Understanding water demand and usage is crucial for effective water management, particularly in addressing global water scarcity. Various methods, such as surveys, water metering, and interviews, have been employed worldwide to explore these issues. Among these approaches, Internet of Things (IoT)-based devices have gained significance for their ability to provide real-time, accurate data, enhancing our understanding of water consumption and demand.
In 2013, a research study was conducted in Dhaka City, Bangladesh, to estimate household water consumption by distributing questionnaires to households residing in five distinct geographical locations. A specialized bucket was utilized to gather data over the whole week and the resultant average values were subjected to subsequent analysis. The study aimed to understand water consumption practices for multiple household practices such as floor and dish cleaning, laundry as well as toilet flushing. The study revealed that the average household's utilization of greywater could conserve approximately 18-29% of freshwater resources. Furthermore, the study estimated that the families belonging to the medium socioeconomic class in Dhaka City had a per person water usage of 200-300 liters per capita per day (lpcd), with an average of around 252 lpcd. The highest water consumption was observed in bathing and laundry activities, followed by kitchen use and toilet flushing. The study also found that approximately 17-18% of drinking water was being utilized for the purpose of flushing toilets (Abedin & Rakib, 2013).
A study was conducted in Jaipur, India with the objective to investigate the correlation between water utilization, behavior and demeanors towards use of water, and the use of devices in urban households of India. The researchers collected data through questionnaires distributed among 100 households of different sorts. The questionnaire consisted of more than 60 questions, aiming to gather information on household characteristics as well as outdoor and indoor activities. The survey involved the participation of more than 90 households including single-family residences and multi-unit high-rise apartments in a university campus situated in Jaipur city. The collected survey data was subjected to analysis using cluster analysis and one-way analysis of variance (ANOVA). The study found significant variations in per capita water consumption based on household type and size. In terms of water usage, single-family households had an average consumption of 183 liters per person per day, while apartments had a higher average consumption of 215 liters per person per day. The collection of data via questionnaire and door-to door survey poses challenges to the validity of the findings in the context of our social conditions. Moreover, the inaccurate perception of people about their consumption patterns undermines the authenticity of this technique (Sadr et al., 2016)
Another research study conducted to determine the per capita water consumption for indoor practices on weekly basis across three households located in Davis, California. Data. Further, this study conducted separate calculations for each household using a “Low Flow Scenario” to identify the most economically viable methods to enhance water conservation and optimize water usage in households. Water usage data was collected manually by placing sheets near household accessories like the laundry machine, kitchen, and washrooms. Each member of the household was responsible for recording their water usage on these sheets every time they utilized a specific water outlet. This data was then compared with the city, state and national averages. Further this data was then recalculated for a hypothetical “Low Flow Scenario”. Low Flow Devices were found from different retailers and most water efficient were selected on the basis of lowest price. Since the data was recorded manually, there is a possibility that the collected information may not provide an entirely accurate representation of the water consumption associated with various household accessories (Borg et al., n.d.)
(Abbas et al., 2022) reported that Water and Sanitation Agency (WASA) Lahore, Pakistan, provides potable water to approximately 5.29 million individuals via the utilization of 598 tube wells. However, they are confronted with numerous challenges including the inability to satisfy a swiftly escalating demand for water, depletion of groundwater table and insufficient returns on water tariffs. In any case, the actual consumption of water and water loss could not be ascertained as a result of the inoperability of water meters. The objective of their study was to estimate the actual water consumption, losses and production within the WASA Lahore service region using the available functional water meters (14,030 consumer meters) and operational pump data. The findings indicated a notable disparity between the recorded water consumption and the actual amount of water used, with an average estimated water loss of 45.4%.
The literature reviewed above reflects that few researchers have conducted studies on the consumption of water and patterns within the residential areas and particularly in urban settings of Pakistan. but no study exists that investigates per capita water demand and water consumption pattern for residential apartment complex in Pakistan.
III. METHODOLOGY
The goal of this study was to evaluate the water consumption in a residential apartment complex located in an urban area of Peshawar, Pakistan.
A. Study Area
The study was conducted at DEANS Heights in Hayatabad, Peshawar, to ensure easy access for data collection.
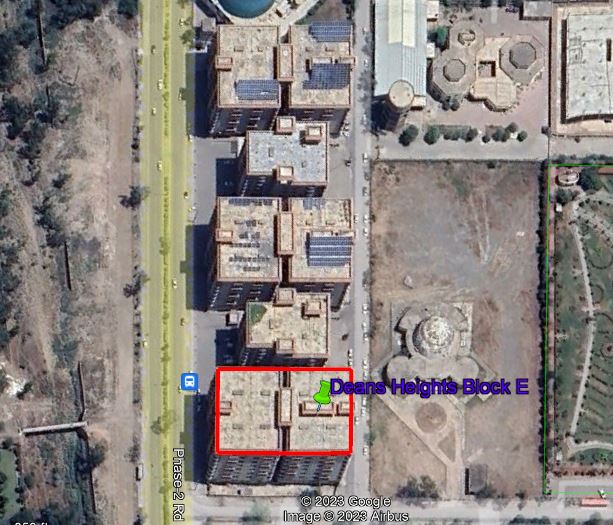
Figure 1: Location of Study Area
B. Equipment
For conducting this research, a variety of equipment and devices were utilized. Initially all these equipment’s were carefully assembled. This critical step served as the foundational framework upon which the entirety of our research endeavors relies. Also, SCT-013 AC Current shown in the figure was used for assessing the water pump condition for switched ON and OFF.
Before the installation of ultrasonic sensors in the water tanks for data collection, a series of validation tests were carried out to assess the accuracy and range of the ultrasonic sensors and data loggers.
C. Device Installation
After verifying the accuracy of the data logger and sensor through testing, the program was installed, and the settings were configured in the data loggers. Subsequently, the ultrasonic sensors were installed in the overhead water tank of the selected multifamily apartment complex.
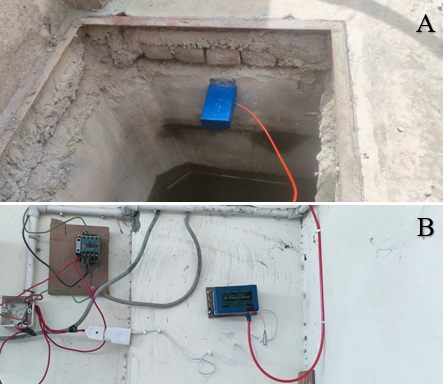
Figure 2: A) Ultrasonic Sensor Installed Parallel to Water Surface, B) Data Logger
Water consumption data was continuously recorded at 5-minute intervals using ultrasonic sensors integrated with data loggers, and stored on an SD card in CSV format (Excel format). This data collection process operated continuously, 24 hours a day, 7 days a week, ensuring comprehensive monitoring. The data from the SD cards was retrieved on a weekly basis, and the information for both the overhead water tank and the water pump was subsequently combined into a single Excel sheet for analysis. Statistical calculations were conducted using an MS Excel spreadsheet. The daily water consumption in liters per capita per day (lpcd) was determined by dividing the total water usage over a 24-hour period by the total population.
IV. RESULTS
The purpose of this study was to use IoT based data loggers to evaluate water demand for residential apartment complex in Peshawar, Pakistan. Our analysis of the research data finds that the per capita water consumption ranges from 97 liters per person per day (l/p/d) to 209 l/p/d. While the average per capita water consumption was found to be 173 l/p/d.
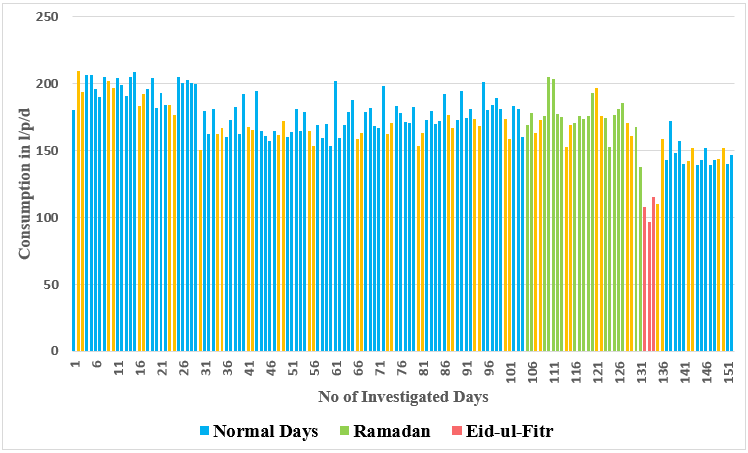
Figure 3: Diurnal Consumption Pattern
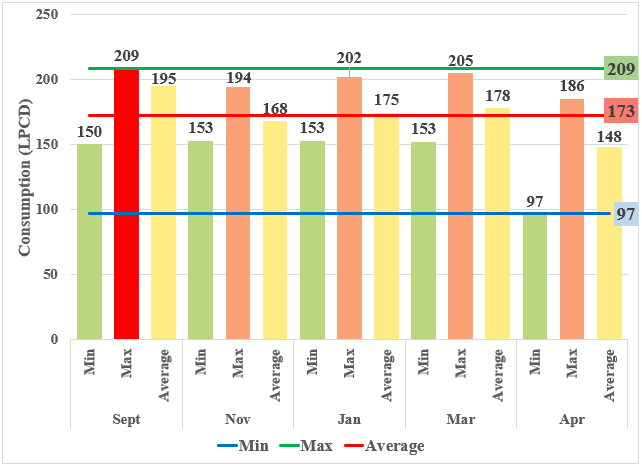
Figure 4: Minimum, Maximum and Average Per Capita Consumption
The average weekly water consumption has also been calculated which includes consumption during working days and also on weekends.
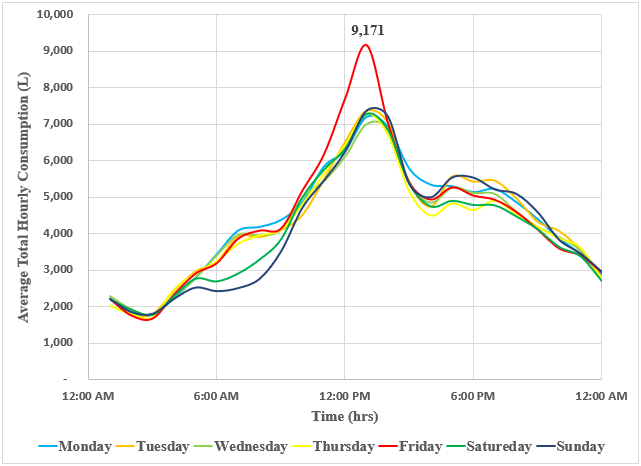
Figure 5: Average Total Hourly Consumption
The peaking factors were also derived on the basis of average consumption during 24 hours. The analysis of hourly peaking factors reveals that the maximum peak factor occurs at 1:00 PM, reaching a value of 1.78. This indicates a significant increase in water usage during this time.
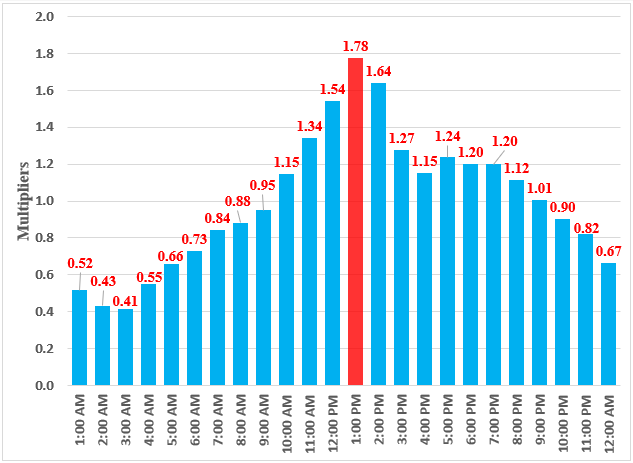
Figure 6: Hourly Peaking Factors
Conclusion
This study successfully demonstrates that the use of ultrasonic sensors for real-time monitoring of household water consumption is an accurate and robust methodology. The approach taken in this study has been verified for multifamily residential apartment complexes and can serve as a foundation for future studies. Moreover, this methodology has the potential to be applied on a larger scale. Findings reveal that per capita water consumption ranges from 97 liters per person per day (l/p/d) to 209 l/p/d, depending on the day and whether there is an event or festival such as Ramadan or Eid. The average per capita water consumption was found to be 173 l/p/d. Further analysis derived peaking factors based on the average 24-hour consumption. The highest peak factor, 1.78, occurs at 1:00 PM, indicating a significant increase in water usage at this time. Overall, this study offers valuable insights into water consumption patterns and demand within a residential apartment complex, emphasizing the effectiveness of ultrasonic sensors. It also highlights the potential for broader application of this methodology in similar contexts.
References
[1] Abbas, M., Kazama, S., & Takizawa, S. (2022). Water Demand Estimation in Service Areas with Limited Numbers of Customer Meters—Case Study in Water and Sanitation Agency (WASA) Lahore, Pakistan. Water, 14(14), 2197. https://doi.org/10.3390/w14142197 [2] Abedin, S. B., & Rakib, Z. B. (2013). Generation and Quality Analysis of Greywater at Dhaka City. Environmental Research, Engineering and Management, 64(2), 29–41. https://doi.org/10.5755/j01.erem.64.2.3992 [3] Athuraliya, A., Roberts, P., & Brown, A. (2012). Residential Water Use Study (p. Volume 2). [4] Borg, M., Edwards, O., & Kimpel, S. (n.d.). A Study of Individual Household Water Consumption. [5] Gabriel, H. F., & Khan, S. (2006, November 6). Policy Options for Sustainable Urban Water Cycle Management for Lahore, Pakistan. ERSEC Workshop on Sustainable Water Management - Problems and Solutions under Water Scarcity, Beijing, China. http://hdl.handle.net/102.100.100/176085?index=1 [6] Jorge, C., Vieira, P., Rebelo, M., & Covas, D. (2015). Assessment of Water use Efficiency in the Household Using Cluster Analysis. Procedia Engineering, 119, 820–827. https://doi.org/10.1016/j.proeng.2015.08.945 [7] Lee, D., Park, N., & Jeong, W. (2012). End?use analysis of household water by metering: The case study in Korea. Water and Environment Journal, 26(4), 455–464. https://doi.org/10.1111/j.1747-6593.2011.00304.x [8] Lyu, H.-M., Shen, S.-L., Zhou, A., & Yang, J. (2019). Perspectives for flood risk assessment and management for mega-city metro system. Tunnelling and Underground Space Technology, 84, 31–44. https://doi.org/10.1016/j.tust.2018.10.019 [9] Sadr, S., Memon, F., Jain, A., Gulati, S., Duncan, A., Hussein, W., Savi?, D., & Butler, D. (2016). An Analysis of Domestic Water Consumption in Jaipur, India. British Journal of Environment and Climate Change, 6(2), 97–115. https://doi.org/10.9734/BJECC/2016/23727
Copyright
Copyright © 2024 Bilal Khan, Salman Saeed. This is an open access article distributed under the Creative Commons Attribution License, which permits unrestricted use, distribution, and reproduction in any medium, provided the original work is properly cited.

Download Paper
Paper Id : IJRASET64799
Publish Date : 2024-10-25
ISSN : 2321-9653
Publisher Name : IJRASET
DOI Link : Click Here
 Submit Paper Online

