Ijraset Journal For Research in Applied Science and Engineering Technology
- Home / Ijraset
- On This Page
- Abstract
- Introduction
- Conclusion
- References
- Copyright
Diabetes Prediction Using Classification Algorithms
Authors: N. Thanuja Sri, G S Uday Kumar
DOI Link: https://doi.org/10.22214/ijraset.2024.64969
Certificate: View Certificate
Abstract
Diabetes is a metabolic disorder characterized by elevated blood glucose levels, leading to potential complications affecting various organs. This study aims to employ machine learning algorithms to accurately predict diabetes at an early stage. A dataset from Kuppam, AP, was utilized to analyze the relationship between chronic diseases and diabetes. Machine learning models, including K-Nearest Neighbors (KNN), Decision Trees (DT), Random Forest (RF), and logistic regression were implemented. Our findings demonstrate that Decision Tree outperforms other models in predicting diabetes, suggesting its potential as a valuable tool for early detection and intervention.
Introduction
I. INTRODUCTION
Diabetes is a long-term health issue that disrupts how your body regulates blood sugar. It occurs when your body either doesn't produce enough insulin, a key hormone, or can't use the insulin it makes effectively. Factors like obesity and elevated blood sugar levels can contribute to diabetes. According to the World Health Organization (WHO), a staggering 422 million people worldwide are living with diabetes.
Diabetes mellitus, a chronic metabolic disorder characterized by high blood sugar levels, significantly impacts public health. It increases the risk of developing various chronic illnesses, leading to increased healthcare costs and reduced quality of life. Understanding the complex relationship between diabetes and co-occurring chronic diseases is crucial for developing effective preventive measures and improving patient care.
The challenge is that without proper tools for early detection, diabetes often goes undiagnosed until complications arise. Early diagnosis is crucial for managing diabetes and preventing serious health consequences. This research explores the use of machine learning (ML) to predict diabetes by analyzing relevant data points.
A. Machine Learning: A Powerful Tool for Prediction
Machine learning, a branch of artificial intelligence (AI), empowers computer programs to enhance their predictive abilities without explicit programming. These algorithms learn from past data to forecast future outcomes. Various ML techniques can effectively extract knowledge by building different classification and ensemble models from collected datasets. This data can then be used to predict the likelihood of diabetes.
While many ML techniques offer strong prediction capabilities, choosing the optimal one can be a complex task. Therefore, this study will explore the application of popular classification and ensemble methods on a specific dataset to predict diabetes with high accuracy.
Machine learning offers a powerful tool for analyzing large datasets and identifying patterns in healthcare data. This community service project used machine learning to investigate the link between diabetes and chronic diseases within a kuppam population.
III. LITERATURE SURVEY
1) TITLE: Random Forest Algorithm for the Prediction of Diabetes
AUTHOR & YEAR: K. VijiyaKumar, B. Lavanya, I. Nirmala, S. Sofia Caroline, 2019
This research done by VijayaKumar [2] focuses on early diabetes prediction using machine learning. The authors propose using the Random Forest algorithm to identify diabetes in patients. By analyzing patient data, the model aims to accurately predict the onset of diabetes, allowing for earlier intervention and potentially preventing serious complications. The study emphasizes the importance of early detection and the potential of machine learning in improving diabetes care.
2) TITLE: Predicting Diabetes with Machine Learning
AUTHOR & TITLE: Faruque, Asaduzzaman, Sarker, 2019
Faruque [3] in their research focused on using machine learning to predict diabetes mellitus. The authors compared four algorithms: SVM, Naive Bayes, K-Nearest Neighbors, and C4.5 Decision Tree. The study found that C4.5 Decision Tree achieved the highest accuracy in predicting diabetes, as depicted in the provided image, where it outperforms the other algorithms.
Accuracy Comparison:
- C4.5 Decision Tree: Approximately 74%
- K-Nearest Neighbors (KNN): Approximately 71%
- Naive Bayes (NB): Approximately 68%
- Support Vector Machine (SVM): Approximately 65%
These results suggest that C4.5 Decision Tree is a promising method for early diabetes prediction.
3) TITLE: Predicting Diabetes Onset an Ensemble Supervised Learning Approach
AUTHOR & YEAR:Nnamoko, Hussain, England, 2018
Nnamoko[10] study focused on improving diabetes prediction accuracy using ensemble methods. It combined five different machine learning algorithms (SMO, RBF, C4.5, Naive Bayes, RIPPER) and feature selection to create a more accurate prediction model. The ensemble approach achieved an accuracy of 83%, surpassing previous studies on the same dataset.
4) TITLE: Prediction of diabetes using classification algorithms
AUTHOR & YEAR: D. Sisodia and D. S. Sisodia,2018
This research proposed by D. Sisodia[12] compared three machine learning algorithms: Decision Tree, SVM, and Naive Bayes. Using the Pima Indians Diabetes Database, the researchers evaluated these models based on accuracy, precision, recall, and F-measure. Naive Bayes outperformed the others with an accuracy of 76.30%. While promising, the study suggests further exploration with other algorithms and potential improvements in prediction accuracy.
5) TITLE: Predicting Diabetes with Machine Learning
AUTHOR & YEAR:Khaleel & Al-Bakry, 2021
Khaleel [30] explored using machine learning to forecast diabetes. The researchers compared Logistic Regression, Naïve Bayes, and K-Nearest Neighbors algorithms on the Pima Indian Diabetes dataset. Logistic Regression achieved the highest accuracy of 94% in predicting diabetes from the Pima Indian Diabetes dataset.
6) TITLE: Predicting Diabetes with Machine Learning
AUTHOR & YEAR:Tripathi, Sharma, Gupta, et al., 2023
Tripathi [33] investigates using machine learning to predict diabetes. The authors compared various algorithms and found that ensemble methods, applied to the PIMA diabetes dataset, yielded the highest accuracy. The study emphasizes the potential of machine learning in early diabetes detection using large medical datasets.
III. METHODOLOGY
The initial focus of this section is to elucidate the research methodology graphically illustrated in Figure 1. The methodology used in this research is quite simple, consisting of four main stages: dataset collection, preprocessing, classification, and evaluation, presented in subsections 3.1 to 3.4
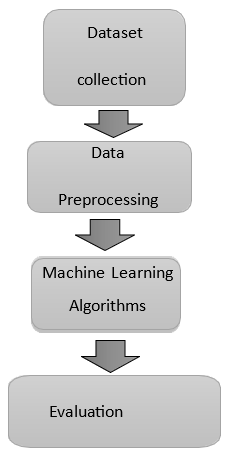
Fig.1. Research Methodology
A. Data Collection
This project utilizes two datasets to predict diabetes. The first dataset, sourced from Kaggle's Diabetes Health Indicators Dataset, serves as the training data. The second dataset, which we personally collected from our community in Kuppam, Andhra Pradesh, India, will be used for testing the model's generalizability.
Both datasets share a common set of attributes related to diabetes risk factors and health status. These attributes include demographic information like age and gender, medical history such as diabetes diagnosis, blood sugar levels, and the presence of co-morbidities like heart disease, stroke, and high cholesterol. Additionally, information on health behaviors like cholesterol screening, fruit intake, blood pressure, and medication use for diabetes or other conditions is also included.
By leveraging the rich data from both sources, this project aims to develop a robust model for predicting diabetes. The training data from Kaggle provides a strong foundation, while the community data from Kuppam allows us to assess how well the model performs in a real-world setting.
The features used in the Diabetes Health Indicators Dataset from kaggle are presented in table1.
The features used in the Dataset from my own community are presented in table2.
Table. 1. Diabetes Health Indicators Dataset
|
<class 'pandas.core.frame.DataFrame'> RangeIndex: 253680 entries, 0 to 253679 Data columns (total 11 columns): |
|||
|
# |
Column |
Non-Null Count |
Dtype |
|
--- |
------ |
-------------- |
----- |
|
0 |
Diabetes |
253680 non-null |
int64 |
|
1 |
BloodPressure |
253680 non-null |
int64 |
|
2 |
Cholestrol |
253680 non-null |
int64 |
|
3 |
CholestrolCheck |
253680 non-null |
int64 |
|
4 |
Smoke |
253680 non-null |
int64 |
|
5 |
Stroke |
253680 non-null |
int64 |
|
6 |
HeartAattack |
253680 non-null |
int64 |
|
7 |
phyActivity |
253680 non-null |
int64 |
|
8 |
Fruit |
253680 non-null |
int64 |
|
9 |
Sex |
253680 non-null |
int64 |
|
10 |
Age |
253680 non-null |
int64 |
|
dtypes: int64(11) memory usage: 21.3 MB |
|||
Table.2.Test Data(info)
|
<class 'pandas.core.frame.DataFrame'> RangeIndex: 119 entries, 0 to 118 Data columns (total 11 columns): |
|||
|
# |
Column |
Non-Null Count |
Dtype |
|
--- |
------ |
-------------- |
----- |
|
0 |
Diabetes |
119 non-null |
int64 |
|
1 |
BloodPressure |
119 non-null |
int64 |
|
2 |
Cholestrol |
119 non-null |
int64 |
|
3 |
CholestrolCheck |
119 non-null |
int64 |
|
4 |
Smoke |
119 non-null |
int64 |
|
5 |
Stroke |
119 non-null |
int64 |
|
6 |
HeartAattack |
119 non-null |
int64 |
|
7 |
phyActivity |
119 non-null |
int64 |
|
8 |
Fruit |
119 non-null |
int64 |
|
9 |
Sex |
119 non-null |
int64 |
|
10 |
Age |
119 non-null |
float64 |
|
dtypes: float64(1), int64(10) memory usage: 10.4 KB |
|||
B. Data Preprocessing
Before applying machine learning algorithms, the data underwent preprocessing to ensure its quality and consistency.
"Fortunately, the datasets I used exhibited no missing values."
C. Machine learning algorithms
This project utilized several machine learning algorithms to explore the relationship between diabetes and chronic diseases:
1) Logistic Regression
Logistic Regression (LR) is a classification model that estimates the probability of a data point belonging to a specific category based on its features. It employs a logistic function to model the relationship between the features and the categorical outcome. It assumes the distribution P (y|x), X is the featurevector and Y is the class, it is on a boundary shape, which is shown from the training data. The probability of class y occurring given the features x, denoted as P(y|x), is determined by applying the sigmoid function to a linear combination of the features.This explained in Equations given below Eq(1),Eq(2).
zY,X=i=1NwifiY,X (1)
pYX=11+exp?(-zY,X) (2)
Where P is the likelihood (y|x), it denotes the weight of the word, i is randomly chosen, f is the frequency, y denotes the class, X denotes the feature-vector and exp denotes the exception.
2) K-Nearest Neighbors (KNN)
This algorithm excels at identifying clusters or groups within data. We employed KNN to identify subgroups within the diabetic population with a higher risk of developing specific chronic diseases based on their similarity to existing cases.
K-nearest neighbor (KNN) is a type of supervised learning that is widely used in pattern recognition. KNN is a widely adopted classification technique due to its simplicity. To classify a new data point, the algorithm identifies its K closest neighbors in the feature space based on a defined distance metric. The class label of the new data point is determined by a majority vote among the labels of these K neighbors.KNN classifier requires the use of a wide range of distance metrics, the best of which is the Euclidean distance as present in this equation eq(3).
Euclidean=i=1k(xi-yi)2 (3)
3) Decision Tree
Decision tree is a basic classification method. It is supervised learning method. Decision tree used when response variable is categorical. Decision trees are tree-structured models that represent a classification process based on input features. These input features can be of various data types, including numerical, categorical, textual, or even graphical. Steps for Decision Tree.
Algorithm-
- Step 1: Create a hierarchical structure where each decision point is represented by an input feature.
- Step 2:Select feature to predict the output from input feature whose information gain is highest.
At each node in the tree, the attribute that maximizes information gain is selected as the splitting criterion.
This process is recursively applied to the subsets created by the split, using attributes not previously considered.
4) Random Forests
This method is an ensemble technique applicable to both classification and regression problems.It consistently outperforms individual models in terms of accuracy. This method can easily handle large datasets. Random Forest is developed by Leo Bremen. It is popular ensemble Learning Method. Random Forest Improve Performance of Decision Tree by reducing variance. During training, it constructs multiple decision trees. For classification tasks, the final prediction is determined by the most frequent class among all trees. In regression problems, the average prediction from all trees is used as the final output.
Algorithm-
- Step 1: Random Feature Selection
- Randomly select a subset of R features from the total M features where R is significantly smaller than M.
- Step 2: Build a Decision Tree
- Determine the optimal feature and split point among the selected R features to create a decision node.
- Split the node into child nodes based on the chosen split point.
- Recursively repeat step 2 until the tree reaches the maximum depth l or other stopping criteria.
- Step 3: Create Forest
- Repeat steps 1 and 2 to build n decision trees.
- Combine the predictions from the n trees to make a final prediction.
For each algorithm, the data was divided into a training set (used to train the model) and a testing set (used to evaluate the model's performance). Hyperparameter tuning, which involves optimizing parameters specific to each algorithm, was performed to achieve optimal model performance.
D. Results
1) Performance Metrics
The performance of each machine learning algorithm was evaluated using standard metrics:
- Accuracy:
Accuracy is a metric that measures the proportion of correct predictions made by a model compared to the total number of predictions.
Logistic Regression: 0.8392
Decision Tree: 0.8396
Random Forest: 0.8392
KNN: 0.8213
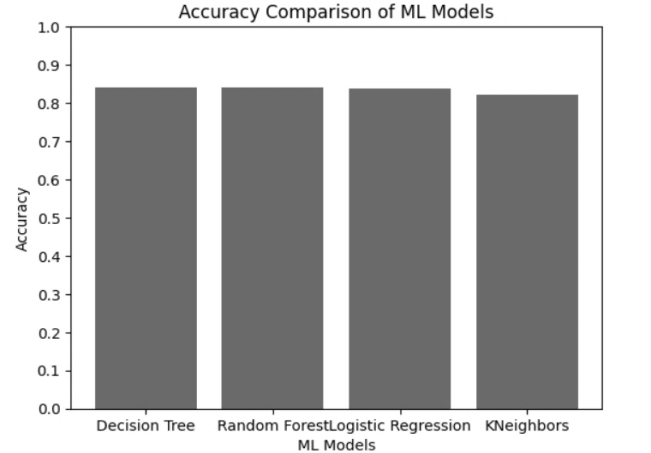
Fig.2.Accuracy
- Precision
Represents the number of true positives that are separated by the number of the false positives and the number of the true positives . As present in this equation eq(4)
Precision = TP /(TP +FP) (4)
Where FP: False Positives and TP: True Positives.
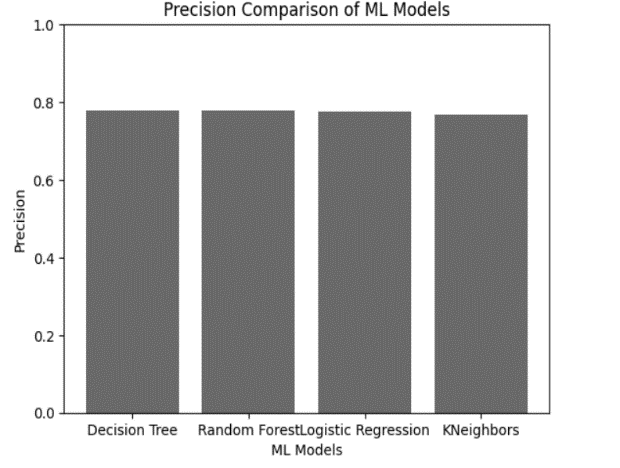
Fig.3.Precision
- Recall
Recall refers to the model's ability to identify all relevant examples within a dataset. Recall indicates the proportion of correct positive predictions among all instances predicted as positive.
Recall = TP /(TP + FN) (5)
Where TP: True Positives and FN: False Negatives.
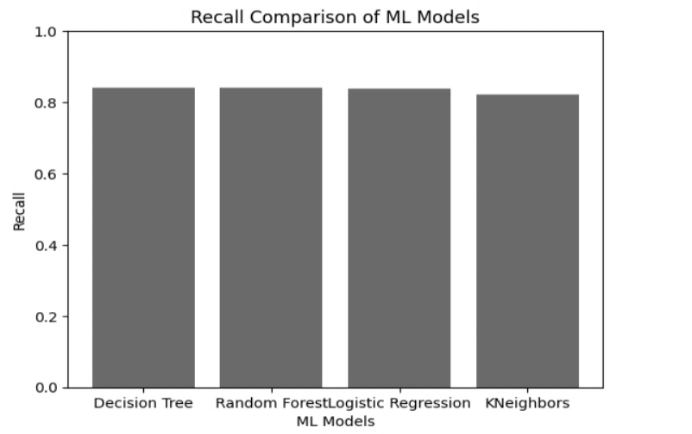
Fig.4.Recall
- F1-measure
It is also called F Measure or F score which is the balance between recall and precision. F1 score is particularly valuable when minimizing both false positives and false negatives is critical.As present in this equation eq(6)
F1-score=2*Precision*Recall/ (Precision+ Recall) (6)
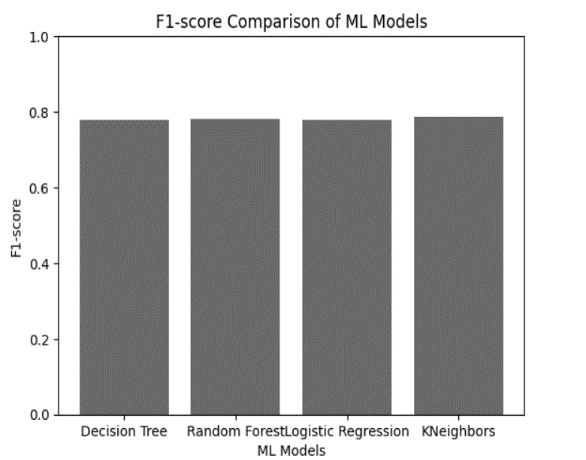
Fig.5.F1-Measure
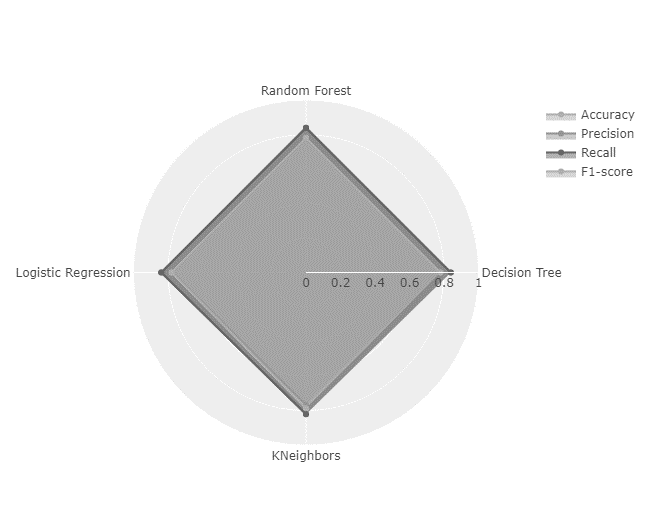
Fig.6. Radar plot
|
Classification algorithms |
Accuracy |
Precision |
Recall |
F1 score |
|
Decision Tree |
0.8396 |
0.7781 |
0.8396 |
0.7786 |
|
Random Forest |
0.8392 |
0.7766 |
0.8392 |
0.7790 |
|
Logistic Regression |
0.8391 |
0.7746 |
0.8391 |
0.7780 |
|
KNN |
0.8213 |
0.7672 |
0.8213 |
0.7874 |
Table.3.RESULTS
Conclusion
This study aimed to develop a robust machine learning model for predicting diabetes. By employing a combination of classification and ensemble techniques, including KNN, Random Forest, Decision Tree and Logistic Regression we achieved a classification accuracy of 83%. These findings underscore the potential of machine learning in early diabetes detection, enabling healthcare providers to make timely interventions and improve patient outcomes.
References
[1] Debadri Dutta, Debpriyo Paul, Parthajeet Ghosh, \"Analyzing Feature Importance’s for Diabetes Prediction using Machine Learning\". IEEE, pp 942- 928, 2018. [2] K.VijiyaKumar, B.Lavanya, I.Nirmala, S.Sofia Caroline, \"Random Forest Algorithm for the Prediction of Diabetes \".Proceeding of International Conference on Systems Computation Automation and Networking, 2019. [3] Md. Faisal Faruque, Asaduzzaman, Iqbal H. Sarker, \"Performance Analysis of Machine Learning Techniques to Predict Diabetes Mellitus\". International Conference on Electrical, Computer and Communication Engineering (ECCE), 7-9 February, 2019. [4] Nonso Nnamoko, Abir Hussain, David England, \"Predicting Diabetes Onset: an Ensemble Supervised Learning Approach \". IEEE Congress on Evolutionary Computation (CEC), 2018. [5] Nahla B., Andrew et al,\"Intelligible support vector machines for diagnosis of diabetes mellitus. Information Technology in Biomedicine\", IEEE Transactions. 14, (July. 2010), 1114-20. [6] A.K., Dewangan, and P., Agrawal, “Classification of Diabetes Mellitus Using Machine Learning Techniques,” International Journal of Engineering and Applied Sciences, vol. 2, 2015. [7] T. M. Cover, “Geometrical and statistical properties of systems of linear inequalities with applications in pattern recognition,” IEEE Transactions on Electronic Computers, vol. 14, no. 3, pp. 326-334, Jun. 1965. [8] K.VijiyaKumar, B.Lavanya, I.Nirmala, S.Sofia Caroline, \"Random Forest Algorithm for the Prediction of Diabetes \".Proceeding of International Conference on Systems Compu- tation Automation and Networking, 2019. [9] Tejas N. Joshi, Prof. Pramila M. Chawan, \"Diabetes Prediction Using Machine Learning Techniques\".Int. Journal of Engineer- ing Research and Application, Vol. 8, Issue 1, (Part -II) Janu- ary 2018, pp.-09-13 [10] Nonso Nnamoko, Abir Hussain, David England, \"Predicting Diabetes Onset: an Ensemble Supervised Learning Approach \". IEEE Congress on Evolutionary Computation (CEC), 2018. [11] Deeraj Shetty, Kishor Rit, Sohail Shaikh, Nikita Patil, \"Diabe- tes Disease Prediction Using Data Mining \".International Con- ference on Innovations in Information, Embedded and Com- munication Systems (ICIIECS), 2017. [12] D. Sisodia and D. S. Sisodia, “Prediction of diabetes using classification algorithms,” Procedia Computer Science, vol. 132, pp. 1578-1585, Jan. 2018. [13] S. Perveen, M. Shahbaz, A. Guergachi, and K. Keshavjee, “Performance analysis of data mining classification techniques to predict diabetes,” Procedia Computer Science, vol. 82, pp. 115-121, Mar. 2016. [14] M. Pradhan and G. R. Bamnote, “Design of Classifier for Detection of Diabetes Mellitus Using Genetic Programming,” in Proc. third International Conference on Frontiers of Intelligent Computing: Theory and Applications, Nov. 2015, pp. 763-770. [15] N. Nai-arun and R. Moungmai, “Comparison of classifiers for the risk of diabetes prediction,” Procedia Computer Science, vol. 69, pp. 132-142, Dec. 2015. [16] M. Maniruzzaman, N. Kumar, M. M. Abedin, M. S. Islam, H. S. Suri, A. S. El-Baz, and J. S. Suri, “Comparative approaches for classification of diabetes mellitus data: Machine learning paradigm,” Computer Methods and Programs in Biomedicine, vol. 152, pp. 23-34, Dec. 2017. [17] R. Bansal, N. Gaur, and S. N. Singh, “Outlier Detection: Applications and techniques in data mining,” in Proc. sixth International Conference- Cloud System and Big Data Engineering, Jan. 2016, pp. 373-377. [18] D. Cousineau and S. Chartier, “Outliers detection and treatment: A review,” International Journal of Psychological Research, vol. 3, no. 1, pp. 58-67, Mar.2010. [19] C. R. Rao, “The use and interpretation of principal component analysis in applied research,” Sankhya: The Indian Journal of Statistics, Series A, pp. ¯ 329- 358, Dec. 1964. [20] A. Hyvärinen and E. Oja, “Independent Component Analysis: Algorithms and applications,” Neural Networks, vol. 13, no. 4-5, pp. 411-430, Jun. 2000. [21] F. Han and H. Liu, “Statistical analysis of latent generalized correlation matrix estimation in transelliptical distribution,” Bernoulli: official journal of the Bernoulli Society for Mathematical Statistics and Probability, vol. 23, no. 1, pp. 23-57, Feb. 2017. [22] S. Arlot and A. Celisse, “A survey of cross- validation procedures for model selection,” Statistics surveys, vol. 4, pp. 40-79, Jul. 2010. [23] D. Krstajic, L. Buturovic, D. E. Leahy, and S. Thomas, “Cross-validation pitfalls when selecting and assessing regression and classification models,” Journal of Cheminformatics, vol. 6, no. 1, pp. 10, Mar. 2014. [24] X. Zeng and T. R. Martinez, “Distribution-balanced stratified crossvalidation for accuracy estimation,” Journal of Experimental & Theoretical Artificial Intelligence, vol. 12, no. 1, pp. 1-12, Nov. 2000. [25] P. Cunningham and S. J. Delany, “k-Nearest neighbour classifiers,” Multiple Classifier Systems, vol. 34, no. 8, pp. 1-17, Mar. 2007. [26] T. Chen and C. Guestrin, “XGboost: A scalable tree boosting system,” in Proc. 22nd ACM SIGKDD International Conference on Knowledge Discovery and Data Mining, Aug. 2016, pp. 785-794. [27] S. Hsieh, S. Hsieh, P. Cheng, C. Chen, K. Hsu, I. Wang, and F. Lai, “Design ensemble machine learning model for breast cancer diagnosis,” Journal of Medical Systems, vol. 36, no. 2012, pp. 2841- 2847, Jul. 2011. [28] B. Harangi, “Skin lesion classification with ensembles of deep convolutional neural networks,” Journal of Biomedical Informatics, vol. 86, pp. 25- 32, Oct. 2018. [29] A. S. Miller, B. H. Blott, and others, “Review of neural network applications in medical imaging and signal processing,” Medical and Biological Engineering and Computing, vol. 30, no. 5, pp. 449- 464, Jan. 1992. [30] Alaa Khaleel, F., & Al-Bakry, A. M. (2021). Diagnosis of diabetes using machine learning algorithms.Materials Today:Proceedings. doi:1 0.1016/j.matpr.2021.07.196 [31] A. S. Glas, J. G. Lijmer, M. H. Prins, G. J. Bonsel, and P. M. M. Bossuyt, “The Diagnostic Odds Ratio: A single indicator of test performance,” Journal of Clinical Epidemiology, vol. 56, no. 11, pp. 1129- 1135, Nov. 2003. [32] P. Ramachandran, B. Zoph, and Q. V. Le, “Searching for activation functions,” arXiv:1710.05941, Oct. 2017. [33] Tripathi,R.P.,Sharma,M., Gupta,A.K. et al.Timely Prediction of Diabetes by Means of machine Learning Practices.Augment Hum Res 8, 1 (2023).
Copyright
Copyright © 2024 N. Thanuja Sri, G S Uday Kumar. This is an open access article distributed under the Creative Commons Attribution License, which permits unrestricted use, distribution, and reproduction in any medium, provided the original work is properly cited.

Download Paper
Paper Id : IJRASET64969
Publish Date : 2024-11-03
ISSN : 2321-9653
Publisher Name : IJRASET
DOI Link : Click Here
 Submit Paper Online

