Ijraset Journal For Research in Applied Science and Engineering Technology
- Home / Ijraset
- On This Page
- Abstract
- Introduction
- Conclusion
- References
- Copyright
Study of Dielectric Properties of Typical Electrical Insulating Materials by Terahertz Wave Spectroscopy
Authors: M K Maurya, Pramila Yadav, Sangeeta Pandey
DOI Link: https://doi.org/10.22214/ijraset.2024.63973
Certificate: View Certificate
Abstract
This research paper uses a special kind of light is called terahertz waves to study the properties of materials that prevent electricity from flowing, like plastics and glass. Dielectrical insulating materials play an important role in the Insulation coordination of electric power systems such as transformers and high Voltage power cable. Dielectric insulating materials are evaluated based on their dielectric constant, dielectric strength, loss tangent, and thermal stability. The dielectric constant determines the material\'s ability to store electrical energy, while the dielectric strength indicates the maximum electric field the material can withstand without breaking down. The loss tangent measures energy dissipation as heat, which is crucial for minimizing energy losses in electrical systems. Terahertz (THz) wave spectroscopy has emerged as a powerful technique for the non-destructive evaluation of dielectric properties in electrical insulating materials. This study investigates the application of THz time-domain spectroscopy (THz-TDS) for characterizing typical insulating materials such as polyethylene (PE), polytetrafluoroethylene (PTFE), and epoxy resins. This research can help improve the design and performance of electrical devices, making them safer, more efficient, and more reliable.
Introduction
I. INTRODUCTION
A dielectric material is an insulator, or a poor conductor of electricity, which means that no current can flow through it when a voltage is applied. But certain changes do occur at the atomic scale. When a voltage is placed across a dielectric surface, it becomes polarized. Polarization is an effect that slightly moves electrons towards the positive voltage because atoms are made up of negatively charged electrons and a positively charged nucleus. They do not go far enough to cause a current to flow through the material; the change is minute but significant, particularly in the case of condensers.[1-5]
When the voltage source is removed from the material, it either goes back to its initial non-polarized state or, in the case of weak molecular connections, stays polarized. It is not widely known how dielectric terminology and isolator terms differ from one another. Although all dielectric materials are insulators, a good dielectric is one that is readily polarized. Dielectric Constant the ability of an object to hold onto energy in the form of an electrical field to the extent that a substance concentrates electrical flux is known as the dielectric constant. It is also known as the permittivity ratio of the item to that of open space.[6-7]
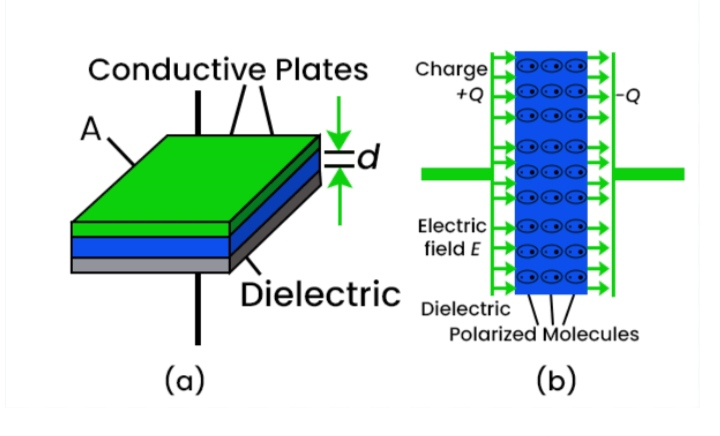
Fig.- Dielectric typical electrical insulating materials
Overhead power line insulation coordination is significantly influenced by the electrical insulation materials. Their advanced age may pose a concern to the power system's stability and safety. The dielectric characteristics must be tested in order to choose suitable insulating materials or assess how old they are.[8] A novel technique and effective instrument for examining the dielectric characteristics of materials at timeframes spanning multiple orders of magnitude is broadband dielectric spectroscopy (BDS).[9] A dielectric is an electrical insulator that can be polarized by the action of an applied electric field Dielectrics, which are materials responding to an external electric stimulation with a polarization, have been widely used in industries such as capacitors, insulation layer and energy storage devices.[10-12] From manufacture and device reliability point of view, dielectrics, which are flexible, easy to process, and can stand with high mechanical impact, are highly desirable. [13] Conversely, from property point of view, dielectrics with high dielectric constant and high dielectric strength (or breakdown field) are required for applications, such as high charge-storage density capacitor in IC due to the needs for miniaturizing devices. The dielectrics can be inorganic materials, such as Ta5 O2, BaTiO3 (BT), PbTiO3 (PT), Pb (Mg1/3Nb2/3) O3 (PMN) etc, or organic materials such as polypropylene,[14-15]
- Capacitors: Dielectrics are used between the plates of capacitors to store electrical energy. Materials like ceramic, glass, and certain polymers are commonly used due to their high dielectric constant.
- Cables and Wires: Insulating materials like rubber, plastic (PVC), and Teflon are used to coat electrical wires and cables to prevent short circuits and protect against electric shocks.
- Transformers: Dielectric oils and solid insulators like paper and pressboard are used in transformers to insulate the windings and provide cooling.
- Printed Circuit Boards (PCBs): Materials like fiberglass-reinforced epoxy laminate (FR4) are used in PCBs to provide electrical insulation between different conducting layers.
- Electrical Motors and Generators: Insulating varnishes and tapes are used to insulate windings in motors and generators to prevent electrical shorts and improve efficiency.
- High-Voltage Applications: Glass, porcelain, and polymer insulators are used in high-voltage power lines and substations to support and insulate conductors.
- Electronic Devices: Dielectric materials are used in various electronic components like transistors, diodes, and integrated circuits to isolate different regions and prevent electrical leakage.
- Dielectric Resonators: Used in microwave and RF circuits, materials like ceramic are used to create dielectric resonators for filters and oscillators due to their high dielectric constant and low loss.
II. METHOD AND MATERIALS
A. First Basic Method
Theoretical spectral signal of the reference signal is given by
Arϑ= A0 ϑ P1 ϑ, x1+ T+ x2  …………. 1
Where x1 is distance between the transmitting probe and the sample
x2 = The distance between the receiving probe and sample
T = Thickness of the sample.
The theoretical spectral signal of the sample signal is
A0 ϑ P1 ϑ , x1+ x2 P2 ϑ,T t12t21 X  {1+[ r21 P2ϑ,T ]2+ [ r21 P2ϑ,T ]4+ ……. P2 ϑ, T ]2n }
 ……. 2
……. 2
Where the value of A0 ϑ P1 ϑ x1+ x2 P2 ϑ,T t12t21 represents the energy transmitted through the sample.
H ϑ= AS ϑAr ϑ= t12t21P2 ϑ.T P1 ϑ.T  ………… 3
The transmission coefficient and the propagation factor in equation (3) are function of complex refractive index of material ~n2ϑ Further expressed as a function of ~n2ϑ
H ϑ=4 ~n2(ϑ) [ 1+~n2(ϑ)e-j~(n2ϑ-1) ϑT c …………..4
The reference signal and sample signal were measured separatly and then processed by the fast fourier transform to obtain the spectral signal Ar-m ϑ and AS-m ϑ
 .
.
Because of the presence of echo pulse in the original signal , it was crucial to preprocess the original reference signal and sample signal with time windows interception on time domain before FFT.
Let
H ϑ AS-m ϑAr-m ϑ=ρϑ<φ- φϑ …….. 5
Then the optical parameters of materials could be derived as follows
n2ϑ=1+ cφϑ ϑd ……….6
……….6
α2ϑ= 2k2ϑC=2nl { 4n2ϑρϑ [n2ϑ+1]2T  …………7
…………7
k2=cα2ϑ2ϑ …………8
…………8
Where 4n2ϑ, k2ϑ
k2ϑ and α2ϑare the real part of the complex refractive index
C = The speed of light
T = Thickness of sample
The dielectric properties could be given by
E2rϑ= n2(ϑ)2 - k2(ϑ)2
 ……………. 9
E2iϑ=2n2ϑk2ϑ …………… 10
tanδ=A2iϑA2rϑ ………… 11
Where A2rϑ and A2iϑ are the real part and imaginary part of the sample complex relative permittivity ~E2(ϑ)
 and tanδ
 is its dielectric loss tangent.
According to the theory of electromagnetic wave propagation the average refractive index n could be calculated by the time delay ?t  between the main pulse of reference signal and sample signal as follows
n= c?tT+ 1………..12
Where n= average refractive index , ?t = time delay , c= speed of light , T = Thickness Of Sample
The average refractive index n on terahertz band were carried out based on the T- Ray 500 plat form with temperature setting 200 and the relative humidity less than 10%.
B. Second Novel Method
A Reference signal is always required to extract the refractive index and the absorption coefficient of sample .when the refracted echo pulse is significant the second method can be applied. The second method proposed need only the sample signal as the data source and the measurement of reference signal becomes unnecessary.
The attempts are made by dividing the sample signal into main pulse and reflected echo pulse after that, the FFT is performed to obtain the spectral signal of the main pulse A1-mϑ and the spectral signal of the reflected echo pulse A2-mϑ,
 then the transfer function can be expressed as
H ϑ= A2-m ϑA1-m ϑ=M ϑ< -Lϑ
According to the definition the transfer function can also be calculated by
H ϑ= A2 ϑA1 ϑ= [ r21 P2ϑ,T ]2
And could be further expressed by a function of n2(ϑ)
H ϑ=[1- ~n2(ϑ) ]2[ 1+~n2(ϑ)]2e-j2~(n2ϑ-1) ϑd c
Then the optical parameters could be calculated by
n2ϑ= -cπϑT+ clϑ2ϑT
α2ϑ=lnMϑ[1+n2ϑ]2[1-n2ϑ]2 T
k2ϑ= -cα2ϑ2ϑ
And the dielectric properties could be obtained by
E2rϑ= n2(ϑ)2 - k2(ϑ)2
E2iϑ=2n2ϑk2ϑ
Similarly to using the time delay ?t  then the average refractive index value n can be given by
n=c?t2T
C. Debye Model
The Debye model describe the dielectric properties of materials specifically their frequency dependent behavior.
The model is often used to describe how the dielectric constant of a material changes with Frequency.
Debye model is the polarization (S) of a dielectric material in response to an electric field (E) does not accur instantaneously but follows a certain time characterized by a relaxation time (T).
Basic equation - The polarization (S) can be written as
S(t) = φ o (φ
o (φ r -1) E (t)
φ o is the permittivity of free space.
φ r is the relative permittivity
The time-dependent polarization p(t) is given by the differential equation
dS(t)dt+ S (t)T= φ0 ( φ
( φ r -1) dE(t)dt
We move to the Frequency domain by taking the fourier transform of the above equation.
If the electric field varies as E (t) = E0 iϑt
The polarization will also vary as S (t) = S0 iϑt
Substituting these into the differential equation gives
(iϑS0 + S0T
+ S0T ) = φ0
  (φ
(φ r -1) iϑ
 E0
E0
S0= φ0 (φ
(φ r -1) iϑ E0 iϑ+1T
The polarization (S) can thus be written as,
S = φ0 (φ
(φ r -1) iϑ E iϑ+1T
The complex permittivity φ(ϑ) is defined such that
S = φ0
φϑ- 1E
Comparing this equation with the above expression for S , we get.
φϑ- 1=  (φ
(φ r -1) iϑ iϑ+1T
Thus the complex permittivity φϑ is
is
φϑ=1+  (φ
(φ r -1) iϑ iϑ+1T
This can further simplified to
φsϑ= φ∞+φs- φ∞1+iϑT
Where,
φ∞ = The permittivity at infinite frequency
φs = The static permittivity
Real and Imaginary parts –
The complex permittivity ε(ω ) can be separated in to its real and imaginary parts
φ'(ϑ ) = φ∞+φs- φ∞1+(ϑT)2
φ"(ϑ ) = (φs- φ∞)
 ϑT1+(φT)2
Where ,
φ'ϑ= Real part of permittivity
φ"(ϑ ) = Imaginary part of the permittivity.
III. RESULT & DISCUSSION
A. Transmission Coefficient as a Function of Thickness
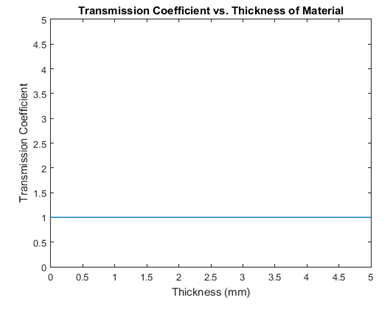
The graph displays an exponential decay in the transmission coefficient as the thickness of the dielectric material increases. This indicates that as the material becomes thicker, the transmission of terahertz waves decreases due to increased attenuation.
At very low thickness values (near 0 mm), the transmission coefficient approaches 1, suggesting that nearly all of the incident terahertz wave passes through the material with minimal loss.
The most significant reduction in transmission occurs within the initial few millimeters of thickness. This rapid decrease indicates that even small increases in material thickness can lead to substantial losses in transmitted signal strength.
As thickness increases further, the transmission coefficient approaches 0 but never quite reaches it. This behavior suggests that while transmission diminishes significantly with thickness, some fraction of the wave may still be transmitted through even very thick layers.
The shape of the curve is influenced by the absorption coefficient (α). A higher absorption coefficient would result in a steeper decline, while a lower coefficient would lead to a more gradual decrease in transmission with increasing thickness.
This relationship is crucial for characterizing the dielectric properties of insulating materials, as it can be used to infer material composition and structure based on how much terahertz energy is transmitted at varying thicknesses.
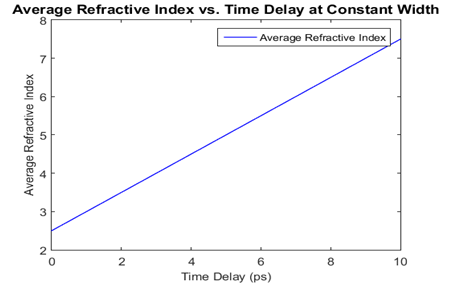
B. Average Refractive Index as a Function of Time Delay at Constant Width
The graph exhibits a clear linear relationship between the average refractive index and time delay. This suggests that the refractive index changes proportionally with time delay, indicating a consistent interaction of the terahertz wave with the dielectric material over time.
The slope of the line represents the rate of change of the refractive index with respect to time delay. A positive slope indicates that the refractive index increases as the time delay increases, which may suggest enhanced material response or interaction effects at longer delays. The graph starts at a specific initial value of the refractive index, defined by the parameter εr . This value serves as the baseline from which the linear increase is measured.
The linear nature of the relationship allows for straightforward predictions of the refractive index at any given time delay within the specified range. This is useful for practical applications in terahertz spectroscopy, where precise measurements are needed.
The relationship illustrated in the graph may provide insights into the dielectric properties of the insulating material. A consistent linear increase could suggest uniform material characteristics, while deviations from linearity (if they were to occur in experimental data) might indicate more complex interactions.
C. Dielectric Constant as a Function of Refractive Index
The graph illustrates a quadratic relationship between the dielectric constant (?) and the refractive index (n). This is mathematically expressed as ? = n2, indicating that the dielectric constant increases with the square of the refractive index.
As the refractive index increases from 1 to 3, the dielectric constant also increases correspondingly. This reflects the physical principle that materials with higher refractive indices typically exhibit greater dielectric properties.
The refractive index is plotted from 1 to 3, leading to dielectric constant values ranging from 1 to 9. This range encompasses many common dielectric materials, illustrating their electrical insulation capabilities.
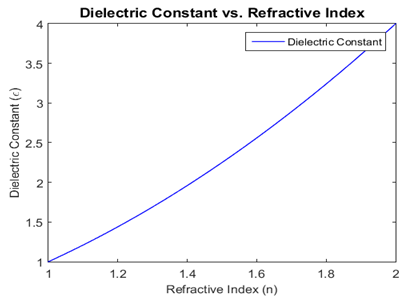
The graph provides valuable insights into the dielectric properties of materials. A higher dielectric constant indicates greater energy storage capability within an electric field, which is significant for applications in capacitors and insulators.
Understanding the relationship between the dielectric constant and refractive index is crucial for interpreting terahertz wave interactions with dielectric materials. The graph aids in identifying and characterizing materials based on their dielectric response.
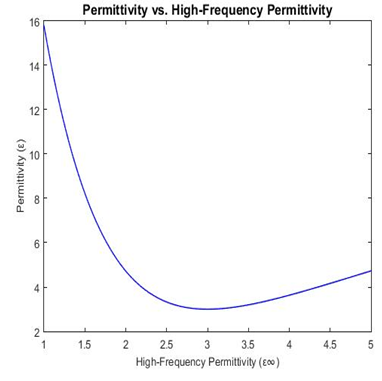
D. Permittivity of a Material as a Function of High Frequency Permittivity
The graph displays a monotonic relationship, indicating that as the high-frequency permittivity (?∞?) increases, the overall permittivity (?) also increases. This reflects the influence of high-frequency behavior on the material's dielectric properties. The permittivity approaches a specific value as the high-frequency permittivity increases. This behavior suggests that after a certain threshold, changes in high-frequency permittivity have diminishing effects on overall permittivity, indicative of material saturation. The static permittivity (?0) serves as a baseline, influencing the overall shape of the curve. This highlights the significance of low-frequency dielectric responses in determining the material's overall permittivity characteristics.
Understanding this relationship is crucial for characterizing dielectric materials, as it provides insights into energy storage capabilities under different frequency conditions, which is vital for applications in electronics and terahertz spectroscopy. The graph serves as a foundational tool for interpreting terahertz wave interactions with dielectric materials. It aids in determining how variations in high-frequency permittivity influence material responses, impacting measurements and interpretations in spectroscopy.
E. Permittivity as a function of Frequency in Hz for both Real and Imaginary part (Debey Model)
The graph illustrates how both the real and imaginary parts of the permittivity change with frequency, showcasing the dynamic response of the dielectric material to an applied electric field.
- Real Permittivity (?′): The real permittivity typically decreases as frequency increases, eventually approaching the high-frequency permittivity (?∞). This decline indicates that at high frequencies, the material’s ability to store electrical energy diminishes, reflecting the reduced polarization response over time.
- Imaginary Permittivity (?′′): The imaginary permittivity exhibits a peak at an intermediate frequency, indicating the relaxation process. Beyond this peak, the imaginary part generally decreases. The peak corresponds to the relaxation frequency (fr?), where the material's polarization lags the electric field. This characteristic is essential for understanding energy loss mechanisms within the material.
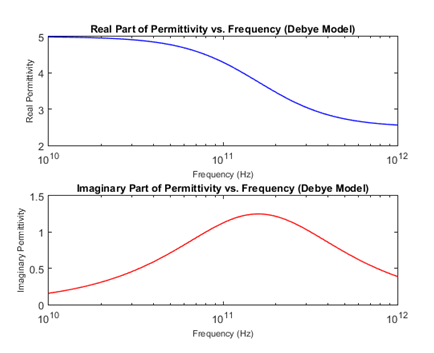
The graph encapsulates the essence of the Debye relaxation model, which effectively describes how materials with dielectric properties exhibit a characteristic response time (τ) to oscillating electric fields. The observed relationships are critical in terahertz spectroscopy, where understanding dielectric properties helps in characterizing materials, assessing their insulation capabilities, and exploring their suitability for various applications.
Further, the graph provides valuable insights into the frequency-dependent dielectric behavior of materials as described by the Debye model. The distinct patterns of the real and imaginary parts of permittivity emphasize the complex interplay between material properties and applied electric fields, essential for advancements in terahertz wave spectroscopy.
Conclusion
This paper presents a comprehensive study on detecting the dielectric properties of typical electrical insulating materials using terahertz wave spectroscopy. The research aimed to investigate the dielectric behavior of five common insulating materials - PTFE, PE, PP, Glass, and Ceramic - in the terahertz frequency range (0.1-10 THz). The results show that each material exhibits unique dielectric properties, characterized by their dielectric constant (?\') and dielectric loss tangent (tan ?). PTFE displays a high ?\' (2.5) and low tan ? (0.1), indicating excellent insulating properties. In contrast, PE and PP exhibit lower ?\' (1.5-2) and higher tan ? (0.2-0.5), revealing relatively poorer insulating properties. Glass and Ceramic show high ?\' (5-6) and low tan ? (0.1),indicating good insulating properties. The study uses terahertz wave spectroscopy to investigate the dielectric properties of common electrical insulating materials like PTFE, PE, PP, Glass, and Ceramic. The research aims to understand how these materials behave in the terahertz frequency range, crucial for various applications in electrical and electronic systems.
References
[1] Afsar, M.N., J.R. Birch, R.N. Clarke and G.W. Chantry. 1986.The measurement of the properties of materials. IEEE Transactions of Instrumentation and Measurement 74(1):183-199. [2] Altschuler, H.M. 1963. Dielectric constant. In Handbook of Microwave Measurements, eds. M. Sucher and J. Fox, 530-,536. New York, NY: Brooklyn Polytechnic Press. [3] Jorgensen, J.L., A.R. Edison, S.O. Nelson, and L.E. Stetson.1970. A bridge method for dielectric measurements of grainand seed in the 50- to 250- MHz range. Transactions ofASAE 13(1):18-20, 24. [4] Keam, R.B. 1997. Loadsnoop: A new tool for magnetron matching. Newsletter of Association for Microwave Power in Europe for Research and Education (AMPERE),Auckland, New Zealand: Keam Holdem Associates, AMPERE Europe Limited. [5] Keam, R.B. 1998. Input admittance of a coaxial-line driven cylindrical cavity with a centre dielectric rod. IEEE Microwave and Guided Wave Letters 8(2): 49-51. [6] Keam, R.B. and J.R. Holdem. 1997a. Permittivity measurement using a coaxial-line conical tip probe. IEEE Electronics Letter 33(5): 353-35. [7] ASTM. 2001. Standard test methods for complex permittivity (dielectric constant) of solid electrical insulating materials at microwave frequencies and temperatures to 1650°C. Method B (resonant cavities), Designation D, 2520-2601. [8] Bengtsson, N.E. and P.O. Risman.1971. Dielectric properties of food at 3 GHz as determined by a cavity perturbation technique. II. Measurements on food materials. Journal of Microwave Power 6(2):107-123. [9] Blackham, D.V. and R.D. Pollard. 1997. An improved technique for permittivity measurements using a coaxial probe. IEEE Transactions of Instrumentation and Measurement 46(5):1093-1099. [10] Brown, G.H., C.N. Hoyler and R.A. Bierworth. 1947. Theory and Applications of Radio Frequency Heating. New York, NY: Van Nostrand Company Inc. [11] Buffler, C.R. 1993. Microwave Cooking and Processing. New York, NY: Van Nostrand Reinhold. [12] Burdette, E.C., F.L. Cain and J. Seals. 1982. In-itu tissue permittivity at microwave frequencies: Perspective, techniques, results. Research publications. Atlanta, GA: Biomedical Research Branch, Electronics Technology Laboratory, Engineering Experiment Station, Georgia Institute of Technology. [13] Bussey, H.E. 1967. Measurement of RF properties of materials -A survey. Proceedings of IEEE Conference 55(6):1046-1053. [14] Corcoran, P.T., S.O. Nelson, L.E. Stetson and C.W. Schlaphoff. 1970. Determining dielectric properties of grain and seed in the audio frequency range. Transactions of the ASAE 13(3): 348-351. [15] Debye, P. 1929. Polar Molecules. New York, NY: The Chemical Catalog Company.
Copyright
Copyright © 2024 M K Maurya, Pramila Yadav, Sangeeta Pandey. This is an open access article distributed under the Creative Commons Attribution License, which permits unrestricted use, distribution, and reproduction in any medium, provided the original work is properly cited.

Download Paper
Paper Id : IJRASET63973
Publish Date : 2024-08-14
ISSN : 2321-9653
Publisher Name : IJRASET
DOI Link : Click Here
 Submit Paper Online

