Ijraset Journal For Research in Applied Science and Engineering Technology
- Home / Ijraset
- On This Page
- Abstract
- Introduction
- Conclusion
- References
- Copyright
Dielectric Studies of Soil at Various Microwave Frequencies
Authors: Kamlesh Kumari, Vishu , V. K. Gupta
DOI Link: https://doi.org/10.22214/ijraset.2024.64957
Certificate: View Certificate
Abstract
Dielectric constant (real and imaginary parts) of moist soils is calculated at microwave frequency with an empirical model. The model equation is generated by curve fitting experimental data with second order polynomial expression. Two types of sandy loam samples are used to estimation of dielectric constant at frequencies range from 4.0 GHz to 18.0 GHZ. Both soil samples (sandy loam) are differentiated according to their textural composition. The real part of dielectric constant is negatively corelated with microwave frequency while imaginary parts of soil increase as frequency increases.
Introduction
I. INTRODUCTION
When dielectric materials are placed under the action of AC fields their response to microwaves generally depends on the frequency of the applied field. The polarization of dielectric material varies with frequency of the applied electric field. This frequency dependence reflects the fact that polarization of materials does not respond instantaneously to an applied field. The response must always be causal (arising after the applied field) which can be represented by a phase difference. Thus, the permittivity is often treated as a complex function of the angular frequency of the applied field because complex numbers allow specification of mmagnitude and phase. Thus, permittivity consists of both the real and imaginary parts. The electric field results are different for different types of polarization (electronic, deformation and orientation). For orientation polarization there is no counteractive restoring force. Therefore, it does not give rise to a resonance at a critical frequency, while both electronic and distortion polarization are subject to a counter-active restoring force, which gives rise to a resonant frequency. At lower frequencies, the three polarization phenomena contribute to the real part of the dielectric constant. As frequency of polarizing field increases orientation polarization lags behind the polarizing field. The characteristic response of the different polarization phenomena to the electric field results in a frequency dependence which has not only an impact on the real part of the dielectric constant, but the imaginary part is related to the counteractive restoring forces in case of electronic and distortion polarization.
The dielectric studies of soil as a mixture at different frequencies is very useful for understanding the dependence of the permittivity on the water content, soil texture, soil bulk density, frequency of measurement, temperature, salinity, particle shape and size and particle distribution. The soils can be classified according to the particle-size or texture of the mineral solids. The soil particles are divided into different ranges on the basis of their sizes called soil separates (sand, silt and clay). The mineral particles of soils usually ranging from 0.002 mm to 2.0 mm in diameter as shown in Table-1. The relative proportions of sand, silt and clay determines the soil texture.
Table-1: Classification of soil particles as a function of diameter (millimeters).
|
S N |
Soil Separates |
Size range (mm) |
||||
|
1 |
Clay |
< 0.002 |
|
|||
|
2 |
Silt |
0.05 - 0.002 |
||||
|
3 |
Very fine sand |
0.10-0.05 |
|
|||
|
4 |
Fine Sand |
0.25-0.10 |
|
|||
|
5 |
Medium Sand |
0.50-0.25 |
|
|||
|
6 |
coarse Sand |
1.00-0.50 |
|
|||
Many studies have been carried out regarding dielectric study of soil at different microwave frequencies [1-5]. Hoekstra and Delaney [1] studied dielectric properties of soils at UHF and microwave frequencies. The study of Dobson et al [2] over the frequency range varying from 1.0 to 18.0 GHz gives the dielectric constant as a function of soil temperature, soil moisture content, soil texture and observation frequency. While studying the effect of soil texture on dielectric behaviour of soils at microwave frequencies Hallikainen et al [3] formulated the model that relates the real and imaginary parts of complex permittivity with the volumetric soil moisture content (SMC) and texture.
The important Model proposed by Peplinski et al [4] is a variant of the earlier model of Dobson et al [2]. This is commonly used dielectric mixing model of soil which includes the lower range of frequency (0.3GHz-1.4 GHz) and accounted for the important parameters of soil, including bulk density, soil texture and soil temperature. Further, the dielectric constant of wet soil is strongly related to texture is explained by Boyarskii et al [5]. The sand, silt and clay are considered as spherical inclusions of particles in aerial medium. The bound water is present only in the shape of films around the clay particles and when water films cover entire soil particles it is considered as free water.
Recently, Calla et al [6] generated CVCG model for the estimation of dielectric constant at X band microwave frequencies using only the percentage values of sand, silt and clay in the soil. They have experimentally determined the dielectric constant of different samples of soils of Rajasthan at X band microwave frequencies. Using experimental results, Calla et al [6] have generated CVCG model given by the following equation (1).
 (1) Here the constants a, b and c are function of frequency of microwaves.
II. METHODOLOGY
Textural composition of two soil samples selected for estimation of dielectric constant are given in below table:2
Table:2- Textural composition of two soil samples
|
Sample:1 |
Sample:2 |
|
Sand = 51.51% Sil t= 35.06% Clay = 13.43% |
Sand = 41.96% Silt = 49.51% Clay = 8.53% |
In our present investigation we are emphasizing that real and imaginary parts of dielectric constant of soil depends upon the frequency and the texture of the soil. The empirical model proposed by Hallikainen et al [3] relates the real and imaginary parts of complex permittivity with the volumetric soil moisture content (SMC) and texture at various microwave frequencies (frequencies 1.4, 2.5, 4.0, 6.0, 8.0 and 10.0, GHz). According to this model real and imaginary parts of dielectric constant of soil can be determined with textural components (sand and clay) of soil in terms of percentage weight, volumetric moisture content and empirically determined coefficients. The model equation generated by curve fitting experimental data with second order polynomial expression was given by equation (2) as:

 (2)
(2)
Where S is percentage of sand and C is percentage of clay,  is the volumetric moisture content of the soil and
  ,
, ,
,  ,
,  ,
,  ,
,  ,
,  ,
,  , and
, and  are the empirically determined coefficients for the best fit. The empirical model of Hallikainen et al [3] accounts for frequency and soil texture. The equation (2) is applicable to dielectric data collected at frequencies 1.4, 6, 8, 10, 12, 14, 16 and 18 GHz, depending on the values of the parameters used. The values of empirical coefficients
 ,
, ,
,  ,
,  ,
,  ,
,  ,
,  ,
,  , and
, and  for determination of
  and
and  at frequencies 1.4, 2.5, 4.0, 6.0, 8.0 and 10.0, GHz are given in Table:3 and Table:4.
Table:3 Hallikainen coefficients ,
, ,
,  ,
,  ,
,  ,
,  ,
,  ,
,  and
and  for determination of
|
Freq. (GHz) |
a0 |
a1 |
a2 |
b0 |
b1 |
b2 |
c0 |
c1 |
c2 |
|
1.4 |
2.862 |
-0.012 |
0.001 |
3.803 |
0.462 |
-0.341 |
119.006 |
-0.5 |
0.633 |
|
4 |
2.927 |
-0.012 |
-0.001 |
5.505 |
0.371 |
0.062 |
114.856 |
-0.389 |
-0.547 |
|
6 |
1.993 |
0.002 |
0.015 |
38.086 |
-0.176 |
-0.633 |
10.72 |
1.256 |
1.522 |
|
8 |
1.997 |
0.002 |
0.018 |
25.579 |
-0.017 |
-0.412 |
39.793 |
0.723 |
0.941 |
|
10 |
2.502 |
-0.003 |
-0.003 |
10.101 |
0.221 |
-0.004 |
77.482 |
-0.061 |
-0.135 |
|
12 |
2.2 |
-0.001 |
0.012 |
26.473 |
0.013 |
-0.523 |
34.333 |
0.284 |
1.062 |
|
14 |
2.301 |
0.001 |
0.009 |
17.918 |
0.084 |
-0.282 |
50.149 |
0.012 |
0.387 |
|
16 |
2.237 |
0.002 |
0.009 |
15.505 |
0.076 |
-0.217 |
48.26 |
0.168 |
0.289 |
|
18 |
1.912 |
0.007 |
0.021 |
29.123 |
-0.19 |
-0.545 |
6.96 |
0.822 |
1.195 |
Table:4 Hallikainen coefficients ,
, ,
,  ,
,  ,
,  ,
,  ,
,  ,
,  and
and  for determination of
|
Freq (GHz) |
a0 |
a1 |
a2 |
b0 |
b1 |
b2 |
c0 |
c1 |
c2 |
|
1.4 |
0.356 |
-0.003 |
-0.008 |
5.507 |
0.044 |
-0.002 |
17.753 |
-0.313 |
0.206 |
|
4 |
0.004 |
0.001 |
0.002 |
0.951 |
0.005 |
-0.01 |
16.759 |
0.192 |
0.29 |
|
6 |
-0.123 |
0.002 |
0.003 |
7.502 |
-0.058 |
-0.116 |
2.942 |
0.452 |
0.543 |
|
8 |
-0.201 |
0.003 |
0.003 |
11.266 |
-0.085 |
-0.155 |
0.194 |
0.584 |
0.581 |
|
10 |
-0.07 |
0 |
0.001 |
6.62 |
0.015 |
-0.081 |
21.578 |
0.293 |
0.332 |
|
12 |
-0.142 |
0.001 |
0.003 |
11.868 |
-0.059 |
-0.225 |
7.817 |
0.57 |
0.801 |
|
14 |
-0.096 |
0.001 |
0.002 |
8.583 |
-0.005 |
-0.153 |
28.707 |
0.297 |
0.357 |
|
16 |
-0.027 |
-0.001 |
0.003 |
6.179 |
0.074 |
-0.086 |
35.126 |
0.143 |
0.206 |
|
18 |
-0.071 |
0 |
0.003 |
6.938 |
0.029 |
-0.128 |
29.945 |
0.275 |
0.377 |
.
III. RESULTS AND DISCUSSION
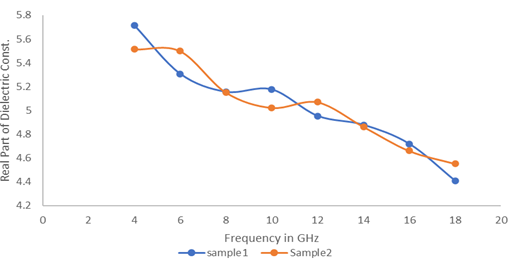
The variation of Hallikainen model values of ε’ for two soil samples (varies in textural composition) at volumetric SMC levels (10.0%) with respect to frequency (4, 6, 8, 10, 12, 14, 16 and 18 GHz) are shown in figures: 1. It is evident from figure that ε’ of soil decreases with the increasing frequency. This decrease is due to the reduction of space charge polarization effect. since the polarization mechanisms become less effective with the increase in frequency. Further, both curves are closely space so that hardly, any effect of texture is observed on the values of ε’ in a comparison of these two samples.

Figures-1: Variation of Hallikainen model values of ε’ w.r.t. frequency of microwave
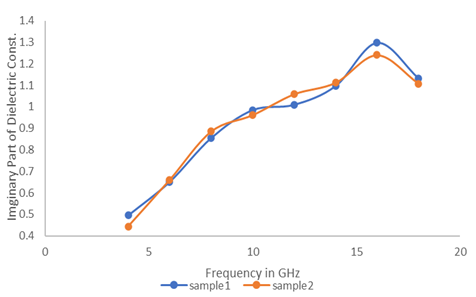
The variation of Hallikainen model values of imaginary part of the dielectric constant (ε”) for two soil samples (varies in textural composition) at volumetric SMC levels (10.0%) with respect to frequency (4, 6, 8, 10, 12, 14, 16 and 18 GHz) and are shown in figures;2. It is evident from these figures that ε” of soil increase with the increasing frequency. At high frequencies, the imaginary part of the dielectric constant has high values, causing the material to absorb energy from the field.

Figures-2: Variation of Hallikainen model values of ε” w.r.t. frequency of microwave
Conclusion
The real dielectric part of the dielectric constant (??) is typically frequency-dependent, with a higher value at lower frequencies and a lower value at higher frequencies. The real part of dielectric constant (??) decreased with the increase in frequency. This decrease is due to the reduction of space charge polarization effect. The imaginary part of dielectric constant (?”) is also very much dependent on frequencies. This is because molecules have more time to align and polarize at lower frequencies while at higher frequencies, they do not have enough time to align and polarize. Polarization doesn\'t always follow an electric field exactly because it takes time to occur at higher frequencies. As the frequency increases the time lag between polarization and electric field increases and the imaginary part of dielectric constant increase with frequencies.
References
[1] Hoekstra P and Delaney A, “Dielectric properties of soils at UHF and microwave frequencies” J of Geophysical Res 79 (1974) 1699 - 1708. [2] Dobson, M C, Ulaby F T, Hallikainen M T and El-Rayes M A , “Microwave dielectric behavior of wet soil- II, Dielectric mixing models” IEEE Trans. Geoscience and Remote Sensing, GE-23(1985) 35-46. [3] Hallikainen M T, Ulaby F T, Dobson M C, El-rayes M A and Lin-Kun Wu, “Microwave dielectric behaviour of wet soil- Part 1: Empirical models and experimental observations” IEEE Trans. Geosciences & Remote Sensing GE-23(1) (1985) 25–34. [4] Peplinski N R, Ulaby F T, and Dobson M C, “Dielectric properties of soils in the 0.3-1.3GHz range” IEEE Trans Geosci. Remote Sens 33(1995) 803-807. [5] Boyarskii D A ,Tikhonov V V and Komarova N. Yu.” Model of dielectric constant of bound water in soil for applications of microwave remote sensing” Progress In Electromagnetics Research, PIER 35(2002) 251–269. [6] Calla O P N, Baruah A, Das B, Mishra K P, Kalita M and Haque S S, “Variability of dielectric constant of dry soil with its physical constituents at microwave frequencies and validation of the CVCG mode” Indian J Radio & Space Phys 33(2004) 125-129.
Copyright
Copyright © 2024 Kamlesh Kumari, Vishu , V. K. Gupta. This is an open access article distributed under the Creative Commons Attribution License, which permits unrestricted use, distribution, and reproduction in any medium, provided the original work is properly cited.

Download Paper
Paper Id : IJRASET64957
Publish Date : 2024-11-03
ISSN : 2321-9653
Publisher Name : IJRASET
DOI Link : Click Here
 Submit Paper Online

