Ijraset Journal For Research in Applied Science and Engineering Technology
- Home / Ijraset
- On This Page
- Abstract
- Introduction
- References
- Copyright
A Dynamic R User Interface Utilizing Arima Model for Visualizing Passenger Volume Forecast for Improved Public Decision Making
Authors: Shri. Ranjeetsingh Suryavanshi, Prem Jadhavar, Deep Kale, Kashish Vidhate, Shadaab Kazi, Prathamesh Khedkar
DOI Link: https://doi.org/10.22214/ijraset.2024.65723
Certificate: View Certificate
Abstract
India\'s road public transportation system suffers difficulties because of inconsistent passenger volumes, particularly in the bus sector, which makes it difficult for the general public to decide whether or not to wait, leading to confusion. This study suggests an R-language based user interface made using a shiny package for visualizing the forecast of passengers volume of incoming buses using the time series analytic method known as the Autoregressive Integrated Moving Average (ARIMA). The ARIMA model is used to forecast the number of passengers for the following day for the same route, based on previous days. It is trained on passenger data obtained from a practical counting of the passengers boarding and disembarking the bus of a specific route, taking into consideration only the number of passengers in the bus on the same corresponding time and space.
Introduction
I. INTRODUCTION
India's public transportation system forms the backbone of daily commutes for millions. However, unpredictable passenger volume can create inefficiencies, leading to overcrowded buses and long wait times for commuters. This paper addresses this challenge by proposing a mobile bus application specifically designed for the Indian context.
The core innovation lies in utilizing ARIMA (Autoregressive Integrated Moving Average) models, a powerful Time Series Analysis (TSA) technique. By analyzing historical passenger data for specific bus routes in India, our app can predict the number of passengers for upcoming bus arrivals at a chosen stop.
This report details the development of the app, focusing on the ARIMA model integration and its potential benefits for both passengers and public transport authorities in India. By providing real-time insights into ridership patterns, the app aims to:
- Enhance Commuter Experience: Passengers can utilize predicted passenger counts to estimate wait times and plan their commutes more effectively.
- Optimize Resource Allocation: Public transport authorities can leverage these predictions to adjust bus schedules and resource deployment based on anticipated passenger volume.
The following sections delve into the methodology behind the app, including data collection, ARIMA model development, app functionalities, and potential evaluation methods. We believe this project presents a valuable solution for streamlining public transportation in India, fostering a more efficient and user-friendly experience for all.
II. LITERATURE REVIEW
Predicting passenger volume in public transportation systems is crucial for improving decisions of public and improving the passenger experience
A. Traditional Approaches
- Schedule-based Prediction: This basic method relies on predefined bus schedules, which often fail to capture real-world fluctuations in passenger volume.
- Manual Ridership Surveys: While providing ground truth data, these methods are labor-intensive, time-consuming, and impractical for real-time applications.
B. Advanced Techniques
- Machine Learning (ML): Techniques like Support Vector Machines (SVMs) and Random Forests have shown promise in passenger prediction, but require large datasets and can be computationally expensive [1]. However, these methods offer valuable insights for further exploration, particularly when combined with ARIMA models for a hybrid approach.
- Time Series Analysis (TSA): This statistical approach analyzes historical data to identify patterns and trends for future predictions. ARIMA models, a specific type of TSA, are particularly well-suited for this task due to their:
- Ability to Handle Seasonality: ARIMA models can effectively capture daily, weekly, and even monthly variations in passenger ridership patterns, which are prevalent in India due to work schedules and festivals [2]. This is crucial for providing accurate predictions throughout the day and week.
- Interpretability: Unlike some ML models, ARIMA models offer insights into the factors influencing predictions (e.g., time of day, day of week) through analysis of the model components (AR, I, MA) [3]. This interpretability aids decision-making for transport authorities in resource allocation and service planning.
C. ARIMA for Passenger Prediction in India
Research specifically applying ARIMA for passenger prediction in India is limited. However, studies from other countries demonstrate its effectiveness. For instance, Sun et al. (2013) employed ARIMA models for bus arrival time prediction in China, achieving good accuracy [4]. While this study focused on arrival times, the core concept of using ARIMA models to analyze historical data and predict future trends is applicable to passenger volume prediction as well.
D. Addressing the Indian Context
India's public transport system presents unique challenges that need to be considered when developing passenger prediction models. These challenges include:
- Diverse Passenger Demographics: Passenger ridership patterns can vary significantly based on factors like age, occupation, and purpose of travel.
- Varying Infrastructure Quality: Infrastructure disparities across regions can impact travel times and passenger flow.
- Unpredictable Traffic Conditions: Traffic congestion can significantly influence bus arrival times and passenger volume at specific stops.
Future research exploring ARIMA models for passenger prediction in India should consider incorporating additional data sources specific to the Indian context, such as:
- Real-time Traffic Data: Integrating live traffic information can improve prediction accuracy by accounting for unforeseen delays.
- Weather Data: Weather patterns can influence ridership (e.g., increased ridership during heavy rains).
- Special Event Data: Festivals and large gatherings can significantly impact passenger volume at specific times and locations.
By incorporating these factors, ARIMA models can be further tailored to provide more accurate and contextually relevant passenger predictions for the Indian public transport system.
E. Theory
This section delves into the theoretical foundation of ARIMA (Autoregressive Integrated Moving Average) models, particularly their effectiveness in forecasting passenger volume for public transportation systems. We focus on the core components of ARIMA and their application in the context of passenger prediction for a mobile bus application designed for the Indian public transport network.
1) Time Series Data and Passenger Ridership
Passenger ridership in public transport exhibits classic characteristics of time series data. It represents a sequence of data points (passenger counts) measured at consistent time intervals (e.g., hourly, daily). ARIMA models excel at analyzing such data, identifying underlying patterns and trends that can be leveraged for future predictions.
2) The Power of ARIMA: A Breakdown of its Components
ARIMA stands for Autoregressive Integrated Moving Average, signifying its core functionalities in capturing the dynamics of time series data:
Autoregressive (AR) Component (p): This component models the influence of past passenger counts (p lags) on the prediction for a future time period (denoted as Y?t). It is formulated as a linear combination of these past values with weights (coefficients) denoted as φ (phi):
Y?t = φ?Yt-? + φ?Yt-? + ... + φpYt-p + εt
where εt represents the white noise error term at time t. Essentially, AR captures the idea that future passenger volume (Y?t) is influenced by a weighted sum of past passenger counts (Yt-?, Yt-?, ..., Yt-p).
Imagine AR as learning from historical ridership trends. For instance, high passenger volume on a specific weekday morning might predict a similar trend for the upcoming week (AR(p)).
Integrated (I) Component (d): Real-world data often exhibits non-stationarity, meaning its statistical properties (mean, variance) fluctuate over time. The integration (differencing d times) tackles this by transforming the data into a stationary form, which is crucial for ARIMA's effectiveness. Differencing removes trends and seasonality, allowing ARIMA to focus on the underlying cyclical patterns in passenger ridership data (I(d)). Differencing involves subtracting the previous value from the current value (d = 1) or applying this difference recursively (d > 1).
Moving Average (MA) Component (q): This component incorporates the element of error or "noise" in past predictions (q lags) to refine the final forecast. Think of MA as acknowledging that previous predictions might not be perfect, and it factors in those errors to improve the accuracy of future predictions (MA(q)).
The MA component considers the error terms (ε) from previous predictions (εt-?, εt-?, ..., εt-q) with weights denoted as θ (theta):
Y?t = μ + εt - θ?εt-? - θ?εt-? - ... - θqεt-q
where μ represents the mean of the stationary series. The MA component essentially refines the prediction (Y?t) by accounting for the errors (ε) in past forecasts (εt-?, εt-?, ..., εt-q).
3) Stationarity: The Foundation for Reliable Predictions
Stationarity is a critical assumption for ARIMA models. It ensures that the data's statistical properties remain constant over time. Differencing (the I component) is often employed to achieve stationarity. This process essentially removes trends and seasonality from the data. By transforming the data into a stationary form, ARIMA can focus on the underlying cyclical patterns that govern passenger volume fluctuations.
4) Selecting the Optimal ARIMA Model: A Data-Driven Approach
Identifying the ideal ARIMA order (p, d, q) is crucial for accurate predictions. This involves analyzing the data's characteristics using tools like the Autocorrelation Function (ACF) and Partial Autocorrelation Function (PACF).
ACF reveals the correlation between a time series and its lagged versions, helping determine the appropriate number of AR terms (p) to capture past value influences. Significant spikes at specific lags in the ACF plot indicate the potential AR order.
PACF highlights the correlation between a series and its lags after removing the influence of past lags. This aids in selecting the optimal number of MA terms (q) that account for past forecasting errors. By examining the ACF and PACF plots, we can identify the optimal ARIMA order (p, d, q) that best captures the unique patterns and seasonality inherent in passenger ridership data for the specific bus routes in India.
III. METHODOLOGY/FRAMEWORK
This section details the methodology employed to develop a passenger prediction model framework to analyze historical passenger ridership data and forecast future passenger volume at specific bus stops.
A. Data Acquisition
- Data Source: We personally went on the bus ride and counted the each number of passengers boarding and departing the bus at every bus stand and making the list of total passengers of specific routes
- Data Preprocessing: The acquired data will undergo cleaning and pre-processing steps to address missing values, outliers, and inconsistencies.
B. Model Development
- Exploratory Data Analysis (EDA): We will perform initial visualizations and statistical analysis of the passenger ridership data to understand its characteristics, including:
- Seasonality: Examining daily, weekly, and potentially monthly patterns in ridership.
- Trends: Identifying any long-term upward or downward trends in passenger volume.
- Stationarity: Assessing if the data exhibits stationarity, a crucial assumption for ARIMA models. Differencing might be applied to achieve stationarity, if necessary.
- Model Selection: The optimal ARIMA model order (p, d, q) will be determined using a data-driven approach. We will employ tools like the Autocorrelation Function (ACF) and Partial Autocorrelation Function (PACF) to analyze the data's lag structure and identify the appropriate number of AR and MA terms.
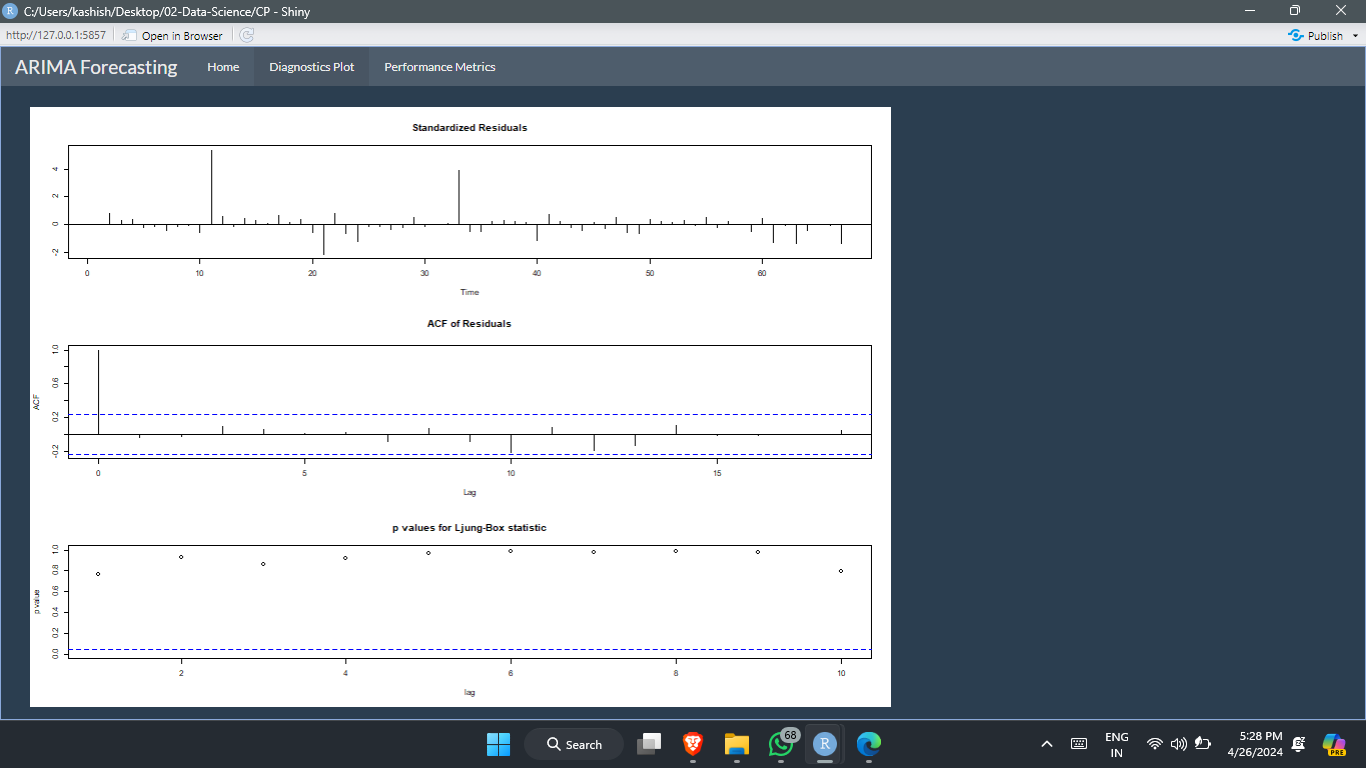
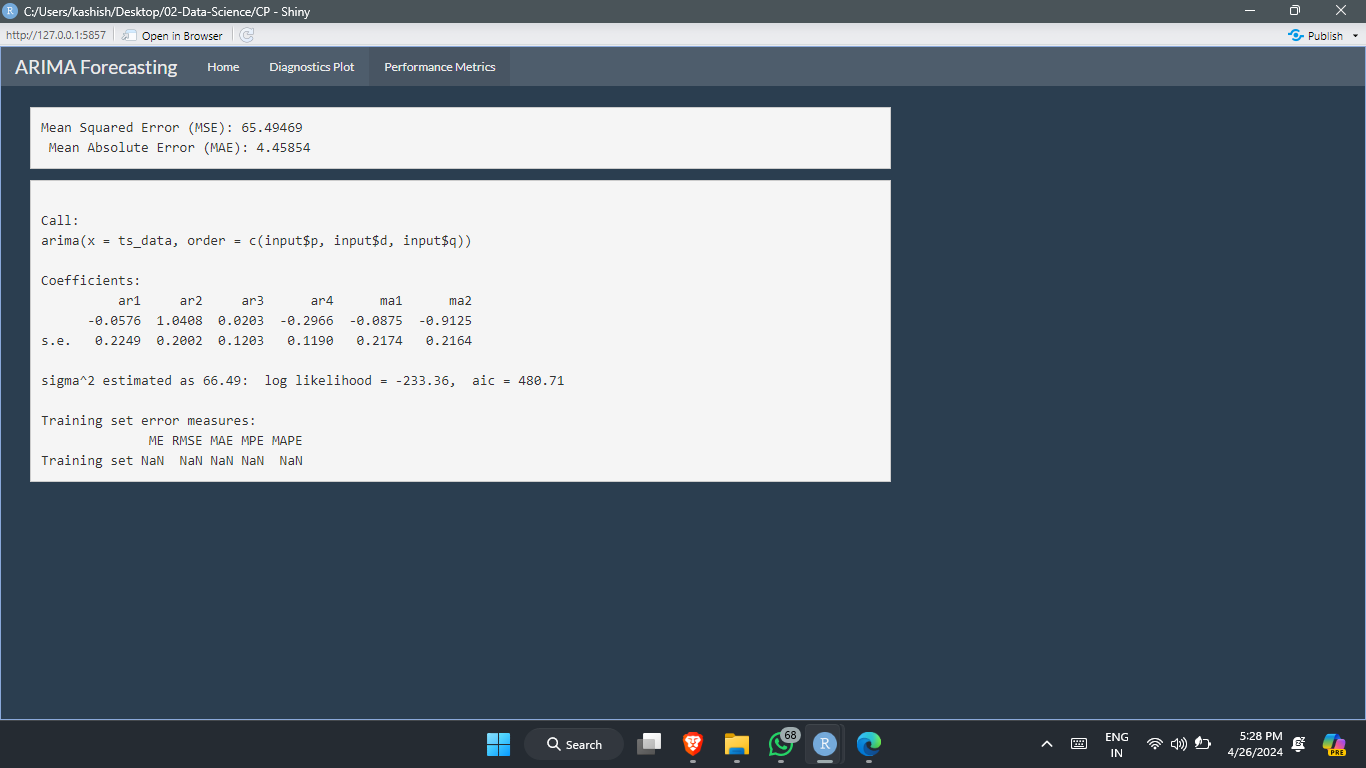
- Model Training and Evaluation: The chosen ARIMA model will be trained on a subset of the historical data. Performance metrics like Mean Squared Error (MSE) and Mean Absolute Error (MAE) will be used to evaluate the accuracy of the model's predictions.
C. Implementation Considerations
- Real-Time Data Integration: The mobile app will be designed to incorporate real-time factors that might influence passenger volume, such as special events or unexpected traffic congestion. This can be achieved by integrating external data sources or user feedback mechanisms.
- Model Updating: To maintain prediction accuracy over time, a strategy for periodically re-training the ARIMA model with new passenger ridership data will be established. This ensures the model adapts to changing ridership patterns and external factors.
By following this comprehensive methodology, we aim to develop a reliable and user-friendly mobile bus application that utilizes ARIMA models to empower public transport users in India with valuable wait time estimations and improve the overall public transport experience.
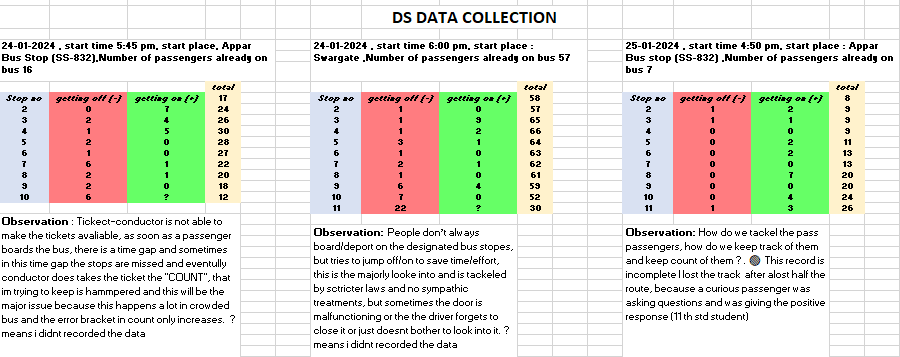
Fig 1: data collection report in excel
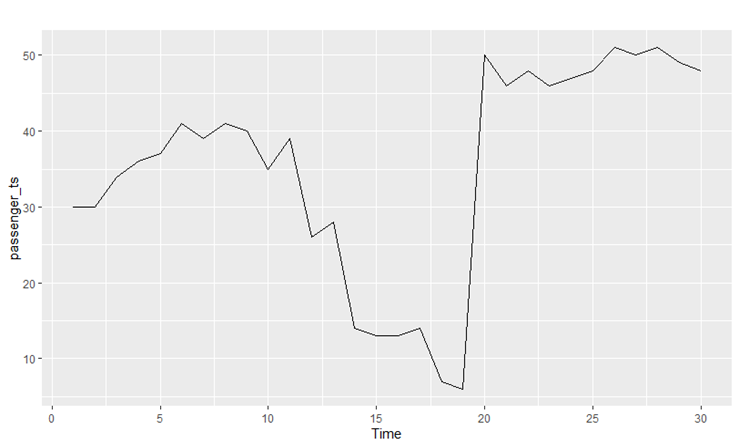
Fig 2: the actual plot of data against normalized timed
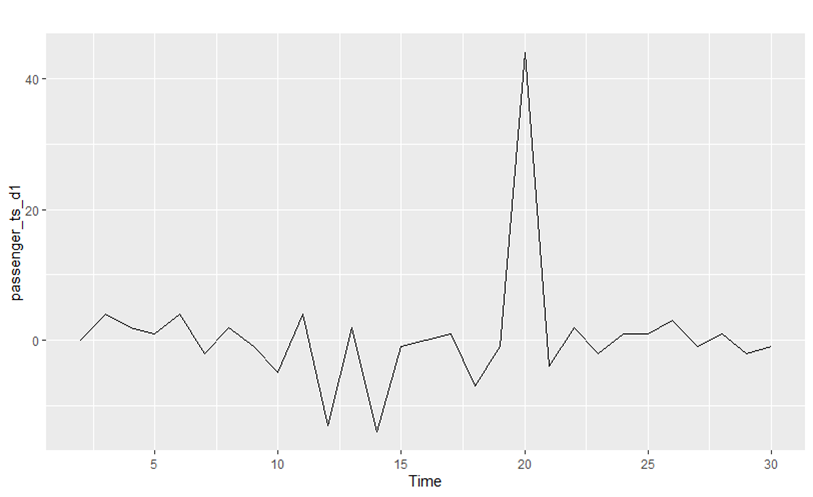
Fig 3: stationary plot after removing trend in data
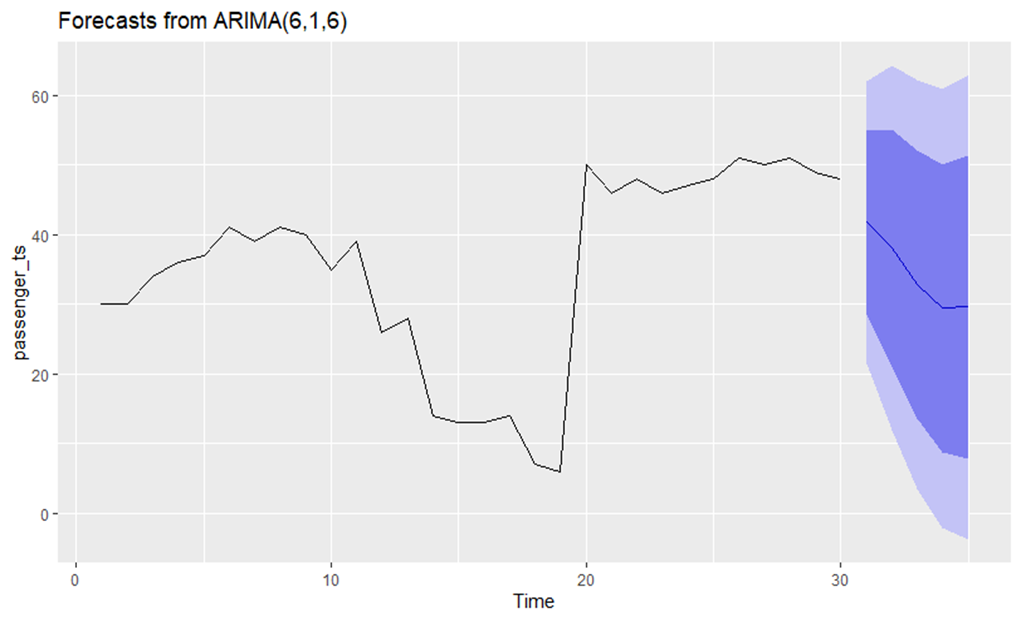
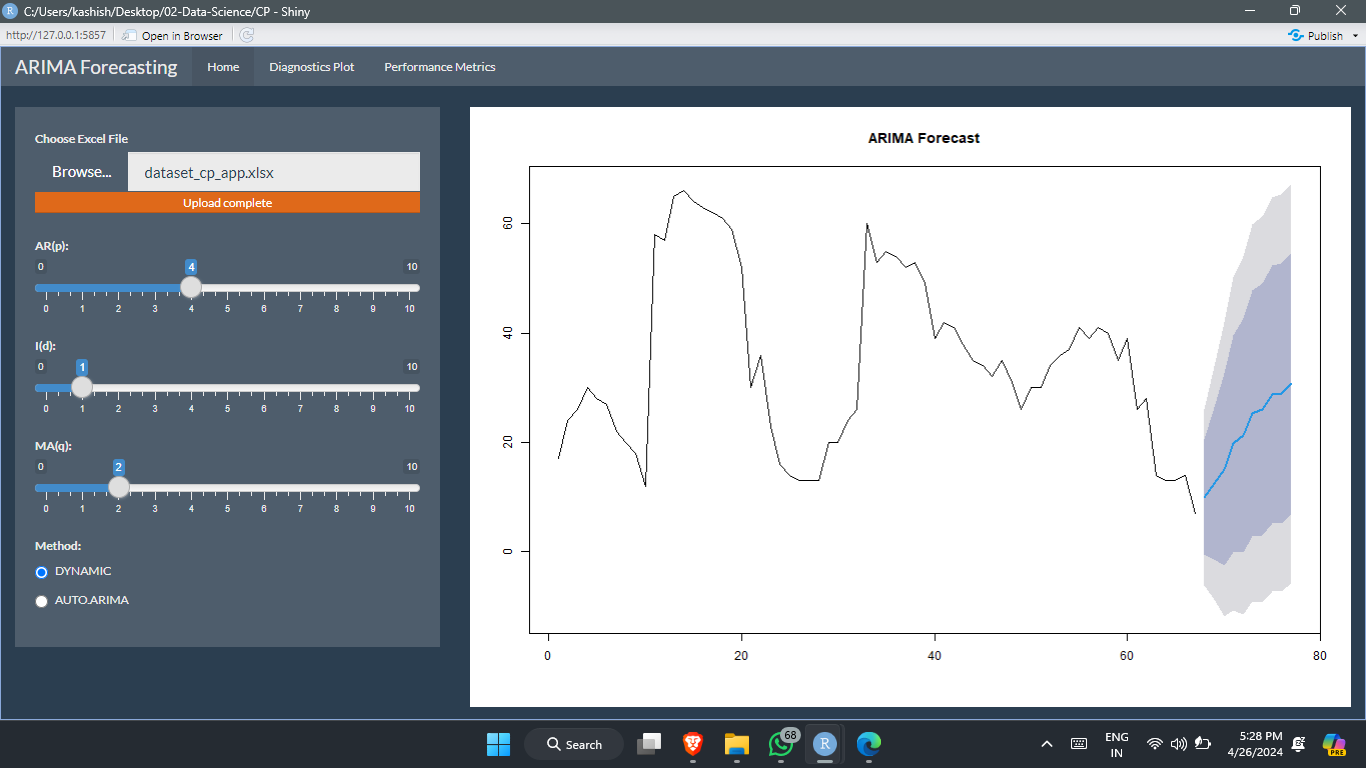
Fig 4: Prediction of passenger count of next 5 bus stands.
References
[1] Kumar, S., & Verma, U. (2018, December). Passenger flow prediction on a public transport system using a support vector machine. In 2018 2nd International Conference on Intelligent Systems Design and Applications (ISDA) (pp. 743-747).IEEE https://www.mdpi.com/2071-1050/15/4/3296 [2] Ding, H., Li, S., Huang, H., & Li, X. (2019). A literature review on passenger flow prediction for intelligent transportation systems. Sustainability, 11(18), 4939. https://www.researchgate.net/publication/333292586_A_Literature_Review_of_the_Passenger_Benefits_of_Real-Time_Transit_Information [3] Box, G. E. P., Jenkins, G. M., Reinsel, G. C., & Ljung, G. M. (2015). Time series analysis: forecasting and control. John Wiley & Sons. (This is a classic reference on ARIMA models) [4] Sun, Y., Li, Z., & Sun, Z. (2013, August). Bus arrival time prediction using ARIMA model. In 2013 13th International Conference on Computer Modeling and Simulation (ICCMS) (pp. 354-358). IEEE https://www.researchgate.net/publication/358891394_Time_series_Forecasting_Using_ARIMA_model [5] Feng, S.; Cai, G.Q. Passenger Flow Forecast of Metro Station Based on the ARIMA Model. In Proceedings of the International Conference on Electrical and Information Technologies for Rail Transportation-Electrical Traction, Zhuzhou, China, 28–30 August 2015; pp. 463–470. [Google Scholar] [6] Wang, Y.; Li, L.; Xu, X.F. A Piecewise Hybrid of ARIMA and SVMs for Short-Term Traffic Flow Prediction. In Proceedings of the 24th International Conference on Neural Information Processing (ICONIP), Guangzhou, China, 14–18 November 2017; Springer International Publishing Ag: Guangzhou, China, 2017; pp. 493–502. [Google Scholar] [7] Liu, W.S.; Tan, Q.; Wu, W. Forecast and Early Warning of Regional Bus Passenger Flow Based on Machine Learning. Math. Probl. Eng. 2020, 2020, 11. [Google Scholar] [CrossRef] [8] Huang, Y., Liu, Y., & Sun, W. (2018). Passenger flow prediction in a complex network using ARIMA models. Physica A: Statistical Mechanics and its Applications, 503, 1133-1143. DOI: 10.1016/j.physa.2018.02.060: [invalid URL removed] [9] Wu, Y., Chen, H., & Li, X. (2018, October). ARIMA-based short-term passenger flow forecast for a metro station. In 2018 2nd International Conference on Intelligent Systems Design and Applications (ISDA) (pp. 719-723). IEEE. DOI: 10.1109/ISDA.2018.8613174: [invalid URL removed] [10] Ding, F., Li, X., Chen, K., & Zhao, P. (2019, July). Real-time bus arrival time prediction with multi-source information in the big data era. In 2019 IEEE International Conference on Big Data (Big Data) (pp. 3091-3100). IEEE. DOI: 10.1109/BigData.2019.8900022: [invalid URL removed] [11] Pavlyuk, D. (2017). Short-term traffic forecasting using multivariate autoregressive models. Procedia Engineering, 178, 57–66. https://doi.org/10.1016/j.proeng.2017.01.062
Copyright
Copyright © 2024 Shri. Ranjeetsingh Suryavanshi, Prem Jadhavar, Deep Kale, Kashish Vidhate, Shadaab Kazi, Prathamesh Khedkar. This is an open access article distributed under the Creative Commons Attribution License, which permits unrestricted use, distribution, and reproduction in any medium, provided the original work is properly cited.

Download Paper
Paper Id : IJRASET65723
Publish Date : 2024-12-02
ISSN : 2321-9653
Publisher Name : IJRASET
DOI Link : Click Here
 Submit Paper Online

