Ijraset Journal For Research in Applied Science and Engineering Technology
- Home / Ijraset
- On This Page
- Abstract
- Introduction
- Conclusion
- References
- Copyright
Deep Convolutional Neural Network Based for Early Recognition of Diabetic Retinopathy: A Comprehensive Review
Authors: Dr. S.V. Sonekar, Mr. Arya Bharne, Ms. Isha Mendhekar, Ms. Shruti Wasnik
DOI Link: https://doi.org/10.22214/ijraset.2025.66914
Certificate: View Certificate
Abstract
Diabetes-related retinopathy (DR), a common side effect of diabetes mellitus, creates lesions in the rear of the eye, impairing vision. If it is not diagnosed in time, it may cause paralysis. Unfortunately, there is currently no known cure for DR; the only option is avoidance. Early identification and management of DR are critical for rapidly minimizing the risk of visual loss. DR retina fundus images must be physically diagnosed by an ophthalmologist, that is more expensive, time-consuming, more error-prone then computer-aided diagnosis methods. Deep learning is now rising to become one of the favored methods for performance improvement, particularly in medical image categorization and decoding. Convolutional neural networks that are artificial are used to evaluate healthcare images since they are an effective learning tool. The most sophisticated approaches for categorizing and detecting DR color photographs of the fundus using deep learning algorithms were reviewed and analyzed to the purpose of this study. Additionally, the color of the fundus macular DR data was analyzed. Additionally, certain challenging situations requiring additional study are addressed
Introduction
I. INTRODUCTION
Diabetic retinopathy is the primary cause of visual loss among working-age persons in both industrialized and underdeveloped countries. People with diabetes are 25 times more likely to go blind than those without diabetes [1]. Diabetes can cause diabetic retinopathy in the retina. Early on, the condition is mostly asymptomatic, however if left untreated over an extended period of time, it can cause permanent vision loss. The problem is that patients may be unaware of it when they reach a more advanced stage. Once the disorder progresses, eyesight loss is unavoidable. It is urgently important since diabetes-related retinopathy was the third most common cause of hearing loss, particularly in India. It is essential to create quick diagnosis tools to treat this condition [2].
High blood sugar level cause the linings of tiny blood vessels to expand, resulting in the formation of microaneurysms. Micro-aneurysms will rupture as the illness worsens. This causes bleeding from the retina in either the outer or interior layers [3]. In addition to leaking blood, arteries also release lipids and proteins, which contribute to the formation of small. Diabetes Mellitus (DM) as an illness that can progress to diabetic retinal damage (DR). Human retina injury causes vision problems and blindness. According to statistics, DR impacts 80% of diabetics who endured the condition for fifteen to twenty years or more. Therefore, it continues to be a major risk to people's safety and health [4].
The disease can be manually identified, but this is difficult and time-consuming, necessitating a fresh method to treating DR. As a result, early identification and diagnosis are required to prevent DR from advancing to a severe stage and causing blindness. Academics from around the world have offered a variety of Machine Learning (ML) ways to do this. Several extracted feature techniques exist for the collecting of DR features for early detection. Traditional machine learning methods, on the other hand, either display poor generalization during the extraction and classification of features when used with smaller datasets or need extended training periods for poor forecasting results when used with larger datasets. Deep Learning (DL), a new branch of algorithmic learning, is thus introduced [4][5].
DL models can manage a smaller dataset using good data processing methods. Deep architecture, on the other hand, frequently uses larger datasets to improve the accuracy of extraction of features and picture categorization. This article presents a complete review of DR, including its features, root causes, modern deep learning models, issues, comparisons, and future techniques for DR early detection. [5].
II. LITERATURE SURVEY
There is currently a rising interest for creating computerized systems that test a great deal of people against diseases such as diabetic retinopathy, which can impair vision, and enable automatic detection of this condition. This literature review contains numerous examples of how digital imaging techniques have been used to identify diabetic retinopathy. Few studies have investigated retinal structures such as blood vessels, the optical disc, the fovea, and lesions such as microaneurysms, haemorrhages, other exudates. The following is a discussion of the important contributions contributed to the extraction of normal and diseased features from fundus images.
M. M. Fraza et al 2012, established a strategy for distinguishing exudates in the optic disc. Exudates on the retina or blood vessels have the same intensity level, thus they are completely eradicated before exudates are found. Thus, morphological operations such as dilatation and deterioration determine the existence and geographical distribution of exudates. Exudates associated with diabetic retinal degeneration can be seen in this segmented picture. This procedure often identifies the severity of the ailment while also confirming its existence. The support vector machines (SVM) classification is used to determine if an individual is mildly or severely afflicted by this condition.
A. Alaimahal et al. devised a computational approach in 2013 for extracting exudates, the primary indications of diabetic retinopathy, from retinal pictures. The process is generally divided into two sections. Excluding the removal of the optical a disk, morphological image processing approaches are utilized to identify exudates. The detected exudates are then categorized using the fuzzy logic approach. The fuzzy logic idea leverages values derived from retinal visual data in the RGB colouring space to create the fuzzy set. Normal, mild, and dense exudates are among the discharge types observed. Without changing any mathematical settings, this fully automated approach may be used to examine an archive of retina images.
Padmalal S ,et al 2014, underlined the importance of developing automated tools for detecting anomalies in fundus images. The fundus image's contrast was adjusted using a nonlinear curve based on the color saturated values (HSV) space using brightness values. Each red, green, and blue-bit image was gamma corrected to highlight the brown parts. The histograms for each red, blue, and blue-bit image were then expanded. Candidates of bleeding were subsequently determined. The brown areas were identified as haemorrhages, veins, or potential candidates employing density analysis. They disqualified the strongest contestants, such as blood vessels. Using a 45-feature analysis, false positives were eliminated. To assess the effectiveness of the new method in detecting haemorrhages, scientists evaluated 125 pictures of the fundus, 35 significant bleeding and 90 normal. The sensitivity for identifying anomalous instances.
Mahendran Gandhi et al 2013, developed a method for extracting properties from images of the fundus, including blood vessels, microaneurysms, or retinal exudates, by using morphological processing to detect anomalies. These features are employed to assess the severity of diabetic retinopathy. Following feature extraction, each characteristic's size is identified to determine the severity of the issue. Based on the results of feature area computation, a method is utilized to categorize the non-proliferative phases of diabetic retinal degeneration as normal, mild, or serious. In the normal stage, there's no discharges nor microaneurysms. Micro aneurysms are what characterizes the less severe stages of the condition. In this severe stage, several exudates and micro aneurysms are present.
Nimmy Thomas ,et al. 2014, developed a method of automatically detecting the existence & severity of diabetes-related macular edema (DME). In this area, the Hard Exudates (HE) are discovered and eradicated. An adjustable neurofuzzy inference classifier employs the derived qualities as input to determine whether the images are normal or abnormal. The parameters used to evaluate the effectiveness of ANFIS and ELM classifier are the degree of sensitivity, specificity, and accuracy. These variables have corresponding principles: 100%, 90%, and 96.49% for ANFIS, and 94.28%, 100%, and 96.49% for ELM.
Chisako Muramatsu, et al 2011, We created an automatic approach for detecting exudates from color fundus pictures using the Differential Morphological Profile (DMP). Exudates that and the optical disc stand out as bright patches in the DMP image. The genuine exudates are collected in the next stage, which includes feature extraction using the optic disc's position, shape index, or area. Applying the suggested approach on the DIARETDB1 dataset allows the method's performance to be evaluated. The proposed technique was evaluated in terms of specificity, sensitivity, overall positive predictive accuracy (PPV). The results reveal that the suggested strategy outperforms other standard approaches. It has been found that the suggested approach, which is the most sensitive, correctly identifies exudates. The specificity et NPV values were 99.99% and 98.23%, respectively.
Chandrashekar. M. Patil, et al. 2013, A computational morphology-based detection method for microaneurysms and hemorrhage has been proposed. The matching filter plus the morphological top-hat alteration method are used to identify red lesion candidates. To identify red and non-red lesion regions, 89 retinal pictures were randomly selected from three databases: STARE, DIARETDBO, and DIARETDBI. This approach achieved 100% sensitivity and 91% specificity.
A. Problem Statement
DR infection-associated diabetic retinal it (EDM) has recently been diagnosed in a substantial proportion of diabetics. The most lethal eye condition, retinopathy due to diabetes (DR), is caused by enlarged or fluid-leaking veins in the eyes. Furthermore, blood vessels can clog, preventing fluid from moving through and resulting in a typical abnormal proliferation of blood capillaries on the cornea. Finally, all of those alterations lead to blurred vision or possibly blindness [6].
Ophthalmic surgeons can treat or delay the development of retinal eye disease by detecting it early on. This protects patients without losing their vision. The eye's basic elements comprise the iris, cornea, retina, sclera, nerve fibers, and optic nerve. Diabetes patients are at risk of developing retinopathy, which is brought on by diabetes, cataracts, retinal artery and vein blockages, and other illnesses. DR infection has two unique clinical stages: the harmless and pre-final phase (NPDR) or the proliferating or final phase (PDR). NPDR refers to the first stage of diabetic fundus disease. Whenever there's NPDR, blood vessels leak, causing the retina to enlarge [6]. This is the most common cause for vision blur or occasional vision loss. The second stage in diabetic fundus disease is proliferative retinopathy (PDR), which is the most serious condition. It occurs when new blood vessels begin to emerge on the cornea. In this case, it is known as the creation of n. If somebody bleeds a little, they may notice some hazy floaters. If they bleed significantly, they risk losing their vision completely. The newly formed blood vessels in the ophthalmic system might cause tissue scarring. PDR can steal both central and peripheral vision. As a consequence, it is critical to discover DR as fast as possible. Manual identification of DR illness is a major task that is often conducted by ophthalmologists. Manual identification results are difficult to replicate and are prone to human error. The proposed framework has the capacity of extracting the area of concern and recognizing DR in the initial stages, assisting eye doctors within screening individuals and conducting clinical studies, reducing human errors and processing time, and enabling rapid and highly precise reproduction of the results whenever necessary [6][7].

Fig.1. Healthy human retina Fig. 2. Affected with DR
B. Objective
The main objective of this paper is to assess the benefits and drawbacks of the numerous earlier studies undertaken for early DR diagnosis.
- Early recognition of the many symptoms of retinal conditions.
- It will appropriately offer a solution at the outset for DR techniques such as feature extraction, division, object recognition, localization, and picture classification.
III. METHODOLOGY
Most extant DR classification systems proceed to extract exudate features and classify them. Image preprocessing is required in the initial phase to improve contrast while decreasing noise. The likely candidate of exudates is then depicted by segmenting and eliminating the image's white regions. Then, utilizing feature analysis, which comprises feature extraction and selection, DR is revealed. These features are classified into several DR levels, including typical and aberrant (mild, mild, severe). Figure 3 summarizes the general approaches used for fluid identification and DR categorization.
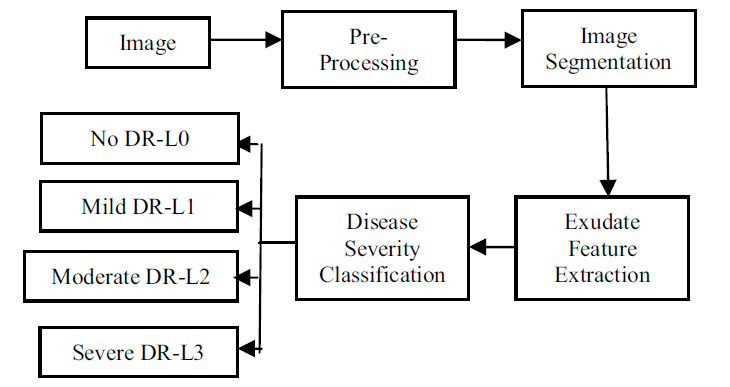
Fig. 3. The processes of DR Classification system
A. Tools / Platform to be used
Learning is the practice of gaining knowledge through study, according to its definition. In the case of artificial intelligence, a machine performs the learning process, allowing computer programs to improve themselves over time. Three applications of artificial intelligence.
B. Data Mining
These systems are intended to exploit massive volumes of data that humans cannot process by themselves to make more informed choices. Because it facilitates the development of medical knowledge using medical records, this provides, for example, a particularly useful application in the discipline of medicine.
C. Software Applications
As ludicrous as it may appear, humans cannot program everything on the world. Machine learning algorithms, on the other hand, can help to push these boundaries even further. In the case of the current endeavor, Automatic Number Production, for example, these types of methodologies are currently being utilized effectively in industries like autonomous driving, recognition of speech, and image identification. Self-customizing programmers: Although most people are unaware of it, almost everyone comes into contact with this particular specialty on a regular basis. In fact, this type of technological innovation underpins the news feeds that customers often receive depending on their specific interests as they browse the Internet. Using a variety of marked training samples, the algorithms may generate wide target functions that, when applied to a fresh dataset, accurately predict the predicted outcome. Here's how artificial intelligence algorithms work. The training dataset consists of samples that have been labeled, whereas the testing dataset consists of new, unused data. A sufficiently good and thorough training dataset is important in these kinds of apps because an inadequate train always generates poor results. The GUI window shows the final output, that is represented by the html page linked to the main platform. The output page has a "Load Data" button. After pressing the "Like" icon, a program which pulls values form the dataset is executed. Aside from the fundamentals stated above, Machine Learning algorithms share little in common. In reality, a method for artificial intelligence can be developed in an infinite number of ways. As a result, selecting the optimum design involves a thorough assessment, which is usually done utilizing a variety of data.
IV. ANALYSIS OF DATA
A. Pre-Processing Stage
In order to accurately and efficiently an image from the DiaretDB0 database must be Pre processed to correct the issues and enhance uneven illumination, contrast and noise related problems.
The Fundus images are collected from the database and pre-processing techniques are applied.
1) Colour Space Conversion : The input retinal fundus images are RGB scale images.
The RGB Component images are converted to an intensity image using RGB to HS based on Gonazalez and Woods method. The RGB images are converted to a grey scale images and is based on a fact that an intensity matrix can be disassociated from components like saturation and hue.
Zero Padding : The input for zero edge padding of pre-processed section is the result obtained from the color space conversion. The image matrix is then padded with zeroes to remove noise introduced by intensity enhancement and also segmentation stage so as to calculate minimum and maximum intensity for the whole image.
B. Zero Padding Algorithm
Step 1 : The first step to implement the algorithm is to check the image size to evaluate origin coordinates.
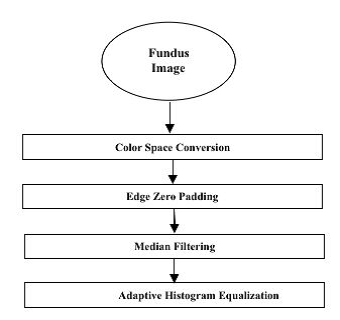
Fig. 4. Preprocessing Stage
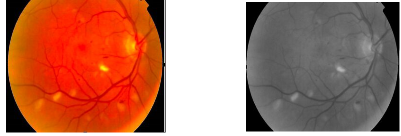
Fig. 5. Before color space conversion Fig. 6. After color space conversion
Step 2 : Create a zero matrix corresponding to the image size chosen.
Step 3 : Fix original image with appropriate coordinate.
Step 4 : The exterior mask is then filled with zero.
Step 5 : Min. And Max. intensity is evaluated within mask.
Step 6 : Return the values of minimum and maximum and also new zero padded image.
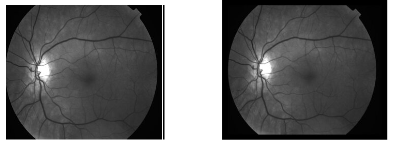
Fig. 7. Before zero padding operation Fig. 8. After zero padding operation
C. Segmentation
The main objective for segmentation is to group images in a region with same features.
A major role is played by Segmentation by facilitating the description of anatomical structures and other features of interest.
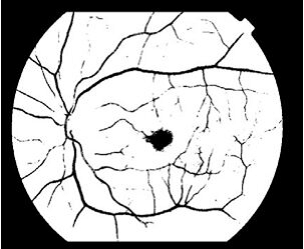
Fig. 9. Erosion
D. Disease Classification
There are three distinct stages involved in detecting microaneurysm, exudates and crossover points in fundus images in this research work.
1) Microaneurysm Detection
This is the first stage of work involved in abnormalities detection. The input is a segmented fundus binary image with candidate lesions, vein network and microaneurysm. Robustnes, length, pixel counts, ratio of minor to major axes, and holes test are all included in this. All these distinguishes microaneurysm, non-microaneurysm.
2) Pixels Count
This involves counting pixels making a candidate microaneurysm. From observation, pixel count of candidate microaneurysm is from 30 (MinPixelCount) to 5000 pixels for a (256x256) image. A zone or candidate that exceeds MinPixelCount is similar to background noise, however a region bigger than the highest counts for pixels exceeding 5000 pixels is considered a non-microaneurysm.
Conclusion
Recent studies have demonstrated positive results when retinopathy is diagnosed using machine learning, with improved generalization and accuracy compared to conventional methods. More research is required to solve challenges such as the lack of labelled data, choosing relevant features, and model adaptation. In this review, we examined ML concepts and discussed how they are applied to the diagnosis and prediction of retinopathy. The overwhelming majority of studies which have been reported in recent years have concentrated on developing prediction models utilizing supervised machine learning strategies and classification algorithms with the aim of properly forecasting illness outcomes. Reviewing their findings demonstrates that the utilization of multidimensional diverse information along with a variety of choice of features and classification approaches can be advantageous for the retinopathy domain.
References
[1] M. M. Fraza, P. Remagninoa, A. Hoppea, B. Uyyanonvarab, A. R. Rudnickac, C.G. Owenc, S. A. Barmana, “Blood vessel segmentation methodologies in retinal images – A survey”, Elsevier computer methods and programs in biomedicine vol.108 (2012) 407–433. [2] A. Alaimahal, Dr. S. Vasuki,“ Identification of diabetic retinopathy stages in human retinal image”, International Journal of Advanced Research in Computer Engineering & Technology (IJARCET) Volume 2, Issue 2, February 2013. [3] Padmalal S, Dr. Nelson Kennedy, Babu C, “A Comprehensive Review of Early Detection of Diabetic Retinopathy from Digital Fundus Images”, International Journal of Computer Trends and Technology (IJCTT) – volume 15 number 1 – Sep 2014. [4] Mahendran Gandhi, and Dr. R. Dhanasekaran, “Diagnosis of Diabetic Retinopathy Using Morphological Process and SVM Classifier”, International conference on Communication and Signal Processing, April 3-5, 2013 [5] Nimmy Thomas, Therese Yamuna Mahesh and Dr. K. L. Shunmuganathan “Detection and Classification of Exudates in Diabetic Retinopathy”, IJARCSMS Volume 2, Issue 9, September 2014. [6] Chisako Muramatsu, Yuji Hatanaka, Tatsuhiko Iwase, Takeshi Hara and Hiroshi Fujita, \"Automated selection of major arteries and veins for measurement of arteriolar-to-venular diameter ratio on retinal fundus images,\" Computerized Medical Imaging and Graphics, Vol. 35, pp.472–480, 2011. [7] Chandrashekar. M. Patil, “An Approach for the Detection of Vascular Abnormalities in Diabetic Retinopathy”, International Journal of Data Mining Techniques and Applications Vol:02, December 2013, Pages: 246-250. [8] S. Vasanthi, Dr. R. S. D Wahida Banu, “Automatic Segmentation and Classification of Hard Exudates to Detect Macular Edema in Fundus Images”, Journal of Theoretical and Applied Information Technology. Vol. 66 No.3, 31st August 2014. [9] Shraddha Tripathi, Krishna Kant Singh, B. K. Singh, Akansha Mehrotra. “Automatic Detection of Exudates in Retinal Fundus Images using Differential Morphological Profile.” International Journal of Engineering and Technology (IJET), Vol 5 No 3 Jun- Jul 2013. [10] Kittipo Wisaeng, Nualsawat Hiransakolwong and Ekkarat Pothiruk. “Automatic Detection of Exudates in Diabetic Retinopathy Images”, Journal of Computer Science 8 (8): 1304- 1313, 2012 ISSN 1549-3636 © 2012 Science Publications. [11] Silberman, N., Ahrlich, K., Fergus, R., and Subramanian, L. (2010). “Case for automated detection of diabetic retinopathy.” 2010 AAAI Spring Symposium Series. [12] Verma, K., Deep, P., and Ramakrishnan, A. (2011). “Detection and classification of diabetic retinopathy using retinal images.” 2011 Annual IEEE India Conference,IEEE, 1–6. [13] Nimmy Thomas, Therese Yamuna Mahesh and Dr. K. L. Shunmuganathan “Detection and Classification of Exudates in Diabetic Retinopathy”, IJARCSMS Volume 2, Issue 9, September 2014. [14] Chisako Muramatsu, Yuji Hatanaka, Tatsuhiko Iwase, Takeshi Hara and Hiroshi Fujita, \"Automated selection of major arteries and veins for measurement of arteriolar-to-venular diameter ratio on retinal fundus images,\" Computerized Medical Imaging and Graphics, Vol. 35, pp.472–480, 2011. [15] Chandrashekar. M. Patil, “An Approach for the Detection of Vascular Abnormalities in Diabetic Retinopathy”, International Journal of Data Mining Techniques and Applications Vol:02, December 2013, Pages: 246-250. [16] S. Vasanthi, Dr. R. S. D Wahida Banu, “Automatic Segmentation and Classification of Hard Exudates to Detect Macular Edema in Fundus Images”, Journal of Theoretical and Applied Information Technology. Vol. 66 No.3, 31st August 2014. [17] Shraddha Tripathi, Krishna Kant Singh, B. K. Singh, Akansha Mehrotra. “Automatic Detection of Exudates in Retinal Fundus Images using Differential Morphological Profile.” International Journal of Engineering and Technology (IJET), Vol 5 No 3 Jun- Jul 2013.
Copyright
Copyright © 2025 Dr. S.V. Sonekar, Mr. Arya Bharne, Ms. Isha Mendhekar, Ms. Shruti Wasnik . This is an open access article distributed under the Creative Commons Attribution License, which permits unrestricted use, distribution, and reproduction in any medium, provided the original work is properly cited.

Download Paper
Paper Id : IJRASET66914
Publish Date : 2025-02-11
ISSN : 2321-9653
Publisher Name : IJRASET
DOI Link : Click Here
 Submit Paper Online

