Ijraset Journal For Research in Applied Science and Engineering Technology
- Home / Ijraset
- On This Page
- Abstract
- Introduction
- Conclusion
- References
- Copyright
Efficient Near-Infrared Quantum Cutting in Y2O3 co-doped with Ho3+, Yb3+ Phosphor for the Application in Solar Cell
Authors: Nidhi Malviya, Vinita Chouhan, Shilpi Rawat, Nazish Khan
DOI Link: https://doi.org/10.22214/ijraset.2024.64461
Certificate: View Certificate
Abstract
An efficient Near-Infrared Quantum Cutting has been demonstrated in Ho3+ and Yb3+ co-activated Y2O3 sample, synthesized by a complex based precursor solution method. The phosphors have been characterized by X-ray diffraction (XRD), Crystal structure photoluminescence (PL) and CIE Chromaticity analysis. The phosphor materials give efficient emission in the green region both through UC and PL, while efficient NIR emission is observed through the QC process. The Photoluminescence emission (PL) spectra of Y2O3 doped 1% Ho3+ x% Yb3+ (x= 0, 5, 10, 20, 30, and 50) samples, The cooperative energy transfers from one Ho3+ to two Yb3+, an intense NIR emission around 549 nm of Yb3+ 2F5/2 - 2F7/2 transition was obtained under 449 nm excitation. Near infrared photons (wavelength range 549 nm) emitted by an Yb3+ ion pair. The Properties of Y2O3 doped with Ho3+ and Yb3+ quantum-cutting phosphors are dependent on various factors such as dopant concentration, crystallinity, homogeneity, particle size. Effective control of the above parameters the quantum-cutting ability of the phosphor material. Small particle size of the quantum-cutting phosphor Y2O3:Ho3+, Yb3+ make it a suitable candidate for its application in solar cells.
Introduction
I. INTRODUCTION
Phosphor Luminescent materials with quantum efficiency (QE) exceeding play an important role in novel concepts for solid state lighting, information display and solar energy conversion [1–5]. In a photoluminescence process, QE exceeding unity requires that, following excitation, more photons are emitted than those involved in the excitation process [6–13]. The conversion from sunlight to electricity using solar cell devices represents a promising approach to green and renewable energy generation. Quantum cutting phosphor is an interesting and significant optical phenomenon occurring in materials that is able to convert one high-energy photon, cutting down and gives (generally at ultraviolet or visible wavelengths) two low-energy photons, typically in near-infrared (NIR) spectral range.
In the case of up-conversion, two low-energy photons are “added up” to give one higher-energy photon, with respect to state-of-the-art Si-based photovoltaic cells, NIR-DC may enable a significant increase in energy conversion efficiency. To solve the problem of the long-term worldwide energy demand, the photovoltaic cells which can convert sunlight into electricity have become more and more important [14]. Among them, the crystalline Si (c-Si) solar cells occupy a majority of the solar cells market. However, the low energy efficiencies around 15% are the chief obstacles of the crystalline Si solar cells for its mass-application [15]. The mismatch between the solar spectrum and the band gap energy of silicon semiconductor is the main reason for source of energy loss (over 70%) [15, 16]. Due to the lower absorption rate of sunlight, the photoelectric conversion efficiency of solar cells is low. Hence, how to increase the photoelectric energy conversion efficiency of solar cells is very meaningful. To increase the energy efficiency, two general approaches were proposed. One is to develop tandem solar cells consisted of multiple semiconductor layers and each semiconductor layer has a characteristic band gap converting a different part of the solar spectrum. However, the complicated fabrication and high cost limit their practical application [16-18]. The other one has been achieved by quantum cutting (QC). QC is based on the process that an incident high-energy photon splits into two or more low energy photons, which can reduce the energy loss related to the thermalization of hot charge carries after the absorption of a high-energy photon. One ultraviolet (UV) or blue photon can be cut to two near-infrared photons which can both be absorbed by solar cell [17–20]. In this case, the energy loss can be effectively reduced and the near-infrared quantum cutting (NIRQC) has attracted a lot of research attention. So, luminescence material is used to quantum cutting process.
Host selection is an important factor in this process. A host material is of great importance in designing lanthanide-based luminescent phosphor materials for efficient photovoltaic applications. For the enhancement of the photovoltaic efficiency the host lattice must go through certain criteria such as the lattice of host material should be close enough and match well with the lattice of dopant ions and should also possess lower phonon energy as the phonon energy plays an important role in controlling the non-radiative transitions occurring due to multiphoton relaxation between closely placed energy levels.
Yuan et al. [21] have reported Tb3+, Yb3+ co doped Y2O3 as a Quantum Cutter, although they did not find very high Quantum Efficiency due to concentration Quenching phenomena which started to dominate at high concentration of Yb3+. Recently, Jadhav et al. [22] have reported that by effectively controlling the reaction parameters and the doping concentration, Quantum Efficiency up to 181.1% has been achieved in Tb3+, Yb3+ co doped Y2O3 nanophosphors. But none of them has tried to fabricate Solar Cell using this down-conversion phosphor. Yadav et al. have presented Quantum Cutting phenomena in Ho3+, Yb3+ co doped Y2O3 phosphor and they claim that the theoretical Quantum Cutting Efficiency is 182% [23]. Lei Zhao et al [24]. have been repotted KCaGd(PO4)2:Ce3+,Yb3+ quantum efficiency has been calculated and the theoretical maximum efficiency approaches up to 158.2%. Rare-earth doped Y2O3 host as efficient Quantum Cutting theoretical synthesized.
Although many people have reported many hosts doped with lanthanides as a suitable Quantum Cutter, so far, very few reports are available where the efficiency of photovoltaic cell has been enhanced due to the application of up conversion & down-conversion materials. In this Study, we focus on the synthesis of nano-sized, up conversion quantum-cutting phosphors. Their properties are dependent on various factors such as dopant concentration, crystallinity, homogeneity, particle size. Effective control of the above parameters can enhance the up-conversion quantum-cutting ability of the phosphor material. Nano-sized particles of Y2O3: Ho3+, Yb3+ were prepared with a complex based precursor solution method. The corresponding nano sized phosphor has also been synthesized. The phosphors have been characterized by x-ray diffraction (XRD), Crystal structure, CIE Chromaticity analysis, photoluminescence excitation and emission spectra and decay curves.
II. EXPERIMENTAL SECTION
A. Material and Synthesis
Y2O3 doped phosphor with different concentrations of Yb (0, 5, 10, 20, 30, 50 mol %) with a constant amount of Ho (1 mol %). Y2O3:Ho3+, Yb3+. The phosphors have been prepared by “complex based precursor solution method” using tri ethanol amine (TEA) as complexing agent. For the synthesis of Ho3+, Yb3+ doped Y2O3, solid powder of Yttrium Nitrate [Y(NO3)3], Holium Nitrate [HO(NO3)3], Ytterbium Nitrate [Yb(NO3)3] have been dissolved in double distilled water to make the stock solutions of Yttrium Nitrate, Holium Nitrate, and Ytterbium Nitrate respectively. Y(NO3)3 and Ho/Yb (NO3)3 solutions are taken in different stoichiometric ratios in order to synthesize samples. Then, the requisite amount of TEA was mixed into the nitrate solution to maintain the total metal ion to TEA mole ratio at 1:4. In the beginning, TEA formed a precipitate (because of the formation of metal hydroxides) with metal ions. This precipitate was in dissolved, and a clear solution was obtained by adding a certain amount of concentrated nitric acid (HNO3), maintaining the pH at 3–4. The clear solution of TEA-complexed metal nitrate was then evaporated on a hot plate at 180 oC–200 oC with constant stirring. Continuous heating of the solution led to foaming and puffing. During evaporation, the nitrate ions provide an in-situ oxidizing environment for TEA, which partially converts the hydroxyl groups of TEA into carboxylic acids. When complete dehydration occurred, the nitrates themselves decomposed, with the evolution of brown fumes of nitrogen dioxide, leaving behind a voluminous, organic-based, black, fluffy powder, i.e., the precursor powder. The precursor mass was then annealed at 1000 oC for 2 h to get the required samples.
B. Material Characterization
The XRD measurements were carried out using Bruker D8 Advance X-ray were produced using a sealed tube and the wavelength of X-ray was 0.154 nm (Cu K-alpha). The X-ray was detected using a fast-counting detector based on silicon trip technology (Bruker LynxEye detector). The Photoluminescence (PL) and PL excitation (PLE) spectra were obtained by using a spex fluorolog-3 spectrofluorometer (Jobin Yvon Inc., Edison, NJ, USA) equipped with a 450 W Xe lamp.
III. RESULT AND DISCUSSIONS
A. XRD patterns of Y2O3
Figure 1.1 Presents in XRD patterns of Y2O3 doped phosphor with different concentrations of Yb3+ (0, 5, 10, 20, 30, 50 mol%) with a constant amount of Ho3+(1mol%). Y2O3:Ho3+, Yb3+ phosphor was prepared by complex based precursor solution method (using tri ethanol amine (TEA) as a complexing agent. The Phase purity analysis of Y2O3 doped Ho3+, Yb3+ samples have been carried out.
It has been observed that the cubic phase of Std. Y2O3 (JNCPDS No. 88-1040) is present in each sample and the XRD is presented in Fig.6.1. Traces of impurity peaks have not been observed. The XRD pattern of Y2O3:Ho3+(1%), Yb3+ (50%) match exactly with the XRD of standard Y2O3.No impurity phases have been observed were detected. This means that the powders with a pure cubic phase of Y2O3 were synthesized and the RE (Ho3+, Yb3+) ions were well diffused into the Y2O3 host lattice.
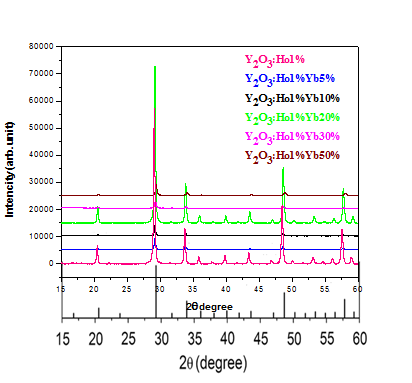
Figure 1.1 XRD of Y2O3 doped 1% Ho3+ x%Yb3+
B. Crystal structure of Y2O3
The Cubic Y2O3 crystallizes in the cubic bixbyite phase (space group Ia-3), which is one of the typical structures of RE3+ sesquioxides. In this structure, Yttrium (Y) ions are surrounded by six coordinate oxygen atom, oxygen ions generating an assembly of two types of distorted YO6 octahedra as presented in Fig. 1.2. Since there are two possible positions for the Y ion; i) a site with inversion symmetry of S6 local point symmetry and ii) a site with no inversion symmetry of C2 local point symmetry. There are 24 C2 sites and 8 S6 sites in the unit cell, there are three times more Y3+ ions at C2 sites than S6 sites [25].
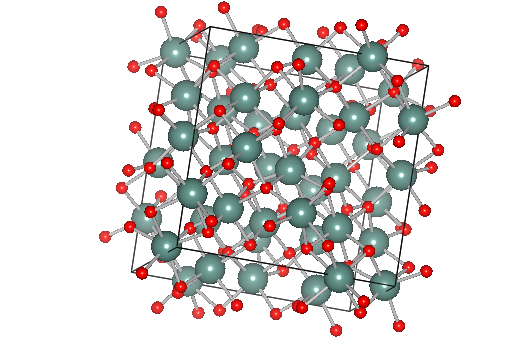
Figure 1.2 Crystal structure of Y2O3
C. Photoluminescence Measurement
In order to investigate the Quantum Cutting Mechanism of Y2O3 codoped with Ho3+, Yb3+ phosphor, Emission (PL) and Excitation (PLE) and Spectra of the phosphor samples were measured and are presented in Fig. 1.3, figs 614, 1.5, 1.6, respectively. The emission spectra covering the visible and near infrared spectral range with a fix concentration of Ho3+ 1% and various concentration of Yb3+ % are taken under 449 nm Excitation. PL spectrum Consist of several lines peaking at 536 nm, 540.9 nm, 545 nm, 549 nm, corresponding to 5F4–5I8, 5S2–5I8, 545nm, corresponding to 5F5– 5I8 and 549 nm corresponding to 5S2–5I7 transition of Ho3+ ion respectively [26, 27]. The most intense peak is observed in green region at 549 nm.
Photoluminescence Excitation (Monitored for at 549 nm) of the samples were measured and presented in Fig.1. 3. Many sharp peaks, characteristics of Ho3+ ions, are obtained. It has been observed that with the increase of Yb3+ concentration, the emission intensity of Ho3+ peak is decreased and consequently the intensity of the peak characteristic of Yb3+ is gradually increased. The enhancement of the Yb3+ peak intensity (at 980 nm due to transition from 2F5/2 to 2F7/2), with the increase in the concentration of Yb3+, at the expense of Ho3+ emission peak intensity, reveals that the Energy Transfer is taking place from Ho3+ to Yb3+.
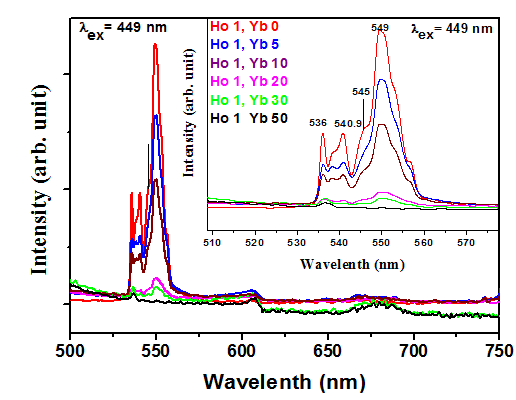
Figure 1.3 Up conversion (UC) spectrum (λexc = 449 nm) of Ho3+ (1 mol%) ion in Y2O3 phosphor with varying concentration of Yb3+ and Ho3+ (1 mol%), Yb (0 mol%) codoped phosphor
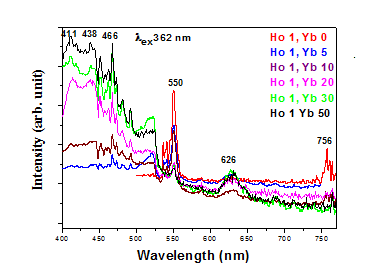
Figure 1.4 Photoluminescence excitation and emission spectra Ho3+/Yb3+ co-doped Y2O3 phosphor with varying concentrations of Yb3+ ions. Emission spectra for λex = 362 nm,
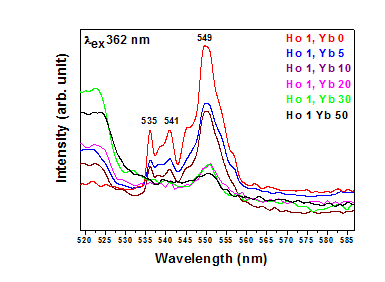
Figure 1.5 Photoluminescence excitation and emission spectraHo3+/Yb3+ co-doped Y2O3 phosphor with varying
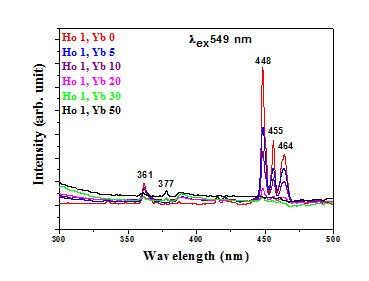
Figure 1.6 Photoluminescence excitation and emission spectra Ho3+/Yb3+ co-doped Y2O3 phosphor with varying concentrations of Yb3+ ions. Emission spectra for Excitation spectra monitored for λem = 549 nm. Emission spectra with 549 nm show quantum cutting emission.
D. Energy level diagram
In this chapter, we focus on the synthesis of nano-sized, up conversion, Quantum cutting and Energy Transfer (ET) from Ho3+ to Yb3+ in Y2O3 sample, have been analyzed the dependence of the rate of energy transfer from Ho3+ to Yb3+ with respect to Yb3+ concentration. When Ho3+ ion is excited by UV light source, ions are excited to higher lying level/host absorption band and further goes through different radiative and nonradiative relaxations and finally reach to 5S2 level, from where QC emission is observed as discussed earlier. Similar observation has been reported in other works also; summarized in a review by Liu et al. and references there in [28]. Shown in Figure clearly shows different possible ways of transitions, under different excitations i.e. 362 nm and 449 nm. According to Figures the decay lifetime curve inY2O3:Ho3+ (1%) shows a nearly single exponential decay. A mono-exponential fit yields a decay time measured. When the Yb3+ concentration is increased, the decay curves decrease more rapidly
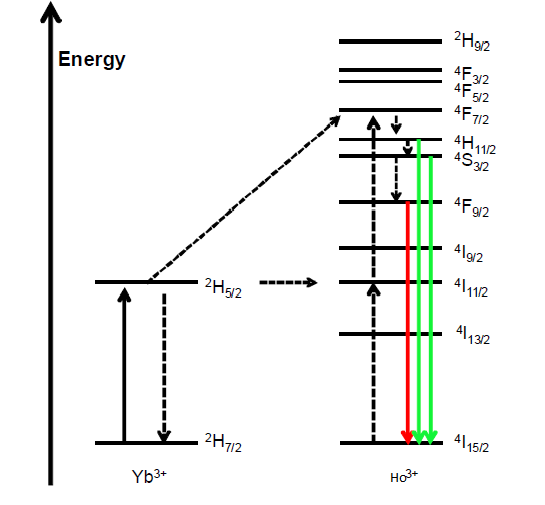
Figure 1.7 Energy level Diagram for Ho3+ and Yb3+ ions
The faster decline of decay time as a function of Yb3+ concentration can be explained by the introduction of extra decay pathways due to the Yb3+ doping, energy transfer from Ho3+ to Yb3+ enhances the decay rate. The presence of Yb3+ ion substantiates the non-exponential behavior of decay curves in Ho3+, Yb3+ co-doped samples. In co-doped samples the concentrations of Yb3+ are randomly distributed over the lattice site. Thus, the environment of every Ho3+ ion is different, resulting in a variation in a transfer rate [29].
E. Chromaticity analysis
The color co-ordinates for green UC emission Y2O3 phosphor shows the CIE chromaticity coordinates for Y2O3:1%Ho, x%Yb (x = 0, 5, 10, 20, 30, 50) respectively for 362 nm and 449 nm excitations. The (x, y) coordinates values are represented. For 362 nm excitation, the position of color coordinates shows shift towards yellow color while for 449 nm excitation, the position of color coordinates is almost same for all samples showing similar output color under 449 nm, 362nm excitation. Fig. 1.8 shows the chromaticity analysis of Y2O3 compound.
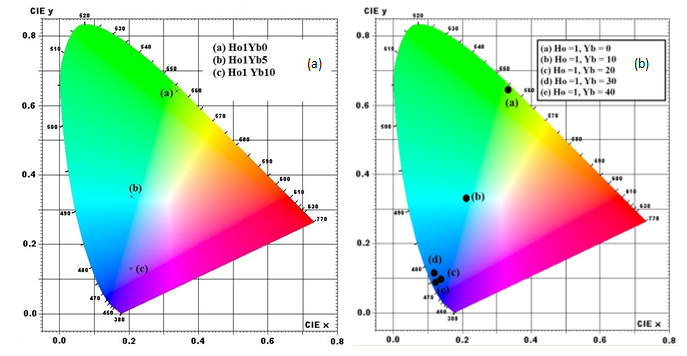
Figure 1.8 CIE color coordinates of Y2O3:Ho3+,Yb3+ ( a) Excitation 449 nm and (b) 362nm
Table 1.1 CIE color coordinates of (1) Y2O3:Ho1 Yb0%, (2) Y2O3:Ho1Yb5%, (3) Y2O3:Ho1Yb10% and (4) Y2O3:Ho1Yb20%, (5) Y2O3:Ho1Yb30% , (6) Y2O3:Ho1Yb50% respectively for 449, 362 nm excitation.
|
Sample
|
CIE color co-ordinates (x,y) excitation (449nm) |
CIE color co-ordinates (x,y) excitation (362nm) |
|
1) Y2O3 Ho1Yb0% |
(0.336,0.643) |
(0.211, 0.331) |
|
2) Y2O3 Ho1Yb5% |
(0.211,0.332) |
(0.025, 0.124) |
|
3) Y2O3Ho1Yb10% |
(0.204,0.124) |
(0.336, 0.643) |
|
4) Y2O3Ho1Yb20% |
(0.132,0.095) |
(0.1320,0.0953) |
|
5) Y2O3Ho1Yb30% |
(0.1245,0.116) |
(0.1245, 0.1159) |
|
6) Y2O3Ho1Yb50% |
(0.130,0.009) |
(0.1305, 0.0996) |
Conclusion
IV. CONCLUSION Ho3+/Yb3+ co-doped Y2O3 phosphors have been synthesized by a complex based precursor solution method and the phosphors have been characterized by x-ray diffraction (XRD), crystal structure, CIE color coordinates, and photoluminescence excitation and emission spectra and decay curves. The Photoluminescence emission (PL) spectra of Y2O3 doped 1% Ho3+ x% Yb3+ (x = 0, 5, 10, 20, 30, and 50) samples, The cooperative energy transfers from one Ho3+ to two Yb3+, an intense NIR emission around 549 nm of the cooperative energy transfer Yb3+ 2F5/2 - 2F7/2 transition was obtained under 449, 362 nm excitation. Near infrared photons (wavelength range 549 nm) emitted by an Yb3+ ion pair. The Properties of Y2O3 doped with Ho3+ and Yb3+ Quantum-cutting phosphors are dependent on various factors such as dopant concentration, crystallinity, homogeneity, particle size. Effective control of the above parameters the quantum-cutting ability of the phosphor material. The purity of color emission has been visualized by the CIE coordinates for 449 and 362 nm. The small particle size of quantum cutting, and up conversion emitter can have promising applications in solar cells.
References
[1] D.L. Dexter, Phys. Rev, 108, 630 (1957). [2] W.W. Piper, J.A. de Luca, F.S. Ham, J. Lumin, 8, 344 (1974). [3] J.L. Sommerdijk, A. Bril, A.W. de Jager, J. Lumin, 8, 341 (1974). [4] R.T. Wegh, H. Donker, K.D. Oskam, A. Meijerink, Science, 283, 663 (1999). [5] Q.Y. Zhang, X.Y. Huang, Prog. Mater. Sci, 55, 353 (2010). [6] R. Pappalardo, J. Lumin,14, 159 (1976). [7] R.T. Wegh, H. Donker, A. Meijerink, R.J. Lamminmaki, J. Holsa, Phys. Rev. B, 56, 13841 (1997). [8] S. Shionoya, W.M. Yen, Phosphor Handbook, CRC Press, Boca Raton, FL, (1998). [9] A.M. Srivastava, W.W. Beers, J. Lumin, 71, 285 (1997). [10] B.S. Richards, Sol. Energy Mater. Sol. Cells, 90, 2329 (2006). [11] N. Kodama, Y. Watanabe, Appl. Phys. Lett, 84, 4141 (2004). [12] A.N. Belsky, N.M. Khaidukov, J.C. Krupa, V.N. Makhov, A. Philippov, J. Lumin, 94 (2001). [13] S.M. Loureiro, A. Setlur, W. Heward, S.T. Taylor, H. Comanzo, M. Manoharan, A. Srivastava, P.Schmidt, U.Happek, Chem. Mater, 17, 3108 (2005). [14] O. Morton, Nature, 443, 19 (2006). [15] M. J. Currie, J. K. Mapel, T. D. Heidel, S. Goffri, and M. A. Baldo, Science, 321, 226 (2008). [16] B. S. Richards, Sol. Energy Mater. Sol. Cells, 90, 2329 (2006). [17] B. S. Richards, Sol. Energy Mater. Sol. Cells, 90, 1189 (2006). [18] B. M. van der Ende, L. Aarts, and A. Meijerink, Adv. Mater, 21, 3073 (2009). [19] Q. Zhang, J. Wang, G. Zhang, and Q. Su, J. Mater. Chem, 19, 7088 (2009). [20] Y. Teng, J. Zhou, X. Liu, S. Ye, and J. Qiu, Opt. Express, 18, 9671 (2010). [21] J. L. Yuan, X.Y. Zeng, J. T. Zhao, Z. J. Zhang, H. H. Chen and X. X. Yang, J. Phys. D Appl. Phys, 41, 105406 (2008). [22] Abhijit P. Jadhav, Sovann Khan, Sun Jin Kim, Seung Yong Lee, Jong-Ku Park, So-Hye Cho, Res Chem Intermed DOI 10.1007/s11164-016-2427-9. [23] R. V. Yadav, S. K. Singh and S. B. Rai, RSC Advances, 5, 26321 (2015). [24] Lei Zhao, Lili Han, and Yuhua Wang, Optical Society of America, 4, 1456 (2014). [25] R.K. Tamrakar, D.P. Bisen, N. Bramhe, Luminescence, 30, 668 (2015). [26] A. Pandey and V. K. Rai, Dalton Trans, 42, 11005 (2013). [27] G. H. Dieke, Interscience Publishers, USA, 253-261, SBN 470 21390 6 (1968). [28] X. Huang, S. Han, W. Huang and X. Liu, Chem. Soc. Rev, 42, 173 (2013). [29] R. V. Yadav, S. K. Singh and S. B. Rai, RSC Advances, 5, 26321 (2015).
Copyright
Copyright © 2024 Nidhi Malviya, Vinita Chouhan, Shilpi Rawat, Nazish Khan. This is an open access article distributed under the Creative Commons Attribution License, which permits unrestricted use, distribution, and reproduction in any medium, provided the original work is properly cited.

Download Paper
Paper Id : IJRASET64461
Publish Date : 2024-10-04
ISSN : 2321-9653
Publisher Name : IJRASET
DOI Link : Click Here
 Submit Paper Online

