Ijraset Journal For Research in Applied Science and Engineering Technology
- Home / Ijraset
- On This Page
- Abstract
- Introduction
- Conclusion
- References
- Copyright
English Language Proficiency Analysis and Prediction using Deep Learning Algorithms
Authors: Animesh Talukder, Surath Ghosh
DOI Link: https://doi.org/10.22214/ijraset.2024.58936
Certificate: View Certificate
Abstract
Writing is one of the fundamental abilities. Unfortunately, only a small part of children are able to obtain it, typically as a result of the infrequent use of writing projects in the classroom. The lack of exercise has a particular negative effect on students who are studying English as a second language, also known as English Language Learners (ELLs), a population of students that is constantly growing. ELLs are not the intended audience for these tools, despite the fact that employing automated feedback systems makes it easier for teachers to offer more writing assignments. Due to the present tools\' incapacity to provide feedback based on the student\'s language proficiency, the learner may receive a final evaluation that is skewed in their favor. Using data science models and algorithms, automated feedback techniques may be enhanced to better address the unique needs of these children. The primary goal of this essay is to assess the quality of the essay using a set of evaluation criteria. Six analytical criteria were used to evaluate the essays: coherence, syntax, vocabulary, phraseology, grammar, and conventions. Each measure\'s scores grow by a factor of 0.5 and range from 0.0 to 5.0. Predicting how well an article will perform on these 5 metrics is the major task.
Introduction
I. INTRODUCTION
The dataset presented here (the ELLIPSE corpus) comprises argumentative essays written by 8th-12th grade English Language Learners (ELLs). With corresponding The essays have been scored according to six analytic measures: cohesion, syntax, vocabulary, phraseology, grammar, and conventions. Each measure represents a component of proficiency in essay writing, with greater scores corresponding to greater proficiency in that measure. The scores range from 1.0 to 5.0 in increments of 0.5. Your task is to predict the score of each of the six measures for the essays given in the test set. As a metric we use root min square error and our aim is to minimize root mean square. Textual material for an English exam can take the form of excerpts from books, poems, essays, or even audio or video clips. These texts could be chosen from a variety of sources, including books, news stories, scholarly works, even commonplace conversations. The inclusion of text data in an English exam serves to assess the test-proficiency takers in reading, understanding, and interpreting spoken and written English. Additionally, it might test their writing abilities, vocabulary, and grammatical understanding. Depending on the exam's level and the skills being examined, the length and complexity of the text data presented in an English exam may vary. A more advanced exam might include longer articles, essays, or academic papers, whereas a basic exam might only require short stories or simple words.
Overall, text data is essential for evaluating a test-English taker's language aptitude and skills since it enables the examiner to gauge how well they can express themselves. Prescribed, although the various table text styles are provided. The formatter will need to create these components, incorporating the applicable criteria that follow.
II. LITERATURE REVIEW
An important topic of research is predicting English proficiency, especially in light of the growing usage of English as a world language.
Here is a review of previous studies on predicting English proficiency.
- Machine Learning: Researchers have predicted English competency levels using machine learning methods. These algorithms create models that can precisely anticipate proficiency levels by analyzing vast volumes of data. Studies have shown that using machine learning techniques can increase the predictability of English proficiency.
- Linguistic Features: The linguistic characteristics that are most indicative of English proficiency have been the subject of numerous research. For instance, some research have discovered that markers, syntactic complexity, and vocabulary quantity are significant characteristics for predicting English competency. Fluency, accuracy, and pronunciation have been found to be significant predictors in other investigations.
- Demographic Factors: Academics have also looked into how demographic traits might be used to predict English proficiency. For instance, it has been discovered that first language, age, and gender are significant predictors of English ability. Additionally, several research have discovered that elements like motivation and language-learning techniques can influence predictions of English proficiency.
- Computer-Based Exams: To anticipate English competence levels, computer-based tests have been devised. These assessments examine language aspects such as grammar, vocabulary, and fluency using computerized scoring algorithms. Computer-based exams have been proved in studies to produce reliable forecasts of English proficiency.
- Integrating Various Sources: Some research suggests that combining multiple data sources can increase the accuracy of English proficiency prediction. Combining demographic information, linguistic traits, and computer-based test scores, for example, might provide a more complete picture of an individual's English competence.
In conclusion, estimating English proficiency is a challenging undertaking that takes into account a variety of variables. The ability to forecast English competence has been found to depend on a variety of elements, including computer-based examinations, linguistic characteristics, demographic information, and machine learning algorithms. To create more precise and trustworthy predictors of English competence, future study can continue to investigate these characteristics.
III. METHODOLOGY
Depending on the specific technique or model being utilized, the methodology for forecasting English proficiency may change. However, when forecasting English competency using machine learning algorithms, the following approach can be used generally:
Data Collection: To begin forecasting English competency, a sizable collection of linguistic samples from Google and Kaggle must be gathered. Various sources, including academic tests, language proficiency tests, and spoken interactions, can provide these samples. Coherence, syntax, vocabulary, phraseology, grammar, and conventions provide the basis for the six criteria.
Model Selection: After the features have been retrieved, a deep learning model needs to be chosen. There are numerous types of models that can be applied, including neural networks, LSTM, GRU, CNN, and BERT. The model ought to be selected depending on how well it can forecast English proficiency.
Training the model: The model must be trained using the gathered data and features. In order to maximize the model's capacity to forecast English proficiency, the model's parameters are adjusted during the training phase.
Model testing: To assess the model's accuracy after it has been trained, it must be tested on a different set of language samples. The model's predictions are compared to the samples' actual English proficiency levels as part of the testing process.
Model Validation: The methodology's final stage is confirming the model's precision using statistical indicators like mean squared error or Pearson correlation coefficient. Depending on the outcomes of the testing, the model may need to be either optimized or modified.
IV. PROBLEM STATEMENT
Secondary school students' poor performance in a wide range of educational areas at public examinations has commonly been attributed to their poor command of the English language, which is the primary medium for teaching students about academic subjects. The purpose of this research is to grade each grammatical element of a student's paper so that the student can improve in the area in question. Existing approaches, including language proficiency tests, can be time- and money-consuming and may not reflect a person's true skill level. Additionally, these tests might not evaluate all facets of language use, including pronunciation, accuracy, and fluency. There is a need for more accurate and efficient ways to forecast English competence that can be applied in a variety of contexts, including schooling, job placement, and immigration, to solve this issue. These techniques should be developed to precisely and impartially assess a person's level of competence. They should be based on a thorough understanding of the linguistic traits that are most indicative of English ability.
The goal of English proficiency prediction is to create methods that may be utilized in a variety of contexts to facilitate efficient communication in English while also being practical, accurate, and reliable for determining a person's level of English proficiency.
V. DATA-SET VISUALIZATION AND DESCRIPTION
The data set used for English proficiency prediction typically includes language samples collected from a diverse group of individuals with different levels of English proficiency. The data set may consist of written passages, spoken conversations, or both, and it may be obtained from a range of sources such as language proficiency exams, academic tests. Additionally, demographic details like age, gender, educational achievement, and native tongue may be included in the data set. The relationship between demographic variables and English proficiency can be studied to use this data to spot trends or patterns.
The data set should be properly chosen and pre-processed to guarantee its accuracy and dependability. The language samples ought to be typical of the variety of language use and complexity seen in everyday situations. To prevent bias in the model, the data set should also be balanced in terms of the distribution of proficiency levels.
Pre-processing and careful selection of the data set are necessary to guarantee its accuracy and dependability. The language samples ought to be typical of the variety of language use and complexity seen in everyday situations. To prevent bias in the model, the data set should also be balanced in terms of the distribution of proficiency levels.
A variety of linguistic characteristics, including vocabulary size, syntax, grammar, fluency, accuracy, and pronunciation, can be annotated on the language samples in the data collection. The machine learning model for predicting English competency uses these attributes as input variables.
Overall, a complete, representative, and well chosen data set should be used to predict English proficiency in order to guarantee the machine learning model's accuracy and dependability. The data collection should be pre-processed to contain demographic details as well as pertinent linguistic annotations that represent the full spectrum of language use and complexity.
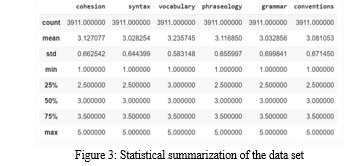
Here, using pandas numpy which are the very useful library we are able to visualize the data.

VI. STATISTICAL ANALYSIS OF DATASET
When analysing text data on English competence, statistical techniques are used to recognize patterns and relationships in the data as well as to derive conclusions about the language proficiency of the people represented in the data. Here are common statistical methods used in the analysis of English proficiency text data inter quartile range , mean of words and word count.
Descriptive statistics: In descriptive statistics, the central tendency, variability, and distribution of the data are described using summary statistics like mean, median, mode, and standard deviation. Descriptive statistics, for instance, can be used to examine how frequently grammatical errors or large vocabulary words occur in text data.
Iinferential statistics: This involves using statistical tests such as t-tests, ANOVA, or regression analysis to make inferences about the language proficiency levels of the individuals in the data. For example, inferential statistics can be used to determine whether there are significant differences in language proficiency levels between groups of individuals based on demographic variables such as age, gender, or educational level.
Here the graphical representation of our English analysed dataset.
VII. ANALYSIS OF OUTPUT SCORE DISTRIBUTION
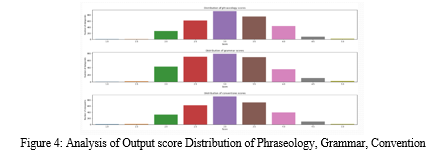
Analyzing the frequency and pattern of scores across proficiency levels is part of analysing the output score distribution of a dataset on English proficiency. Here are some typical techniques for analysing the distribution of output scores from a dataset on English proficiency:
- Frequency Distribution: To show how results are distributed among competence levels, a histogram or frequency table must be created. This can reveal information on the percentage of people who are proficient at each level and reveal any imbalances in the distribution. Calculating the mean, median, and mode of the scores will help you understand the distribution's central tendency. This can shed light on the typical level of proficiency of the people represented in the data.
- Outliers: This involves identifying any scores that are significantly higher or lower than the majority of the scores. Outliers can be indicative of measurement errors or unusual language proficiency levels that may require further investigation. To describe the variability of the distribution, the standard deviation, range, and interquartile range of the scores are calculated. This can shed light on how the scores vary according to proficiency level.
Calculating the distribution's skewness and kurtosis will help you understand how the distribution is shaped. Kurtosis and skewness both quantify the degree of asymmetry and peaking in the distribution, respectively.
To assess the frequency and pattern of scores throughout the proficiency levels, it is crucial to analyze the output score distribution of a dataset on English proficiency. To find any imbalances or unexpected patterns in the distribution, it requires analyzing the frequency count, weighted mean, variability, measures of dispersion, and outliers. English proficiency prediction models can be more precise and reliable with the help of this data, and it can also help us comprehend the language proficiency levels of the characters portrayed in the dataset.

VIII. CORRELATION BETWEEN TARGET OUTPUTS
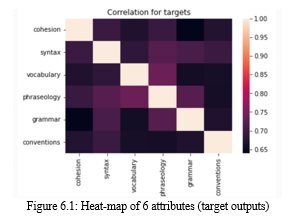
A correlation coefficient, such as Pearson's correlation coefficient or Spearman's rank correlation coefficient, can be used to calculate the correlation between the projected goal output and the actual score. The intensity and direction of the association between the two variables are shown by these coefficients.
If the anticipated goal output and the actual result show a strong positive association (correlation coefficient close to +1), the model is likely to be successful in forecasting the person's English proficiency score. The model is not doing a good job of forecasting the person's English proficiency score if the correlation coefficient is low (around 0), indicating that there is little to no association between the projected target output and the actual result.
It is important to remember that a correlation does not prove a cause. Given that there may be other factors affecting a person's competence, a high correlation coefficient does not always imply that the model is responsible for the person having a higher English proficiency score. A high correlation coefficient, however, would imply that the model is correctly capturing some of the elements that go into someone's level of English ability.
The values of a matrix are depicted using colors in a heat-map, which is a graphic representation of data. We can create a matrix of values where each row represents the predicted target output and each column represents the actual score in order to visualize the correlation between the predicted target output of an English proficiency score prediction model and the actual English proficiency score using a heat-map.
We can make use of a Python module like sea-born to generate the heat-map. The sea-born heat-map function may then be used to visualize the data using a color scale by passing the matrix of values to it.

IX. DATA PRE-PROCESSING
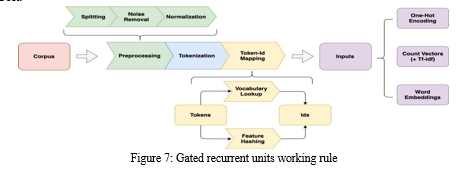
The data is preprocessed before it is fed into the model. Preprocessing steps include eliminating stop words, special characters, and punctuation. The details of these steps for data preprocessing are as follows.
Stop word removal. Words such as "a," "an," "the," and "and," are frequently eliminated from text data since they do not have much meaning. We can make our own stop word list depending on the subject matter of your text data or use pre-defined stop word lists.
Lowercasing. Converting all text to lowercase can help to reduce the dimensionality of the data and simplify the modeling process.
Cleaning. Removing any unwanted characters, such as punctuation or HTML tags, from the text data can help to improve its quality and make it easier to analyze.
Vectorization. For machine learning models, the text data must be transformed into a numerical format. Techniques like bag-of-words or TF-IDF (term frequency-inverse document frequency) vectorization can be used for this.
Splitting into training and testing sets : Finally, the data is typically split into training and testing sets to evaluate the performance of the machine learning model. This is usually done using a ratio of 70-30 or 80-20 for training and testing data, respectively.
By performing these steps, you can preprocess the text data and prepare it for use in deep learning models for GRU,BERT modelling tasks.
X. MODELING THE ARCHITECTURE
For training we have used 5 different kinds of architecture :
- Model 1: With the embedding of each word in the sentences using Global vectors (GloVe), GRU layers are used to determine the score of each of the outputs. For each of the proficiency score we are using GRU layers separately and making prediction for each proficiency score.
- Model 2: Going to use common embedding layer connected to 6 GRU. Here embedding layer is connected as common and the from there it is branched into six where each branch has a GRU layer and output layer. Each branch corresponds to each proficiency output.
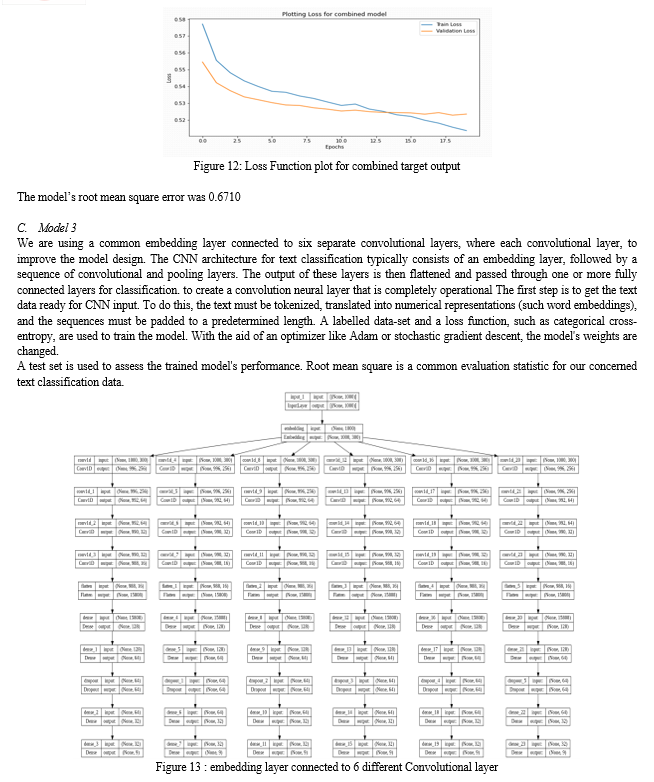
- Model 3: common embedding layer connected to 6 different Convolutional layers. Same as the before model but here GRU layers are replaced by Convolutional 1D layers.
- Model 4: Implementing pretrained BERT model as base layers and on the top layers we have used 1D Convolutional layer followed by dense layer.
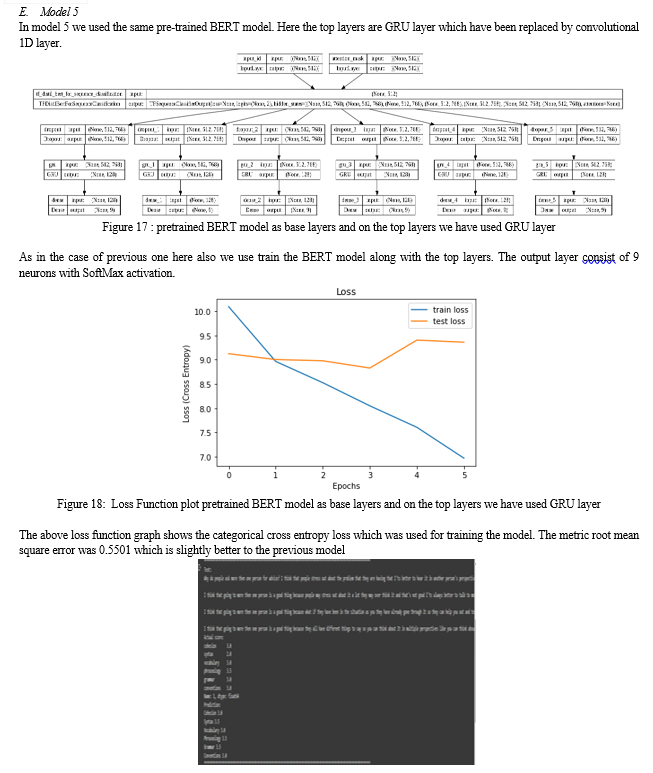
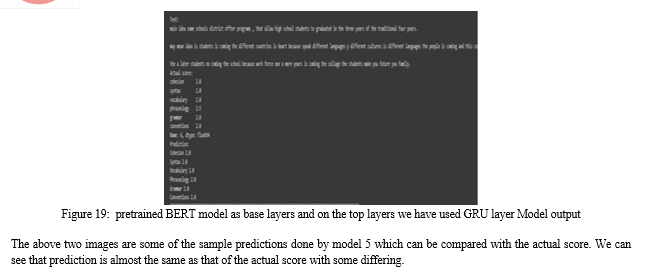
- Model 5: Pretrained BERT model as base layers and on the top layers we have used GRU layer followed by dense layer.
In this section we are going to build a model corresponding to our data set and trying to improve metric score as much as possible. Aiming at the requirement of English proficiency analysis of semantic content in English grammar detection, we study the Long Short-Term Memory (LSTM), Gated Recurrent Unit (GRU), Convolution Neural network (CNN) and Bidirectional Encoder Representations from transformation of English character.
XI. MODELING IMPLEMENTATION
The task is approached in way of classification as there are 9 outputs to be predicted starting from 1 to 5 in a range of 0.5. After classification with the predicted output, we will find the root mean square error for each of the model. Here root mean square error will be used as metric to determine the efficiency of each model.
A. Model 1
Many modifications were created to address the Vanishing-Exploding gradients problem that is frequently experienced when operating a basic recurrent neural network. The Long Short Term Memory Network is one of the most well-known versions (LSTM). The Gated Recurrent Unit Network is a lesser-known but equally potent variant (GRU). Recurrent neural network (RNNs) with gated recurrent units (GRUs) are used to handle data sequences like text, audio, or video. Traditional RNNs and GRUs are comparable, but GRUs have a more efficient structure that makes it possible for them to better capture long-term relationships. GRUs are superior to traditional RNNs in terms of computational efficiency, making them the best choice for processing massive volumes of data. GRUs have been used to a wide range of tasks, such time series prediction, speech recognition, machine translation, and natural language processing. With an embedding layer, a kind of neural network, we will begin to implement model 1. The use of an embedding layer enables us to develop word or phrase vector representations that accurately reflect the text's semantic meaning. When words are converted into dense, low-dimensional vectors, an embedding layer makes word representation more effective. Each word index in the sequence that the layer receives as input is a word from a vocabulary. Afterwards when, it learns a set of weights that convert each word index into a corresponding vector representation in a continuous vector space. The learned embeddings have the characteristic that words with comparable meanings are situated closer to each other in the vector space. After embedding layers we will move to padding which is a common technique used in deep learning to handle variable-length input sequences, such as text data. Padding has the ability to make all text samples in a data-set of various length the same length, which is required for training a neural network that only accepts input of a suitable size. Padding has the ability to make all text samples in a data-set of various length the same length, which is required for training a neural network that only accepts input of a suitable size. We might start by providing each text sample as a list of words in order to employ padding and obtain a 2-dimensional data-set for English proficiency prediction. Tokenizing the text into individual words and then giving each word a distinct index would be required initially. To create the word indices, we might utilize a pre-trained embeddings model like Word2Vec or GloVe. Once the text is tokenized and converted to integers, you can pad the sequences to a fixed length. To pad the sequences, we use a library such as Keras or TensorFlow, which provides a function to add zeros at the end of each sequence to make all sequences the same length. We have a data-set of sentences, each varying in word count. You have five sequences with the lengths 46, 30, 47, 38, and 42 after tokenizing the sentences. The dimensions of the resulting 2-dimensional array will have dimensions if we pad the sequences to a length of 15. (5, 4). The first row of the array will be the first sentence, and it will have six integers to represent each token in the phrase, followed by three zeros to make the sequence length 15. In order to make the sequence length 15 as well, the other rows of the array will be padding with zeros. As a result, after doing padding to 1000 we get 2 dimensional data set.

GRU layers to determine the score of each of the outputs. We have used 6 model architecture for the 6 output feature(i.e proficiency scores). The models are evaluated using root mean squared error for each of the output feature. To find the overall loss and score we take the average embedding layer. After the global vector is computed, it can be concatenated with other features, such as numerical or categorical variables, and passed through a dense layer to produce the final output of the model.
Using a global vector can be a useful technique in cases where the input sequence is of variable length, as it allows the model to summarize the entire sequence into a fixed-length vector. As a result, we get 3 dimensional matrix. These three-dimensional matrices were then fed through gated recurrent unit layers, which produced the output listed below. Neural networks then followed dense layers to complete the task. An output-based classification task has been completed, producing 9 classes and 9 corresponding outputs. Of all those root mean squared error which is also the metric that is used for measuring the efficiency of the model. Using following output graph we are going to measure accuracy performance of 6 Attributes which are cohesion, syntax, vocabulary, phraseology, grammar and conventions.



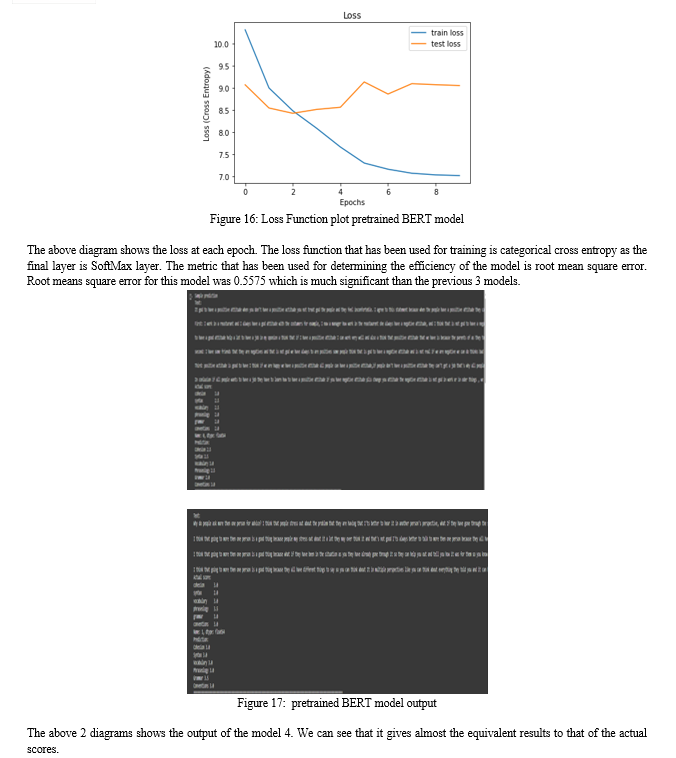
In the above figure we can see that the input tokens for each word is sent as input to the model. The maximum length of the sentence is fixed to 512. Each word in a sentence is tokenized in accordance to the BERT model’s training tokenization. The words will be given the tokens based on how it was given during the training of that BERT model. Along with token input we send attention mask input which shows whether there is a word in the sentence given at a particular point. The attention mask consists of 1 and 0 where 1 will be present if there is a token at that particular index else it will be 0. These two inputs are sent to the BERT model where these 2-dimensional data convert to 3-dimensional data. Each word is converted into vector of size 768. This can be considered as a word embedding where each word is embedded into vector of size 768. This 3-dimensional data is passed into 6 encoding layers of the BERT model. The output from the BERT model is fed into dropout layer and into a convolutional 1D layer. Here the convolutional 1D layer is fixed with kernel size of 8. By this the vector size of each word reduces to 8. The output from the convolutional 1D layer is flattened and sent into the dense layer with 9 outputs and Soft-Max as the activation. The 9 outputs represent the output ranging from 1 to 5 in range of 0.5. During training the BERT model was also trained along with the top layers as this method was yielding better results rather than freezing the pre-trained layers.
XII. FUTURE WORK
Deep learning-based English proficiency score prediction is an exciting area of study with numerous possible future applications. The following are some potential future applications for this technology:
Education: English proficiency score prediction models can be used in educational institutions to spot pupils who could be having trouble with their language abilities and to offer them individualized guidance and assistance so they can become better.
Language testing: Prediction models for English proficiency scores could be used to automate language testing, resulting in a quicker and more effective process. This may be especially helpful for institutions like immigration offices or multinational enterprises that must evaluate the language proficiency of a sizable population.
Market for Employment: Employers may use English Proficiency Score Prediction Models to evaluate job candidates, particularly for positions requiring a solid command of the English language. This might make it easier for employers to spot applicants who would excel in jobs requiring English language proficiency.
English proficiency score prediction models could be used to tailor language learning courses to the requirements of each individual. The model might offer tailored comments and exercises to help the learner develop by assessing the student's English strengths and shortcomings.
Cross-lingual applications: Models for predicting English proficiency score could also be used for other languages. A model might, for instance, forecast a person's multilingualism, which could be helpful for those who frequently travel to other nations or operate in multilingual situations.
Overall, the use of deep learning to predict English proficiency scores has a promising future, and there are numerous possible applications and lines of inquiry for further study in this field.
Conclusion
From the above models we can conclude that model 5 has done exceptionally well when compared to other 4 models. Even though the 4th model was better the fifth model’s result and metric score was bit higher than the 4th model.
References
[1] Guglielmi, R. Sergio. \"Native language proficiency, English literacy, academic achievement, and occupational attainment in limited-English-proficient students: A latent growth modeling perspective.\" Journal of Educational Psychology 100.2 (2008): 322. [2] B. A. Hamdan, “Neural network principles and its Application,” Webology, vol. 19, no. 1, pp. 3955–3970, 2022. [3] Wang, Dongyang, Junli Su, and Hongbin Yu. \"Feature extraction and analysis of natural language processing for deep learning English language.\" IEEE Access 8 (2020): 46335-46345. [4] Waluyo, Budi, and Benjamin Panmei. \"English Proficiency and Academic Achievement: Can Students\' Grades in English Courses Predict Their Academic Achievement?.\" Mextesol Journal 45.4 (2021): n4. [5] Y. Zhang, “English teaching evaluation system based on Big Data,” in Proceedings of the 2021 4th International Conference on Information Systems and Computer Aided Education, Dalian, China, September 2021. [6] H. Zhang, “Analysis and research on college English teaching based on humanities education,” in Proceedings of the 3rd International Conference on Education & Education Research (EDUER 2018), Xi’an, China, January 2019. [7] Qi, S., Liu, L., Kumar, B.S. and Prathik, A., 2022. An English teaching quality evaluation model based on Gaussian process machine learning. Expert Systems, 39(6), p.e12861. [8] C. Zhang and Y. Guo, “Retracted article: mountain rainfall estimation and online English teaching evaluation based on RBF neural network,” Arabian Journal of Geosciences, vol. 14, no. 17, p. 1736, 2021. [9] M. Ji, Y. Liu, M. Zhao et al., “Use of machine learning algorithms to predict the understandability of health education materials: development and Evaluation Study,” JMIR Medical Informatics, vol. 9, no. 5, Article ID e28413, 2021. [10] Fu, J., Chiba, Y., Nose, T. and Ito, A., 2020. Automatic assessment of English proficiency for Japanese learners without reference sentences based on deep neural network acoustic models. Speech Communication, 116, pp.86-97. [11] Soni, Madhvi, and Jitendra Singh Thakur. \"A systematic review of automated grammar checking in English language.\" arXiv preprint arXiv:1804.00540 (2018). [12] Ma, N., 2022. Research on Computer Intelligent Proofreading System for English Translation Based on Deep Learning. Wireless Communications and Mobile Computing, 2022. [13] Li, Yuanyuan. \"Deep Learning-Based Correlation Analysis between the Evaluation Score of English Teaching Quality and the Knowledge Points.\" Computational Intelligence and Neuroscience 2022 (2022). [14] Sinclair, Jeanne. Using machine learning to predict children’s reading comprehension from lexical and syntactic features extracted from spoken and written language. University of Toronto (Canada), 2020. [15] Maltoudoglou, Lysimachos, Andreas Paisios, and Harris Papadopoulos. \"BERT-based conformal predictor for sentiment analysis.\" Conformal and Probabilistic Prediction and Applications. PMLR, 2020
Copyright
Copyright © 2024 Animesh Talukder, Surath Ghosh. This is an open access article distributed under the Creative Commons Attribution License, which permits unrestricted use, distribution, and reproduction in any medium, provided the original work is properly cited.

Download Paper
Paper Id : IJRASET58936
Publish Date : 2024-03-11
ISSN : 2321-9653
Publisher Name : IJRASET
DOI Link : Click Here
 Submit Paper Online

