Ijraset Journal For Research in Applied Science and Engineering Technology
- Home / Ijraset
- On This Page
- Abstract
- Introduction
- Conclusion
- References
- Copyright
A Review of Environmental Conditions between Planned and Unplanned Urbanization with Special Emphasis on Kalyani and Ranaghat Urban Areas
Authors: Suvajit Paul, Rini Basu
DOI Link: https://doi.org/10.22214/ijraset.2024.64736
Certificate: View Certificate
Abstract
Urban settlements in India are generally classified as planned or unplanned as opposed to planned or unplanned urban areas due to land use and taking into account various factors including physical social and economic considerations and land use patterns. Rapid urban growth in India, mostly in an unplanned fashion, is currently a major problem. Urban growth occurs through replacement of vegetation, agricultural areas, wetlands, etc. This results in an unprecedented increase in heat, which dominates the microclimate of urban areas and creates an environmental crisis. Geospatial technology plays a unique role in planned and unplanned urban areas of West Bengal by monitoring spatio-temporal changes in urban heat by estimating land surface temperature and analyzing built-in indices of vegetation cover. It can be classified as NDVI and NDBI suggests that urban heat is controlled by surface character which is analyzed for proper planning for sustainability of urban areas.
Introduction
I. LITERATURE REVIEW
As Well-structured literature review is characterized by a logical flow of ideas, consistent, appropriate referencing style with current and relevant references, correct use of terminology and an unbiased and comprehensive view of previous research on the topic for the purpose. In the present study, the research project has gone through several relevant books, monographs printed and online journals, web articles etc.
For the use of in-depth evaluation of the project. This paper presents a review of the literature dealing with planned and unplanned urbanization its impact on environmental conditions.
The literature review provides an overview of the motivation and scope of the review, as well as examining background knowledge and relevant methods and techniques that may influence the paper. In view of the above analysis, it seems relevant here to review some past works related to the topic under study.
The state of the field comes from urban planners and geographers in various aspects of spatial analysis of planned and unplanned urban growth and impacts on the environment.
A. Literature
- Impact of urbanization, immigration on zahedan city in iran. The unsystematic expansion of cities and lack of urban development poses challenges in the developing countries. Unplanned urbanization in zahedan city has an adverse effect on infrastructure, economical and cultural heterogeneity and expansion of slums ; edited by asamin, e., isa. H.e.and mahesh j.m. (2007).
- spatio temporal analysis of environmental criticality: planned versus unplanned urbanization ; edited by r mallick, k dikkila bhutia, s roy, m nandi, p dash, k mukherjee (2021).
- Investigation of long-term impacts of urbanization and global warming in a coastal tropical region. In agu fall meeting abstracts 2010 b21e-0369 ; edited by comarazamy, d.e., gonzalez, j. And luvall, j.c., 2010, december.
- temperature-land cover interactions: the inversion of urban heat island phenomenon in desert city areas remote sensing of environment 130 136-152 ; edited by lazzarini, m., marpu, p.r. And ghedira, h., 2013.
- Land cover influences on lst in two proposed smart cities of india: comparative analysis using spectral indies land 9 (9) 292 ;
- Malik, m,s., shukla, j, p., & mishra. S., 2019. Relationship of lst, ndbi, and ndvi using landsat-8 data in kandaihimmat watershed, hoshangabad, india.
II. INTRODUCTION
Urban areas, because they provide employment opportunities, educational resources, transport and communication facilities and higher standards of living, can be considered as the birthplace of human civilization and culture. Globally, especially in poor countries, remarkable progress has been made in humanitarian affairs. Urban areas show a higher level of civilization in terms of amenities, labor potential and infrastructure.
The concentration of opportunity and economic activity in urban hotspots makes migration more attractive. As the human economy has shifted from an agrarian to an industrial one, large tracts of farmland and green space have gradually turned into buildings, highways, factories, and other structures. Cities' water and heating budgets are greatly affected by changes in land use patterns. Because natural processes are interconnected, changes in land cover characteristics have affected surface-atmosphere interactions, altering urban microclimates.
A major effect of turning bare ground and green spaces into impermeable concrete and asphalt structures is the progressive warming of cities, a phenomenon noted. "Urban Heat Islands." Analysis of the UHI phenomenon requires examination of land surface temperature (LST) with an emphasis on the contribution of human activities to the radiation budget. Numerous scholars have examined how urban sprawl primarily determines the geographic distribution of LST. Type and Extent of Metropolitan. Broad is a sign of both the type of urban planning a city has chosen and the speed at which it is growing. As a result, planned and unplanned cities have different LST patterns.
Compared to planned cities, unplanned cities have more serious environmental problems. Planned cities provide ample space for open spaces, greenery, wide roads, spaces between buildings, etc.
Thermal infrared (TIR) ??bands can be used by remote sensing instruments like Landsat Thematic Mapper (TM), Enhanced Thematic Mapper Plus (ETM+), Operational Land Imager (OLI) etc. to record LST data. Also several TIR bands of imaging with medium resolution. A suitable way to record the UHI phenomenon at different spatial scales is to use the spectrora diometer (MODIS) sensor. Sensors in the thermal infrared (TIR) ??spectral region, which are often employed to estimate LST, capture radiant energy emitted directly from the land surface. The strength of the UHI effect is shown by the difference in LST between built-up and unbuilt-up urban surfaces.
With case studies of Kalyani and Ranaghat cities respectively, the present study compares the spatiotemporal pattern of LST in planned and unplanned cities and how it relates to surface characteristics and environmental criticality. LST, NDVI, and NDBI are calculated by research from publicly available satellite data.
Spatial distribution and correlation between LST and surface parameters (NDVI and NDBI) in 2000, 2010, 2020 and 2024 were studied. Policy makers, administrators and urban planners may find this study useful in making appropriate plans for further development of the city.
III. OBJECTIVES
We are going to present some basic and meaningful objectives from the above mentioned basic discussion on environmental status review between planned and unplanned urbanization.
- The present study focuses on the 'spatiotemporal' profile of LST in planned and unplanned urban areas with respect to surface characteristics and environmental aspects or problems.
- To examine and compare 'spatiotemporal increase or decrease in vegetation cover' in planned and unplanned urban areas.
- Examining 'Thermal Impact' as an Environmental Critique in Planned and Unplanned Urban Areas.
- To examine changes and impacts on 'land cover' in planned and unplanned areas and emergence of environmental criticality.
From the above description of the four supreme objectives, we are going to analyze and describe the situation with the help of geospatial tools and technologies.
IV. STUDY AREA
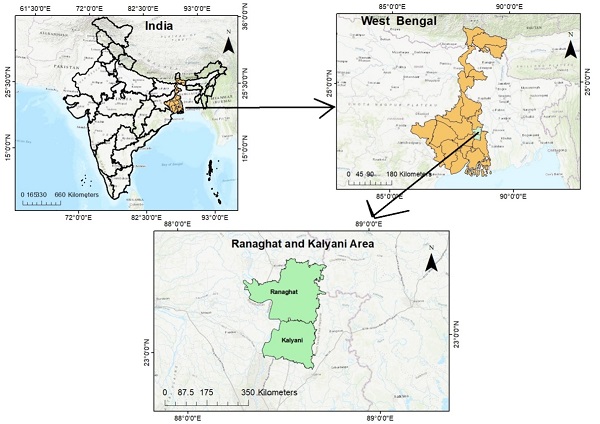
Figure1: The geographical location of Kalyani and Ranaghat area.
V. ANALYSIS OF STUDY AREA
The municipal area of ??Kalyani is located in the northern part of the Kolkata Metropolitan District, about 48 km from Kolkata. The city of Kalyani is subject to the influence of urbanization and development in the northern suburbs of Kolkata, which are respectively termed as the last influence of the Kolkata metropolis. It developed along the twin axis of the Hooghly River and along the railway line connecting Kolkata with North Bengal and Assam. Kalyani is also connected to NH 34 and State Highway 1 by Barrackpore Expressway. Kalai is located between 22.53 and Kalyani is a well-planned, modern suburb, a low-lying town on the banks of the Hooghly River. The area was backfilled with sand and the natural drainage system was disrupted. But with good drainage, the city has developed into a well-planned modern city.
Kalyani city has a very good drainage system and an underground drainage system, which helps make the city a well-planned city. Kalyani city has become a highly planned and model city due to good construction.
Kalyani has several large clean water bodies and regulated water bodies to protect its ecosystem, but the city of Kalyani has grown rapidly in unplanned settlements. Most of them migrated here from rural areas and settled in about 55 slums.
It does not fall under the original plan for which this city was built. Slum population is about 50 percent of the total population, unplanned agglomeration of population mostly around fresh water bodies and threatening the natural environment of the city and distribution.24.09N and 88.48E.
Ranaghat is a town and municipality in Nadia district. The city is located just 74 km north of Kolkata and 26 km south of Krishnanagar. Ranaghat is an urban enclave in Nadia district of West Bengal. Ranaghat, as a census town or suburb, is located at 23.177705 N, 88.573553E. Map of Ranaghat 1 and Ranaghat 2 CD Blocks in District Handbook 2011. This subdivision has achieved reasonably high urbanization. 41.68 percent of the population lives in urban areas and 58.32 percent lives in rural areas.
It can be said that Ranaghat being a suburban area has gradually been connected to the metropolitan city, especially through rail communication. Apart from adequate facilities (water distribution system, electricity connection, settlement, medical facilities etc.) the area is now a high-class growing city.
Ranaghat, a city in West Bengal, is rich in history, culture and natural beauty. Ranaghat is a treasure trove of diverse culture, vibrant festivals and ancient history. Ranaghat, known as the gateway to the suburbs, is well connected by road and rail. The city has excellent transport facilities, making it easily accessible from major cities in West Bengal and beyond. Ranaghat Junction railway station serves as an important railway hub for both local and long-distance trains, is home to diverse culture, educational excellence, a bustling weekly market, traditional folk music center and a thriving business hub. The city offers ample opportunities for business growth and development.
From the above description, It can be said that Ranaghat is now continuously spreading as a suburb, as the growth of Calcutta and its neighboring cities, is constantly changing its impact on land use. It can be said that as a result of the growing development of Kolkata and almost all other cities, Ranaghat city is getting a special impression of growing development. Land use is changing, and its impact on environmental conditions is discussed and compared with Kalyani city.
With its well-connected transport system and welcoming community, Ranaghat is an ideal destination for both tourists and individuals looking to settle down. The growth and development of the city over the years has made it a prominent center of education, healthcare and business opportunities.
- In addition, a special review of the impact on environmental conditions has been made. The impact on the environment as the city grows is discussed and its comparison with cities like Kalyani is discussed.
- Similarly Kalyani is a planned city where it finds itself in the form of a modern city, as Ranaghat city is not a planned city, but an amalgamation of both the impact of modernity of the city and its historical. And modern cities are the development and growth of cities. A comparative discussion has been made. However, this problem has been highlighted based on the environmental conditions by analyzing satellite images. For example, replace the spatial extent of vegetation cover and heat concentration. Estimating temperature by observing patterns of land surface temperature and biophysical character and spatiotemporal change of land surface change in biophysical character, e.g. Vegetation Cover Analysis with Prepared Vegetation Index and Beat Up Index. This study can be useful for policy makers, administrators and urban planners to adopt appropriate strategies for the development of both planned and unplanned cities. The present study compares the spatiotemporal phenomena and patterns in the surrounding areas of planned and unplanned cities with the case studies of Kalyani and Ranaghat.
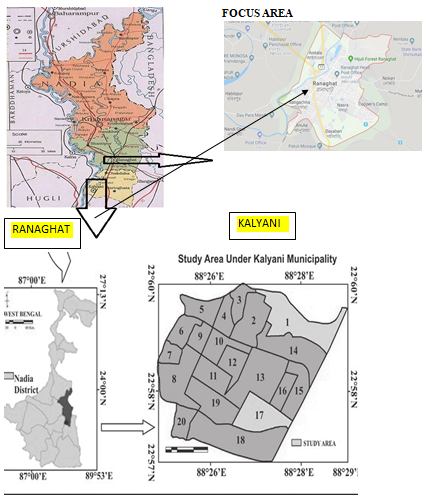
FIG: 1.1: DETAILS OF FOCUS AREA
VI. METHODOLOGY
Methodology is the systematic, theoretical analysis of methods applied in research. A major part of the analysis in this paper is presented through a descriptive, quantitative approach. The aim of the present study is to explore the spatio-temporal changes in ecological complexity in Kalyani and Ranaghat municipal cities or urban areas. The scene is being analyzed in various techniques and images using Arc-GIS, Q-GIS software and satellite images etc.
This study used freely available satellite images from different sensors: Landsat 8 (2020), Landsat 5 (2000). These images were from (WRS) Path 138 and (WRS) Row 44. The purpose of using these images was to collect data for the study and perform trend analysis software used by Google Earth.
FLOW CHART OF METHODOLOGY
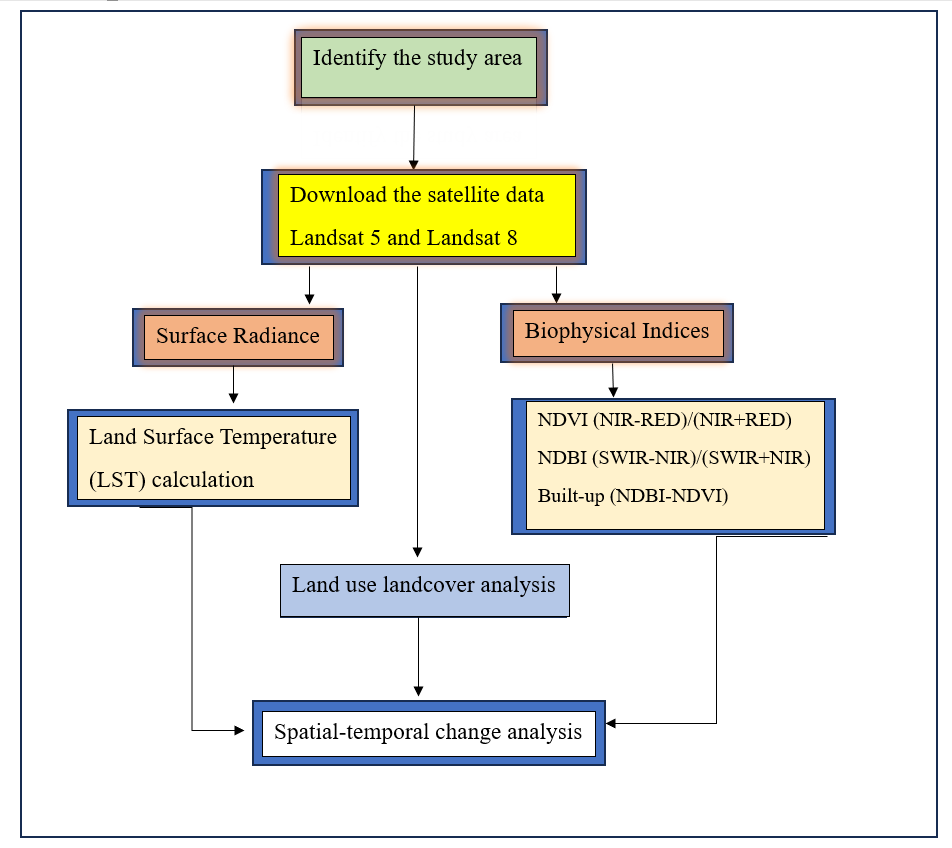
Figure2: Methodological flowchart by using GIS
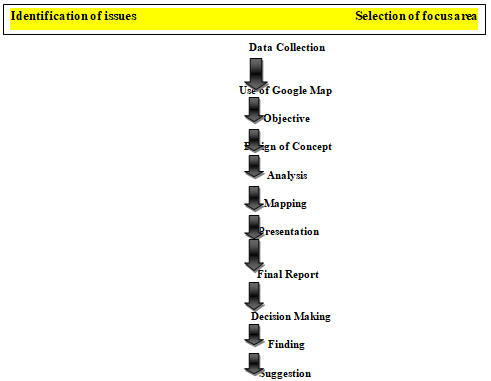
Figure3: Methodological flowchart
VII. IMPORTANT TERMS AND DISCUSSION
1) NDVI: (Normalized Difference Vegetation Index) to determine the density of green on a patch of land, researchers must observe the distinct colors (wavelengths) of visible and near infrared sunlight reflected by the plants. NDVI is calculated with the following expression:
NDVI=(NIR-RED)/(NIR+RED)
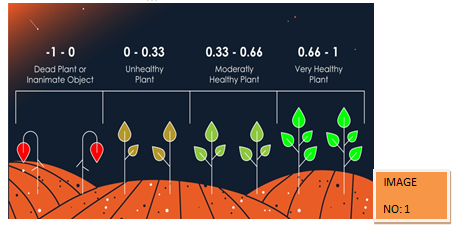
NDVI value range from+1.0 to -1.0 areas of barren rock, sand, or snow usually show very low NDVI values. Sparse vegetation such as shrubs and grassland or senescing crops may result in moderate NDVI values (0.2-0.5) higher positive values of NDVI ranging from sparse vegetation (0.1-0.5) to dense green vegetation (0.6-above) and negative values indicating clouds and water, positive values near zero indicating bare soil. (Band 4-Band 3)/(Band 4+Band 3).
NDVI FRACTIONS: Fractional Vegetation Cover is often estimated as the proportion of green vegetation within a pixel or a region.
Formula: FVC= (NDVI-NDVIMIN)/(NDVIMAX-NDVIMIN)
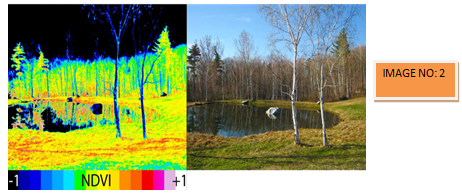
2) NDWI: (Normalized Difference Water Index) is derived from the Near-Infrared and Green channels. This formula highlights the amount of water in water bodies NDWI = (G-NIR)/ (G+NIR). The main advantage of using NDWI is the ability water bodies in a satellite image. Higher NDWI values indicate sufficient moisture, while a low value indicates water stress. Varies between -1 to +1. NDWI formula: (Band 4- Band 2) / (Band 4- Band 2). NDWI is used to identify and map water bodies and such as rivers, lakes, and wetlands.
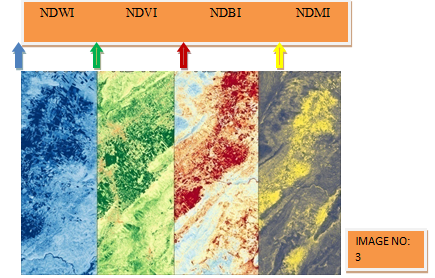
LST: Land Surface Temperature (LST) is a crucial environmental parameter with applications ranging from climate change monitoring to urban planning and agriculture management. This summary provides a concise overview of how to calculate and analyze LST using Landsat 8 imagery and the powerful toolset of Google Earth Engine (GEE).
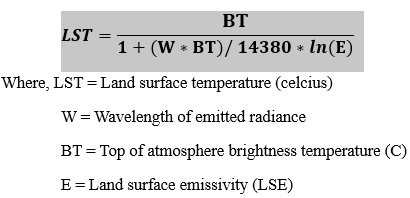
Surface Temperature (LST) refers to the temperature of the Earth’s surface as measured from above. It’s a crucial parameter in understanding the Earth’s energy balance and is utilized in various fields such as climate modeling, agriculture, urban planning, and environmental monitoring. [1] LST is influenced by several factors including solar radiation, land cover type, soil moisture, and human activities. It’s typically measured using remote sensing techniques, primarily from satellites equipped with thermal infrared sensors. These sensors detect emitted thermal radiation from the Earth’s surface, allowing for the calculation of LST. [2] LST helps in monitoring temperature variations across different regions and a times, and assessing the impact of human activities on the environment, including climate studies, and urban heat island analysis.
|
TABLE NO: 1 |
|
LULC INDEXCES |
EQUATION |
|
NDVI |
NDVI=NIR-RED/NIR+RED
|
|
NDWI |
NDWI=GREEN-NIR/GREEN+NIR |
|
NDBI |
NDBI=SWIR-NIR/SWIR+NIR |
|
NDBSI |
NDBSI=(RED+SWIR)-(NIR+BLUE)/(RED+SWIR)+(NIR+BLUE) |
NDBI: (NORMALIZED DIFFERENCE BUILT-UP INDEX) is used to identify and map built-up areas such as building and roads. It is calculated using the near-infrared and shortwave-infrared bands of remote sensing data, and ranges from- to +1. Higher values indicate a higher density of built-up areas.
NDMI: (NORMALIZED DIFFERENCE MOISTURE INDEX) is used to evaluate the moisture content in vegetation. It is calculated using the NIR and mid-infrared bands of remote sensing data, and ranges from –1 to +1. Higher values indicate higher moisture content in vegetation.
Source: http://www.limko.cm/gis-geomatics/2023/06
VIII. RESULT & DISCUSSION
A. Spatiotemporal Change in Urban Environmental Criticality by NDVI, NDBI, NDWI
It is a very effective geospatial tool to interpret and quantify surface vegetation cover and distribution based on urban location under Kalyani and Ranaghat now growing as an emerging city. Surface vegetation cover plays a unique role in reducing heat islands and creating moisture in the area. We focus on how much vegetation cover decreases and increase over time because urban environments are currently threatened by more heat absorption and a lack of surface vegetation and produced heat islands.
All these tools confirm how the urban environment is affected by environmental factors such as NDVI, NDBI, NDWI tools can easily highlight vegetation growth or moisture loss and heat islands in urban areas which can easily highlight the resulting color variations. Vegetation covers the water content and moisture nature of the site.
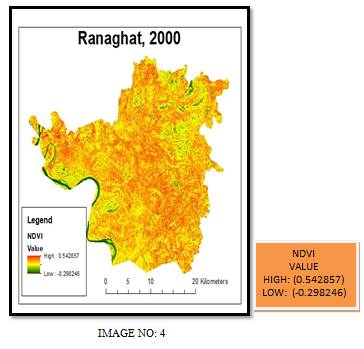
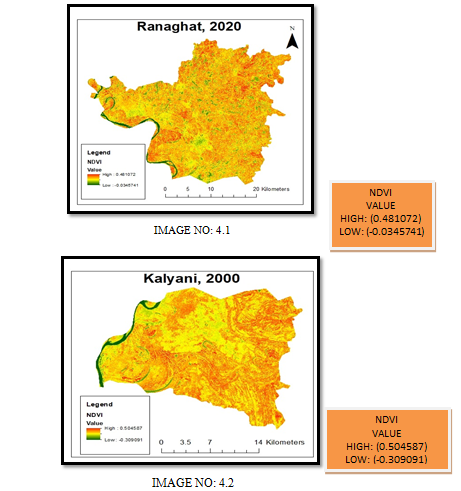
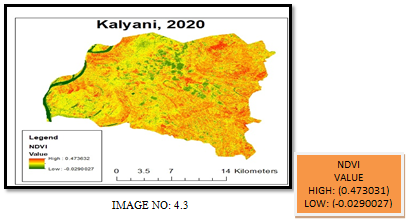
NDVI: Surface vegetation cover in urban areas and the spatiotemporal conversion of surface vegetation cover to built-up cover may be significant for urban heat island phenomena. So in this paper three characters or parameters of NDVI, NDWI, NDBI are developed from satellite data. Calculated as the maximum reflectance of vegetation in the near-infrared spectral region compared to the visible spectrum,
NDVI = (NIR-RED)/(NIR+RED)
From the following figure
NDVI values ??range between -1 and +1, with values ??near +1 indicating dense vegetation cover, and values ??near 0 indicating bare surface.
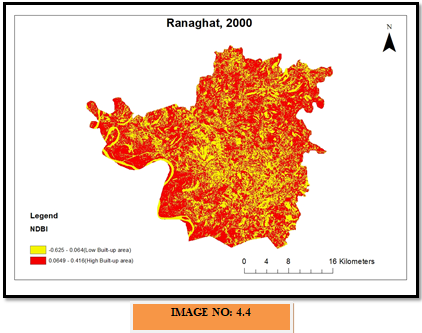
NDBI: These tools are especially used as a detail for urban settlements which are generally high in the short wave infrared band and very low in the NIR band NDBI using the following equation NDBI= (SWIR-NIR)/(SWIR+NIR)
Values ??of NDBI vary between -1 and +1, where higher values ??of NDBI interpret built-up areas and lower values ??represent vegetation and water. However, high-rise built-up areas which are artificial environments pose a threat to human settlement.
NDWI: Normalized Difference Water Index can refer to two indices derived from remote sensing and related to liquid water.
NDWI: The first, proposed by Bo-Cai Gao in 1996, is used to monitor changes in leaf water content, using near-infrared (NIR) and short-wave infrared (SWIR) wavelengths. The combination of the NIR with the SWIR makes it sensitive to changes in liquid water content and in spongy mesophyll of vegetation canopies. This index is useful for studying vegetation in areas affected by drought. It has many applications (agricultural monitoring, crop irrigation, urban environment or moisture content) NDWI= (NIR-SWIR)/(NIR+SWIR)
INDICATION
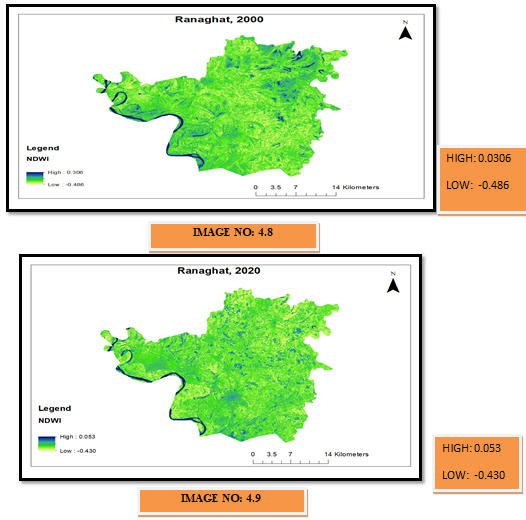
Index values between -1 and 0 correspond to bright surface with no vegetation or water content. Higher index values correspond to water content
The second, proposed by Stuart K. McFeeters in 1996, is used for the water bodies analysis
The index uses Green and Near infra-red bands of remote sensing images that allows it to detect that changes in water content of the water bodies. High NDWI values indicate sufficient moisture, while a low value indicates water stress. This can be useful when looking for water bodies or a change in water level.
NDWI= (Green-NIR)/(Green+NIR)
INDICATION
Index values greater than 0.5 usually correspond to water bodies. Vegetation usually corresponds too much smaller values, built up areas to values between 0 and 0.2.
Remote sensing data is often used for environmental monitoring, studying the condition of vegetation cover, moisture, moisturizing the vegetation cover.
|
TABLE NO: 2 |
LINEAR TREND OF NDVI, NDBI & NDWI
|
URBAN AREA |
|
NDVI |
NDBI |
NDWI |
||||
|
RANAGHAT |
YEAR |
HIGHER |
LOWER |
HIGHER |
LOWER |
HIGHER |
LOWER |
|
|
2000 |
0.542857 |
-0.298246 |
0.0649-0.416 |
(-0.625-0.064) |
0.036 |
-0.486 |
||
|
2020 |
0.481072 |
-0.0345741 |
(-0.124-0.202) |
(-0.346--0.124) |
0.053 |
-0.43 |
||
|
TABLE NO: 3 |
|
URBAN AREA |
|
NDVI |
NDBI |
NDWI |
||||
|
KALYANI |
YEAR |
HIGHER |
LOWER |
HIGHER |
LOWER |
HIGHER |
LOWER |
|
|
2000 |
0.504587 |
-0.309091 |
0.081-0.438 |
(-0.56-0.081) |
0.32 |
-0.471 |
||
|
2020 |
0.473031 |
-0.0290027 |
0.081-0.438 |
(-0.56-0.081) |
0.067 |
-0.43 |
||
KEY DIFFERENCE AMONG NDVI, NDBI & NDWI
|
NDVI |
|
NDBI |
|
NDWI |
|
To assess vegetation health density by measuring the difference between NIR which vegetation strongly reflected & RED LIGHT which vegetation strongly absorbs. |
|
On the other hand NDBI is designed to identify built up areas by exploiting the spectral reflectance properties of urban materials, which differ significantly from natural landscapes. It measures the contrast between the reflectance in the NIR & SHORT WAVE INFRARED bands. |
|
NDWI is particularly useful in water resources management, indicating changes in water availability and distribution within given area. |
|
To evaluating changes in vegetative cover over time. |
|
To highlight the spatial extent of urbanization and its impact on land use and land cover. |
|
|
|
Each of indices the spectral signatures of vegetation, urban area, water bodies to analyze and monitor changes in land use, land cover, and environmental conditions over time. While NDVI & NDWI are more focused on natural resources and environmental monitoring. NDBI is crucial for urban planning and development studies and easy to way of analysis environmental criticality. |
||||
IX. FINDING & LOGICAL DISCUSSION
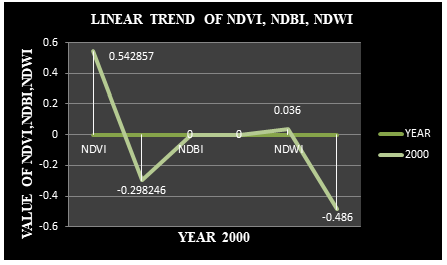
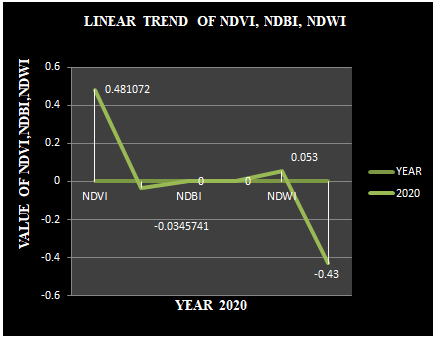
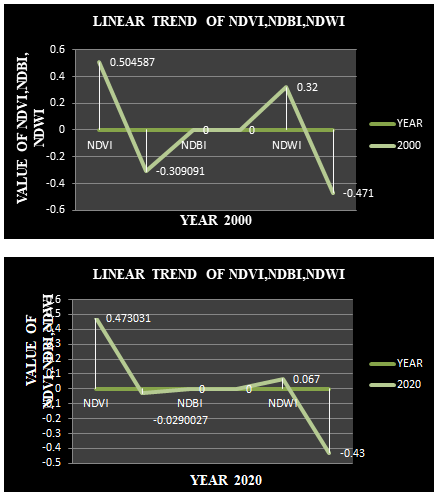
Impacts of planned and unplanned urbanization can be social, environmental or ecological problems. In this paper, Kalyani and Ranaghat (2000 and 2020) have studied the review of environmental conditions between planned and unplanned urbanization with special emphasis. The study uses Landsat Image 8 (2000), Landsat 5 (2020) and compares NDVI with reference years 2000,2020 also maps reference indices for NDWI and NDBI and compares with same years (2000,2020). has been . The results show that the difference between the maximum and minimum values ??of NDVI, NDWI, NDBI for the years 2000, 2020 (Table No: 2 and 3) will be in 2000 and 2020. Trends in the indicators for the dates considered are found to be consistent with human activity, and the significance of these changes is discussed.
X. ANALYSIS OF SURFACE BIOPHYSICAL PARAMETERS
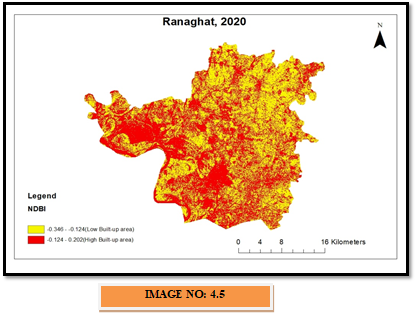
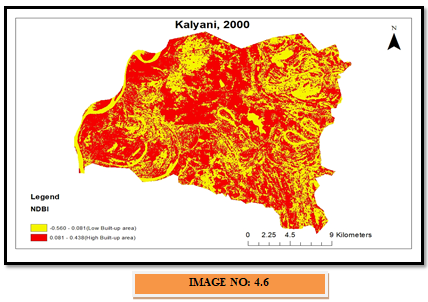
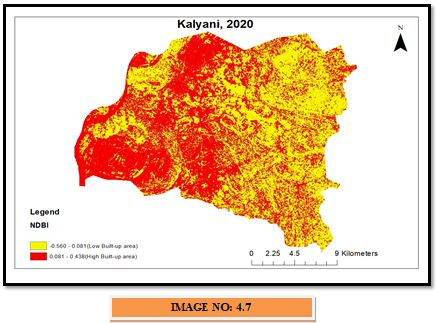
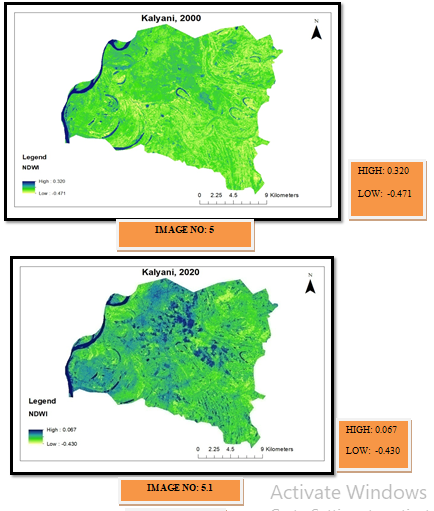
Surface biophysical parameters of the cities were analyzed by exploring the pattern of NDVI and NDBI. Spatial distribution of NDVI and NDBI is depicted in figure (Figure no. 4 to 4.3 and figure no. 4.4 to 4.7), and summary statistics are in Tables 2 and 3. In Ranaghat city, NDVI in 2000 was more concentrated, mostly in 2020. Compared to were covered by vegetation, the deviation from high to low index is 0.594749635 and 0.364616854, 2000 and 2020 respectively. Kalyani city on the other hand is planned and well managed city but the NDVI2000 year index value has decreased in most of these areas compared to 2000. The deviation from high index to low is 0.575357232, 0.355416405 compared to Ranaghat. It is clearly seen that the NDVI is higher towards Ranaghat city and the low index concentration value is slightly higher.
The average NDVI value of Ranaghat town is slightly higher than that of Kalyani. A large decrease in NDVI is observed in the northeastern and central western parts of the city. Expansion of urban area with low NDVI value and high NDBI (High Built Up Area) value in 2020, expansion of built up area and urban density shifted towards river Ganga or western part. The growth of the city indicates destruction of the urban green belt.
Moreover, cities often convert lowlands, wetlands and bare grounds into built-ups without considering their significance in maintaining the balance of the natural environment. It is clearly seen that the data from the Kalyani 2020 image shows that the population has gradually shifted away from the western and central areas due to the neglected land (barren areas) near those places. There the water level has risen indicating an unhealthy environment.
In Ranaghat as an urban area, the sharp increase and decrease of NDBI and NDVI in the municipal urban area from 2000 to 2020 is due to random and drastic and uneven changes in land use and land cover such as residential buildings, concrete roads and land cover. Uneven distribution of construction, footpaths, commercial areas, reflects the growth of urban areas in an unplanned fashion.
The distribution of settlements in Kalyani town is concentrated in a privileged area and facilities as compared to the Ranaghat Municipal town area.
Being a planned city, there is a large number of vegetation cover, barren land, residential areas, water bodies agricultural fields, open spaces, playgrounds, lakes, commercial areas, residential areas, rather settlements are more or less evenly distributed and isolated from each other green spaces across the city.
XI. CONCEPT OF LST (LAND SURFACE TEMPERATURE)
Global urban expansion is developing at different spatial temporal scales under rapid population and economic growth. Urban expansion changes land use and land cover and brings many environmental or ecological problems. In particular, the combination of rapid urban expansion and climate warming has increased heat stress in cities or towns. Large amounts of natural vegetation and agricultural land were replaced by man-made impervious surface areas, resulting in changes in surface temperature and local climate.
LST is an index that shows the biosphere-land-ocean-atmosphere interaction and surface energy balance, and it can reflect the thermal response of urban canopy, building height, surface coverage, anthropogenic heat and energy consumption with the development of Earth observation technology, a range of remotely sensed datasets have been used to characterize LST and investigate thermal changes across satellite thermal infrared LST of urban environments, theoretically based on the radiative transfer equation, have been extensively studied focusing on signal-channel, sliding window and multi-channel. Algorithms For example, Landsat and Moderate Resolution Imaging Spectroradiometer (MODIS) data are intensively used in LST studies at different spatiotemporal scales. Landsat data with a higher spatial resolution of 60 m or 100 m are more suitable for LST thermal band investigations.
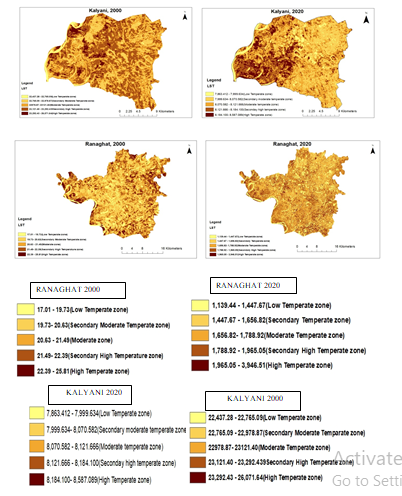
XII. SPATIO TEMPORAL CHANGE OF LAND SURFACE TEMPERATURE
XIII. ANALYSIS OF LST
The city in Kalyani reflects a high temperature zone increasing towards the southern and western part of the region compared to 2000, it is clear that most of the region is concentrated in the middle and high temperature zone in 2000, it is clear that the south western part has moderate to lower NDVI and NDWI compared to the NDBI values ??of Kalyani. The values ??show, in addition, that the growth of the medium to high LST zone is increasing rapidly towards the southwest part Overall, the extent of high temperature zones has increased due to land use and land cover changes, but since 2000 the overall landscape is changing due to the massive increase in urban areas, population density, and the effects of migration. Low values ??of LST reflect its association with high NDVI, NDWI values ??under the central and eastern parts of the area. The presence of vegetation, open space, water bodies and cropland in this section can be highlighted at low LST. Thus, this explanation reflects the role of surface biophysical properties in controlling surface temperature.
The Ranaghat Municipal city area also showed a significant increase in the extent of high LST zones compared to 2000, attributing such changes in LST to increased compactness and settlement in various major pockets of the city area. Such changes have reduced the spatial coverage of secondary moderate, moderate and secondary high temperature zones. Likely near Kalyani, Ranaghat also reflects increased spatial variation in LST, but to a relatively lesser degree.
However, this analysis shows that with increasing population pressure and consequent increase in built-up, the area planning strategy of Kalyani city and Ranaghat municipal city has become effective in controlling LST.
Conclusion
This paper contributes to the comparative study of spatial variation in land surface biophysical properties NDVI and NDBI and satellite images in LST between planned and unplanned cities in environmental criticality. Estimated LST, NDVI, NDBI, NDWI for the period 2000-2020 showed an uneven and heterogeneous trend for both Ranaghat and Kalyani. Notably, Kalyani had a higher percentage of built-up area than Ranaghat. Later rapid and uneven urban growth in Ranaghat resulted in an increase in built-up area and thereby decrease in NDVI, NDWI. The study found that Ranaghat was replaced by vegetation and open space by rapid and unplanned urban development from 2000-2020. The spread of urban sprawl is also evidenced by the changes analyzed by NDVI and NDBI for this period. On the other hand, Kalyani has also shown an increase in built-up area and similar changes in NDVI and NDBI. However, the increase in Kalyani is relatively moderate compared to Ranaghat.
References
[1] Tian, M., Wang, P. and Sun , W., 2010. A Review of Retrieving of Land Surface Parameters Using the Land Surface Temperature – Vegetation Index Feature Space Advances in Earth Science 25 (7) 698-705. [2] Dousset, B. and Gourmelon, F., 2003 . satellite multi sensor data analysis of urban surface temperatures and Land Cover ISPRS journal of photogrammetry and remote sensing 58 (1-2), 43-54. [3] Pu, R., Gong, P., Michishita, R. and Sasagawa, T., 2006. Assessment of multi-resolution and multi-sensor data for urban surface temperature retrieval Remote Sensing of Environment 104(2) 211-225. [4] Lu, D. and Weng, Q., 2006. Use of impervious surface in urban land-use classification Remote sensing of environment 102(1-2) 146-160. [5] Fu, P. and Weng, Q., 2016. A time series analysis of urbanization induced land use and land cover change and its impact on land surface temperature with Landsat imagery Remote sensing of environment 175 205-214. [6] Zhang, X., Zhong, T., Feng, X., Wang. K . 2009. Estimation of the relationship between vegetation patches and urban land surface temperature with remote sensing International Journal of Remote Sensing. 30 (8) 32-45. [7] Srivastava, P.K., Majumder, T.J. and Bhattacharya, A.K., 2009. Surface temperature estimation in Singhbhum Shear Zone of India using Landsat-7 ETM+ thermal infrared data Advances in space research 43 (10) 1563-1574.
Copyright
Copyright © 2024 Suvajit Paul, Rini Basu. This is an open access article distributed under the Creative Commons Attribution License, which permits unrestricted use, distribution, and reproduction in any medium, provided the original work is properly cited.

Download Paper
Paper Id : IJRASET64736
Publish Date : 2024-10-22
ISSN : 2321-9653
Publisher Name : IJRASET
DOI Link : Click Here
 Submit Paper Online

