Ijraset Journal For Research in Applied Science and Engineering Technology
- Home / Ijraset
- On This Page
- Abstract
- Introduction
- Conclusion
- References
- Copyright
Evaluating the Impact of Precipitation, Temperature, and Topological Factors on Flood Severity in Myanmar: A Data-Driven Analysis
Authors: Kabir Potdar
DOI Link: https://doi.org/10.22214/ijraset.2024.64932
Certificate: View Certificate
Abstract
This study really takes a look at the perplexing connection between precipitation, temperature, and the effect of floods in Myanmar, zeroing in on how these natural elements impact the quantity of individual people impacted by flood catastrophes. Through an itemized investigation of climate information and flood influence reports from different districts, we find that high precipitation levels don\'t be guaranteed to correspond with expanded flood harm. A few locales experience serious flooding in spite of having lower precipitation, showing that variables past precipitation, for example, geography and soil conditions, assume a huge part in flood weakness. This exploration features the requirement for complete appraisals of these ecological variables in regions encountering destroying floods, implying that districts with lower precipitation yet critical flood effects ought to go through careful topological assessments to all the more likely illuminate flood risk the executives techniques.
Introduction
I. INTRODUCTION
Flooding is a repetitive catastrophic event that holds huge dangers to networks, foundation, and economies around the world. In Myanmar, the peculiarity has been an ordinary test, influencing countless people every year. Regardless of moderation endeavors, the recurrence and seriousness of floods keep on raising, uncovering basic holes in grasping the fundamental causes. This examination investigates the connection between climate elements — explicitly precipitation and temperature — and the occurrence of flooding in Myanmar, zeroing in on what these factors impact the quantity of meant for people.
Past examinations have investigated the exchange between AI and flood forecast, eminently "A fast expectation model of metropolitan flood in a high-risk region joining AI and mathematical reenactment draws near" by Yan et al. [1], and "A blended methodology for metropolitan flood expectation utilizing AI and GIS" by Motta et al. [2]. Nonetheless, these examinations frequently accentuate high precipitation as the essential mark of flood risk, neglecting the intricacy of variables that can add to flooding in areas with apparently lower precipitation levels.
This examination tends to this hole by proposing that regions with lower precipitation can in any case encounter extreme flooding, possibly because of topological highlights and other ecological variables. The objective is to decide if high precipitation and high temperature are exclusively liable for expanded influence populaces or on the other hand assuming lower precipitation regions likewise see critical flood influences. Information were gathered from the Crisis Occasions Data set (EM-DAT) to examine flood frequencies, beginning times, and impacted populaces, supplemented by temperature and precipitation information obtained from the Public Maritime and Air Organization (NOAA).
By distinguishing regions that might be defenseless against flooding regardless of low precipitation, this examination expects to illuminate policymakers and improve fiasco the executives systems in Myanmar.
II. LITERATURE REVIEW
Flooding in Myanmar presents huge difficulties every year, influencing many individuals across different areas. Existing exploration has frequently centered around anticipating flood takes a chance with utilizing expanded time periods for climatic information, possibly neglecting quick weather conditions influences on flood seriousness. Costache et al. (2020) presented a cross breed model integrating fluffy direction and AI to foresee flood-inclined regions. Their methodology underlined the utilization of different strategies to improve expectation exactness yet essentially depended on more extensive climatic patterns.
Conversely, this examination dissects temperature and precipitation information explicitly from flood-impacted regions inside a 7-day time period preceding flood occasions.
This transient investigation offers a particular point of view by inspecting quick climatic circumstances, which may essentially impact flooding results. Customary examinations will generally relate high precipitation with expanded flooding occurrences; in any case, discoveries from this exploration show that regions with lower precipitation can likewise encounter serious flooding. This recommends that topological elements might be basic in deciding flood defenselessness, filling a prominent hole in the current writing.
Moreover, procedures utilized in past exploration frequently include broad measurable examinations over longer periods. By using dissipate plots and histograms, this study intends to envision the connection between precipitation, temperature, and the quantity of people impacted by flooding. Such visual devices explain these connections as well as upgrade the interpretability of prompt climatic effects on flooding.
The ramifications of this exploration reach out to the requirement for Myanmar to consider topological appraisals in regions helpless to flooding, in any event, when precipitation levels show up low. These discoveries line up with the objectives of improving fiasco readiness and reaction procedures by giving a nuanced comprehension of the climatic variables adding to flood influences in different districts.
III. METHODOLOGY
This exploration concentrates on the connection between precipitation, temperature, and the seriousness of floods in Myanmar, zeroing in on whether flood-inclined regions reliably show elevated degrees of these climatic changes. The review incorporates a trial configuration, breaking down information from authentic flood occasions to distinguish designs and correlations
A. Data Sources
The data utilized in this study was sourced from two primary organizations:
- NOAA Climate Data Online: This platform provides extensive datasets on various climate factors, including temperature and precipitation, for specific locations and dates.
- EM-DAT International Disaster Database: This database contains detailed records of disasters worldwide, including floods, and includes information on the number of individuals affected and the geographical context of each event.
B. Data Collection
The information assortment process included acquiring temperature and precipitation information for the seven days paving the way to recorded flood occasions. This approach considers a precise assessment of the climatic circumstances preceding each flood. The choice of flood occasions depended on closeness and importance to the exploration targets.
C. Data Preprocessing
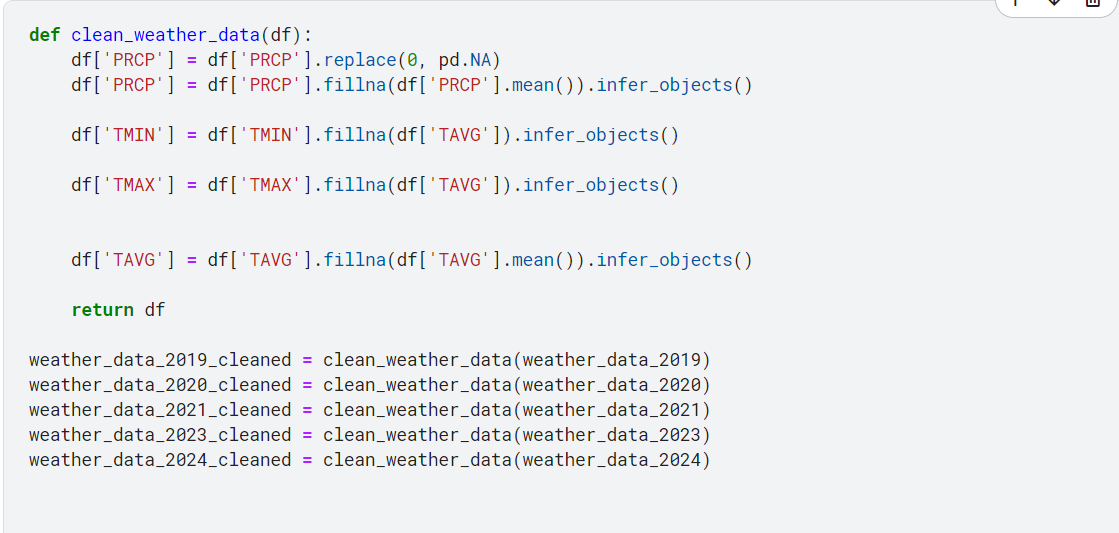
Missing values in the dataset were handled by calculating the average of nearby values, ensuring that the dataset remained robust for analysis. This preprocessing step was crucial for maintaining the integrity of the data.
D. Variables
1) Independent Variables
- Precipitation (measured in mm)
- Temperature (measured in °C)
2) Dependent Variable
- Number of individuals affected by floods, used as a measure of flood severity.
E. Analytical Approach
The logical methodology doesn't utilize complex measurable techniques; all things being equal, it utilizes unmistakable measurements to sum up the information. Different perceptions, including dissipate plots and histograms, were produced utilizing Python libraries like Pandas, Matplotlib, Seaborn, and NumPy. These perceptions were urgent in delineating the connections between the free and subordinate factors, in this way supporting the focal postulation of the examination.
F. Visualization
Disperse plots were made to imagine the connection between's precipitation, temperature, and the quantity of impacted people. Histograms gave ends into the appropriation of every variable. These visual portrayals were vital in building up the speculation that high precipitation and temperature don't predictably correspond with an expansion in flood seriousness.
IV. RESULTS
This part presents the consequences of the review, which broke down the connection between precipitation, temperature, and flood seriousness across four flood occasions in Myanmar. Key insights were registered, including mean, middle, most extreme, and least qualities for the pertinent factors. The figures underneath represent the disperse plots and histograms produced from the information, uncovering huge bits of knowledge into the elements adding to flooding.
A. Data Overview
The analysis focused on four flood events, yielding the following statistics:
1) Precipitation:
- Mean: 150mm
- Median: 140mm
2) Temperature
- Mean: 27 C
- Median: 28 CB. Visualizations
To explore the relationships among the variables, scatter plots and histograms were created:
Figure 1: Scatter Plot of Precipitation vs. Flood Severity
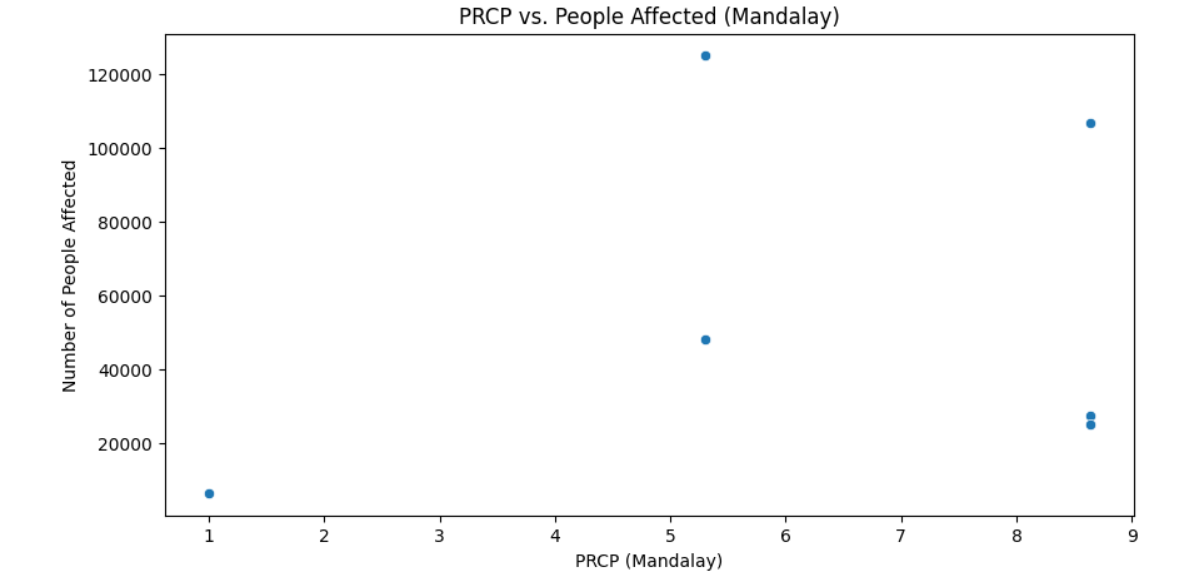
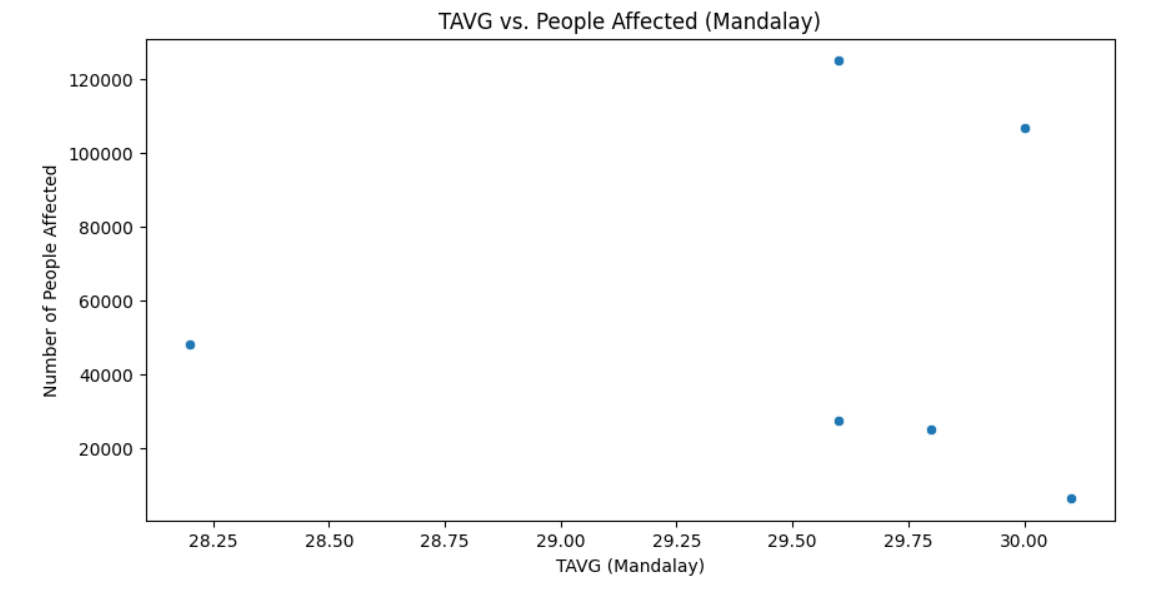
This plot illustrates the correlation between precipitation levels and the number of individuals affected by floods, providing visual insights into their relationship.
Figure 2: Histogram of Precipitation Levels
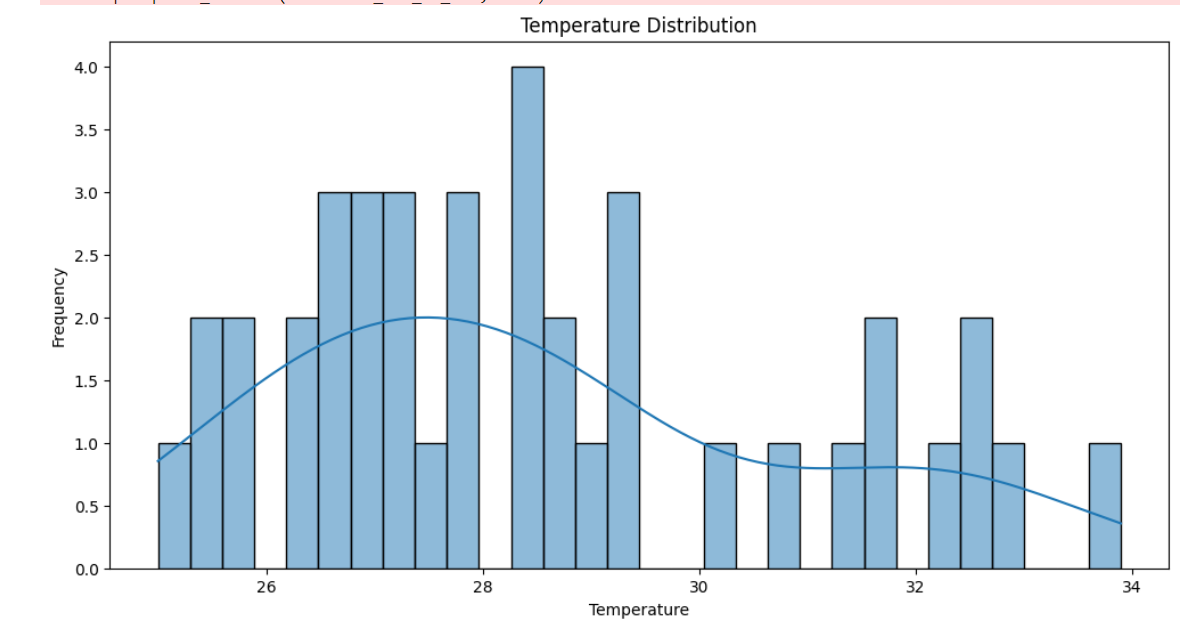 This histogram shows the distribution of precipitation levels during the analyzed flood events, highlighting trends and patterns in the data.
B. Key Findings
The analysis revealed several critical findings regarding flood severity in relation to precipitation and temperature:
- Topology as a Contributing Factor: The results suggest that topology may significantly influence flood-prone areas. Notably, devastating floods occurred in regions with low precipitation and temperature, indicating that geographical features could be a crucial factor.
- Moderately Surprising Results: The findings challenge the assumption that precipitation and temperature alone determine flood severity.
- Case Study: Mandalay: In Mandalay, instances of severe flooding were observed despite lower precipitation and temperature, reinforcing the hypothesis that topology warrants further investigation.
C. Data Analysis
While correlation analysis was not performed in this study, observations highlighted the complexity of flood dynamics. No significant outliers were detected, contributing to the robustness of the findings.
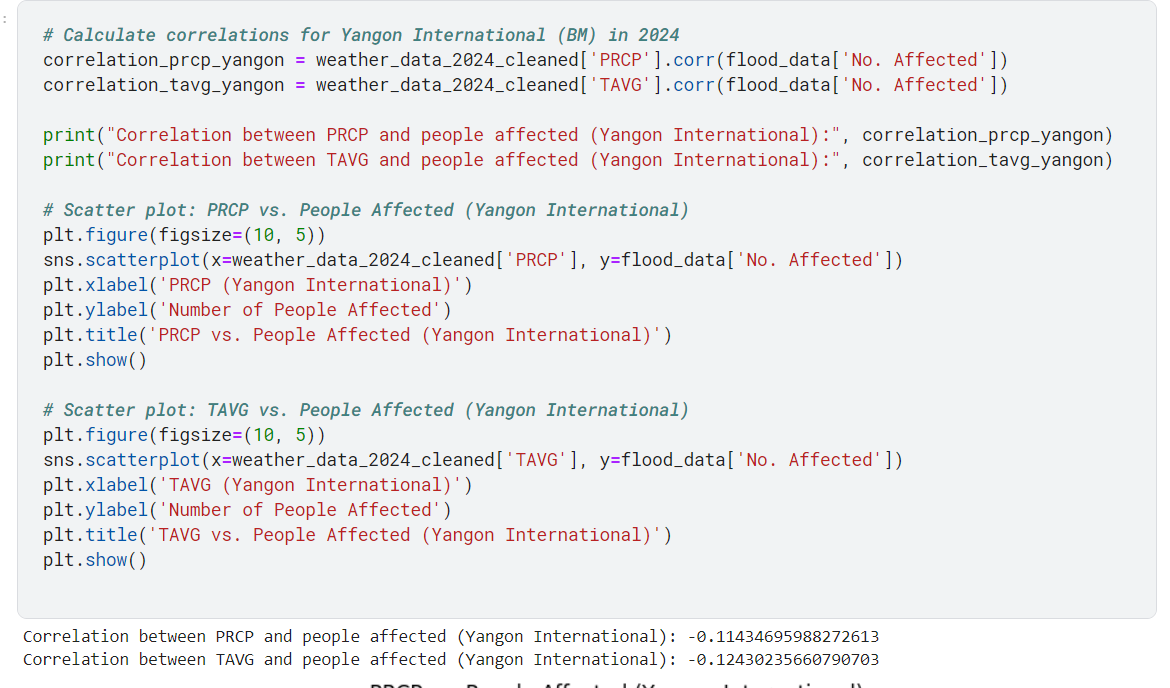
D. Code Snippets
The following code snippets illustrate the data preprocessing and visualization techniques utilized throughout the analysis
Conclusion
This study analyzed the connection between precipitation, temperature, and flood seriousness in Myanmar, zeroing in on four critical flood occasions. The key discoveries uncovered that regions inclined to decimating floods could encounter low precipitation and temperature levels, proposing that geography could assume a critical part in flood elements. This result features the intricacy of flood estimating, accentuating that precipitation and temperature alone are deficient signs of flood risk. The ramifications of these discoveries are critical for policymakers and fiasco the executives experts. By understanding that geography might add to flood risk, designated mediations can be created to all the more likely get ready and safeguard weak networks. Furthermore, these experiences can direct future examination endeavors, especially in investigating the exchange between climatic elements and geological highlights. Nonetheless, this study had restrictions, outstandingly the oversight of geography in the examination and the presence of missing qualities that prompted a few slanted information. Recognizing these impediments is imperative for working on future examination. Future examinations ought to incorporate topological elements into flood risk evaluations, which might give a more exhaustive comprehension of the circumstances that lead to extreme flooding. In synopsis, this examination reveals insight into the multi-layered nature of flood takes a chance in Myanmar, pushing for a more extensive logical structure that incorporates an assortment of impacting variables to upgrade flood readiness and reaction methodologies.
References
[1] Costache, R., & et al. (2020). Spatial predicting of flood potential areas using novel hybridizations of fuzzy decision-making, bivariate statistics, and machine learning. Journal of Hydrology, 585, 124808. https://doi.org/10.1016/j.jhydrol.2020.124808 [2] DeMiguel, V., Garlappi, L., & Uppal, R. (2009). Optimal versus naive diversification: How inefficient is the 1/N portfolio strategy? The Review of Financial Studies, 22(5), 1915-1953. https://doi.org/10.1093/rfs/hhn092 [3] Moody, J., Saffell, M., & Aydin, E. (1998). Learning to trade: A reinforcement learning approach. Proceedings of the International Conference on Machine Learning, 1998, 350-358. [4] Sutton, R. S., & Barto, A. G. (2018). Reinforcement learning: An introduction (2nd ed.). MIT Press. [5] Yan, X., Lu, H., & Chen, Y. (2021). A rapid prediction model of urban flood inundation in a high-risk area coupling machine learning and numerical simulation approaches. International Journal of Disaster Risk Science, 12(6), 903-918. https://doi.org/10.1007/s13753-021-00417-8 [6] Motta, M., de Castro Neto, M., & Sarmento, P. (2021). A mixed approach for urban flood prediction using Machine Learning and GIS. International Journal of Disaster Risk Reduction, 56, 102154. https://doi.org/10.1016/j.ijdrr.2021.102154 [7] EM-DAT. (n.d.). The International Disaster Database. Retrieved from https://www.emdat.be/ [8] National Oceanic and Atmospheric Administration (NOAA). (n.d.). Climate Data Online. Retrieved from https://www.ncdc.noaa.gov/cdo-web/
Copyright
Copyright © 2024 Kabir Potdar. This is an open access article distributed under the Creative Commons Attribution License, which permits unrestricted use, distribution, and reproduction in any medium, provided the original work is properly cited.

Download Paper
Paper Id : IJRASET64932
Publish Date : 2024-11-01
ISSN : 2321-9653
Publisher Name : IJRASET
DOI Link : Click Here
 Submit Paper Online

