Ijraset Journal For Research in Applied Science and Engineering Technology
- Home / Ijraset
- On This Page
- Abstract
- Introduction
- References
- Copyright
Evaluation of Groundwater Quality for Drinking in Various Districts of Jammu and Kashmir with Special Emphasis on Kashmir
Authors: Dr. Bashir Ahmad Pandit
DOI Link: https://doi.org/10.22214/ijraset.2024.64316
Certificate: View Certificate
Abstract
In India, groundwater is a valuable resource for humans, yet human activity has consistently reduced its quality. For the management of groundwater resources to be sustainable, an assessment of the quality of the groundwater is required. With the use of integrated-weight water quality index and multivariate statistical techniques, this study sought to assess the groundwater quality in the Indian area of Kashmir for drinking purposes. Eight water quality measures were included in the data, which came from 50 observation wells and included pH, total hardness, nitrate (NO3?), iron (Fe), lead (Pb), mercury (Hg), arsenic (As), and coliforms. The integrated-weight water quality index (IWQI), principal component analysis (PCA), and cluster analysis (CA) were used to examine various districts. The majority of the metrics, according to the results, were within acceptable ranges, however some areas had excessive hardness and Fe contamination. More than 76% of samples had significant coliform contamination found in them. With four clusters of sample locations, the CA results showed that geological locations had a significant influence on groundwater quality. A PCA\'s three main components may account for 64.8% of the variation in groundwater quality. Groundwater quality was categorized as excellent (74.11%), good (45%), poor (6.4%), very poor (2.9), and undrinkable (9.4) based on IWQI values ranging from 4 to 2761. These classifications were linked to coliform contamination. These results have shed light on the region\'s groundwater quality state, which is helpful in creating a plan to safeguard the water supply.
Introduction
I. INTRODUCTION
In many places of the world, groundwater is an essential source of freshwater for a variety of human requirements. Roughly 43% of the water used for irrigation in agriculture globally comes from groundwater.
A significant supply of water for domestic consumption is groundwater in many regions, particularly in Asia and Africa. The quantity and quality of groundwater resources are under threat from both natural and man-made reasons, notwithstanding their significance. Potential effects of climate change on groundwater include seawater intrusion and a drop in groundwater levels. This water supply has been made worse by the sharp rise in water demand as well as pollution from man-made sources including fertilizer waste and raw sewage.
Anthropogenic stressors are causing the groundwater in Kashmir to diminish in quantity and quality, just like they do in other regions. The region's river and canal systems have been severely contaminated in recent years by waste products from industry, agriculture, and aquaculture. The report claims that untreated wastewater from home sewage pipes and rice intensification is one of the sources of this contamination, as it was dumped directly into surface water bodies. People in India are becoming more dependent on the groundwater supply as a result of this. The average annual fall in the region's groundwater level has been about 0.5 m/year. Numerous groundwater contaminants, such as arsenic, ammonium, nitrate, and chloride contamination, have been documented in the region by earlier investigations. Therefore, it is essential to regularly assess the quality of the groundwater in this area to make sure that it can meet human needs. The standard limit for drinking water is often compared with each important criterion when assessing the quality of groundwater. On the other hand, if every water quality metric is determined separately, there may not be any association between related parameters when assessing groundwater quality.
Multivariate statistical techniques like principal component analysis (PCA) and cluster analysis (CA) are required to provide additional insights into water quality evaluation and enable a better interpretation of the data.
While CA is typically used to group sampling locations with the common qualities of water quality, PCA can be used to find the main factors connected with the water quality and to determine potential pollution sources. In addition, a lot of people use the water quality index (WQI) to evaluate the quality of water and whether it is safe to drink. The subjective weights of the parameters, which are often determined by experts based on the significance of these relevant parameters, are one of the method's limitations. This may result in various weighting values for a single parameter, and the final WQI values will be greatly impacted by even little adjustments. In order to overcome the subjective problem of the traditional approach and generate more accurate and objective WQI values, an integrated-weight method that combines information entropy and the Criteria Importance Through Inter-criteria Correlation (CRITIC) method has been applied. This method takes into account the conflict between each parameter's correlation and changes in data size and value.
Thus, the purpose of this study is to assess the groundwater quality in the Kashmir region using PCA and CA, as well as to ascertain the quality using integrated-weight water quality index (IWQI) methodologies for drinking purposes. The results of this study not only show how important it is to use statistical methods when assessing the quality of groundwater, but they also provide information on the region's groundwater's drinking quality, which is important for future groundwater resource management.
II. METHODOLOGY
A. Study Area
The northernmost UT in India is found in Jammu & Kashmir, which includes the UT of Ladakh. It is located between 32°17' and 36° 58' N in latitude and between 73° 26' and 80° 30' E in longitude. Its overall geographical area is 2,22,236 km^2, of which 78,114 km²are under Pakistani occupation and 5180 km are illegally transferred from Pakistan to China. It also encompasses 37,555 km2 of illegally occupied Chinese territory. India's 30th overall survey All of J&K and Ladakh is covered by degree sheets. The state shares international borders to the north with China and Afghanistan, to the east with Tibet, and to the west with Pakistan. In the south are the states of Punjab and Himachal Pradesh. The majority of the state of Jammu & Kashmir is made up of highly harsh
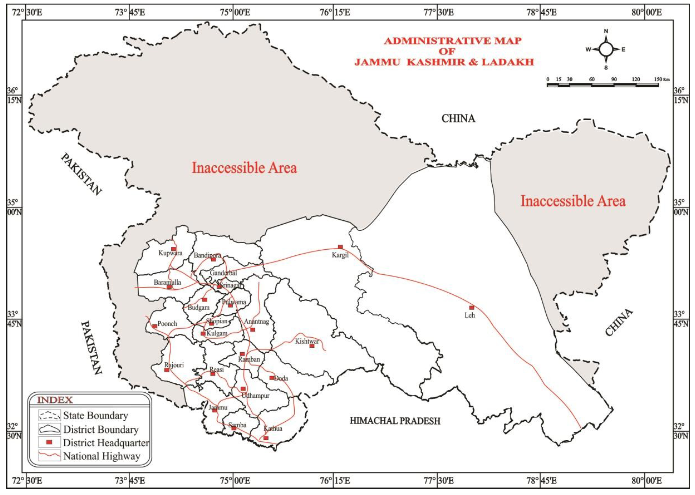
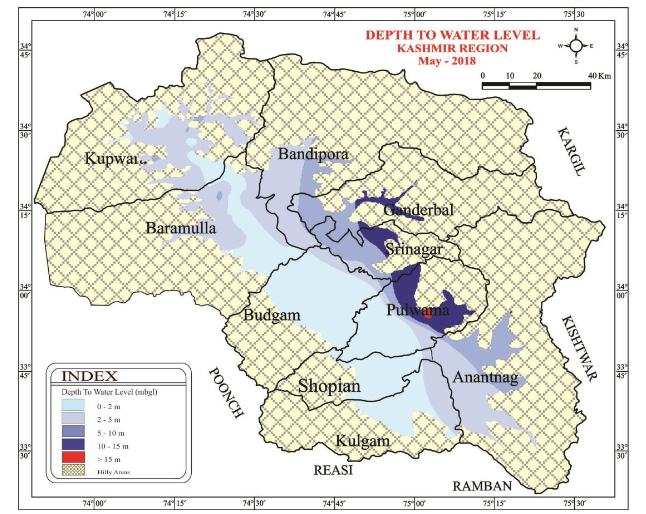
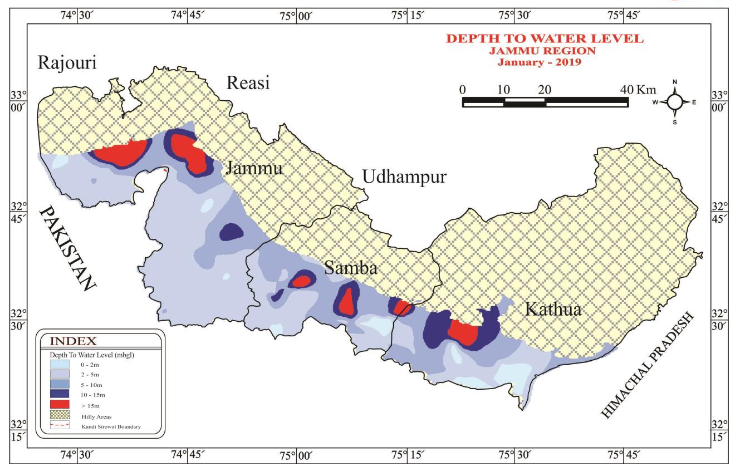
The valley floor is raised between 1500 and 2000 meters above mean sea level. Parts of the districts of Budgam, Pulwama, Srinagar, Anantnag, Baramulla, and Kupwara are included in the 5600 km Kashmir valley.
B. Analysing and Sampling Groundwater
Measurements were made of the following parameters related to water quality: pH, total hardness, nitrate (NO3−), iron (Fe), lead (Pb), mercury (Hg), arsenic (As), and coliforms. A portable pH meter (model: Sens ION + pH1, Hach, USA) was used to measure pH on-site; other parameters were measured in the laboratory using standard techniques, such as the multiple-tube method for coliforms, the flame and electrothermal atomic absorption spectrometric method (SMEWW and SMEWW) for heavy metals (Fe, Pb, Hg, and As), and the cadmium reduction method for NO3.
C. Statistical Analysis with Multiple Variables
Ground water sampling sites were grouped according to their water quality similarities using the Ward's linkage method in CA. Based on the Euclidean distance (Dlink/Dmax) × 100, where Dlink is the linkage distance for each individual case and Dmax is the maximum linkage distance, the clusters are produced. In order to determine the number of statistically significant clusters, groups with (Dlink/Dmax) × 100 < 6024 are taken into account. The impact of various water quality parameter units was eliminated through the application of Z-score standardization. In this work, PCA was used to extract important characteristics that determine how groundwater quality varies. The primary component is a new collection of parameters created by this procedure.
D. The IWQI, or Integrated-weight Water Quality Index
An entropy-weighted approach. The weighting parameters were calculated using the information entropy method, which originated in Kashmir. The following procedure was used to calculate the entropy weights of the parameters:
First, the original data were set up according to Eq. (1):
where, m is the number of groundwater sampling sites (i = 1, 2, …, m),
n is the number of water quality parameters (j = 1, 2, …, n).
Since the units of water quality parameters were different, the value of each parameter was standardized as expressed in Eq. (2):
where, xij is the jth analyzed groundwater parameter of ith groundwater sampling site.
Then, the standardized data were organized as Eq. (3):
Equations (4) and (5) were utilized to calculate the information entropy (ej):
where ej is the jth parameter's information entropy. To make sure the formula makes sense, 10–4 is utilized. The number of locations for groundwater sampling is m.
At last, the entropy weight (Wj1) was computed using the following formula:
Critical-weighted approach. The weights (Wj2) of the water quality parameters were calculated using Equations, and the CRITIC-weighted technique was used in accordance with Zhang et al. 5. (7)–(9)
where rij is the correlation coefficient, yij is the average value of the parameter yij, y′ ij is the mean value of the parameter y′ ij, sj is the amount of information calculated for the jth parameter, δj is the standard deviation of the jth parameter, and Wj2 is the weight of the jth water quality parameter. Equation (2) was utilized to standardize the values of yij and y′ ij.
E. Integrated Computation of Weight
The entropy weights and CRITIC weights5, which are given in Eqs, can be combined to get the integrated weights (Wj). (10)–(12)
The preference coefficient is denoted by p.
F. The water quality index with integrated weight (IWQI)
The following IWQI values were found:
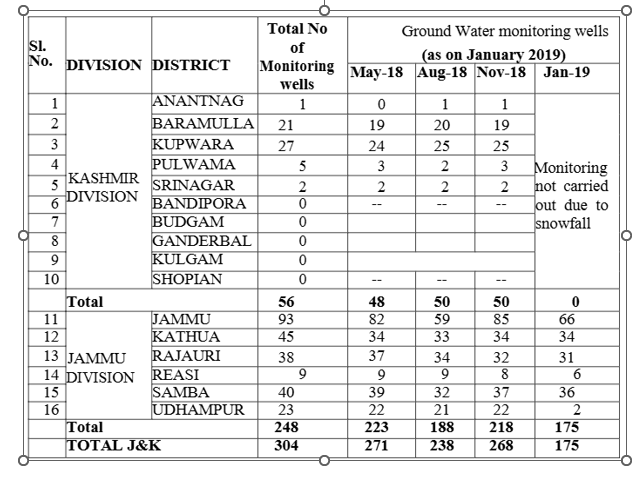
District-wise break-up of active Ground Water Monitoring Wells in J&K
Based on the IWQI calculation, the groundwater quality is divided into five classes: excellent (with values ranging from 0 to 50), good (50 to 100), bad (100 to 200), very poor (200 to 300), and unfit for drinking (> 300). The QGIS version software was used to illustrate the groundwater categories' spatial distribution based on the IWQI values. This was based on the inverse distance weighted method of interpolation. During interpolation, the sample points were weighted, and five distinct colors were allocated to each of the five classes.
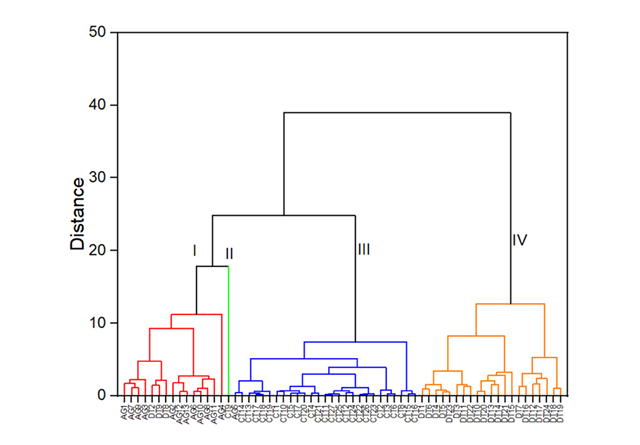
Dendrogram classifying groundwater samples according to microbiological and hydro-chemical characteristics. The x-axis is used to describe each sample, and the y-axis shows the Euclid distance.
References
[1] Zhang, Q., Qian, H., Xu, P., Hou, K. & Yang, F. Groundwater quality assessment using a new integrated-weight water quality index (IWQI) and driver analysis in the Jiaokou Irrigation District China. Ecotoxicol. Environ. Saf. 212, 111992 (2021). [2] Huang, G., Sun, J., Zhang, Y., Chen, Z. & Liu, F. Impact of anthropogenic and natural processes on the evolution of groundwater chemistry in a rapidly urbanized coastal area, South China. Sci. Total Environ. 463–464, 209–221 (2013). [3] Sarath Prasanth, S. V., Magesh, N. S., Jitheshlal, K. V., Chandrasekar, N. & Gangadhar, K. Evaluation of groundwater quality and its suitability for drinking and agricultural use in the coastal stretch of Alappuzha District, Kerala, India. Appl. Water Sci. 2, 165–175 (2012). [4] Tran, D. A. et al. Groundwater quality evaluation and health risk assessment in coastal lowland areas of the Mekong Delta Vietnam. Groundw. Sustain. Dev. 15, 100679 (2021). [5] Giao, N. T., Anh, P. K. & Nhien, H. T. H. Evaluating groundwater quality in Bac Lieu province using multivariate statistical method and groundwater quality index. Indones. J. Environ. Manag. Sustain. 5, 129–135 (2021). [6] Minh, H. V. T. et al. Impact of rice intensification and urbanization on surface water quality in An Giang using a statistical approach. Water (Basel) 12, 1710 (2020). [7] Erban, L. E., Gorelick, S. M. & Zebker, H. A. Groundwater extraction, land subsidence, and sea-level rise in the Mekong Delta Vietnam. Environ. Res. Lett. 9, 84010 (2014). [8] Anh, P. K. & Giao, N. T. Groundwater quality and human health risk assessment related to groundwater consumption in An Giang province, Viet Nam. J. Heavy Metal Toxic. Dis. 3, 4 (2018). [9] Minh, H. V. T. et al. Groundwater Quality Assessment Using Fuzzy-AHP in An Giang Province of Vietnam. Geosciences (Basel) 9, 330 (2019). [10] Egbueri, J. C. Groundwater quality assessment using pollution index of groundwater (PIG), ecological risk index (ERI) and hier archical cluster analysis (HCA): A case study. Groundw. Sustain. Dev. 10, 100292 (2020). [11] Minh, H. V. T., Avtar, R., Mohan, G., Misra, P. & Kurasaki, M. Monitoring and mapping of rice cropping pattern in flooding area in the vietnamese mekong delta using Sentinel-1A Data: A case of an Giang province. ISPRS Int. J. Geoinf. 8, 211 (2019). [12] Kanga, I. S., Naimi, M. & Chikhaoui, M. Groundwater quality assessment using water quality index and geographic information system based in Sebou River Basin in the North-West region of Morocco. Int. J. Energy Water Resour. 4, 347–355 (2020). [13] Yu, S., Liu, H., Bai, L. & Han, F. Study on the suitability of passive energy in public institutions in China. Energies (Basel) 12, 2446 (2019). [14] Zhang, Q., Xu, P. & Qian, H. Groundwater quality assessment using improved water quality index (WQI) and human health risk (HHR) evaluation in a semi-arid region of Northwest China. Expo Health 12, 487–500 (2020). [15] Minh, H. V. T. et al. Effects of Multi-Dike Protection Systems on Surface Water Quality in the Vietnamese Mekong Delta. Water (Basel) 11, 1010 (2019). [16] Department of Natural Resources and Environment. Report on development of environmental quality in Can Tho city for 10 years (1999 to 2008) (in Vietnamese). (2009). 22. MRC. Summary State of the Basin Report 2018. (2020). https://doi.org/10.52107/mrc.ajg4wl. [17] APHA. Standard methods for the examination of water and wastewater (Vol. 2). (American Public Health Association, American Water Works Association and Water Environmental Federation, 1998). [18] Gradilla-Hernández, M. S. et al. Multivariate water quality analysis of Lake Cajititlán Mexico. Environ. Monit. Assess 192, 5 (2020). [19] Shannon, C. E. A mathematical theory of communication. Bell Syst. Tech. J. 27, 379–423 (1948).
Copyright
Copyright © 2024 Dr. Bashir Ahmad Pandit. This is an open access article distributed under the Creative Commons Attribution License, which permits unrestricted use, distribution, and reproduction in any medium, provided the original work is properly cited.

Download Paper
Paper Id : IJRASET64316
Publish Date : 2024-09-23
ISSN : 2321-9653
Publisher Name : IJRASET
DOI Link : Click Here
 Submit Paper Online

