Ijraset Journal For Research in Applied Science and Engineering Technology
- Home / Ijraset
- On This Page
- Abstract
- Introduction
- Conclusion
- References
- Copyright
Feature Selection and Classification for Anomaly Detection in IoT Networks using Multi-layer Perceptron - Chaotic Ant Lion Optimization (MLP-CALO) Algorithm
Authors: Dr. K. Kavitha
DOI Link: https://doi.org/10.22214/ijraset.2024.65236
Certificate: View Certificate
Abstract
As the number of devices in Internet of Things (IoT) increases exponentially, the risks of unknown vulnerabilities and threats also increases resulting in degradation of performance. Traditional anomaly detection systems are ineffective within IoT ecosystems, since the range of possible normal behaviours of devices is significantly larger and more dynamic. The main objective of this work is to develop a machine learning (ML) algorithm to classify the selected features of IoT traffic and detect the malicious behaviour of users and unauthorised devices dynamically. In this paper feature Selection and classification for anomaly detection in IoT using Multi Layer Perception (MLP) and Chaotic Ant Lion Optimization (CALO) algorithm is proposed. In this algorithm, Filtering method using Fisher’ score and correlation coefficient is applied to select the candidate feature set. Then hybrid MLP-CALO algorithm is proposed to classify the selected features and detects the anomalies from the IoT traffic. The objective function of the CALO algorithm minimizes the average MSE of MLP output. Experimental results have shown that MLP-CALO has higher classification accuracy and lesser computation cost when compared to traditional ALO and ANN algorithms.
Introduction
I. INTRODUCTION
The Internet of Things (IoT) is a global technology which offers numorous services to interconnect people with various devices through Internet oriented services. Wireless Sensor Network (WSN) is a network of sensors dispersed spatially and used for monitoring the environmental conditions and transfer the collected data to a predetermined location for further processing. WSN is an essential component of an IoT application [1]. As the number of IoT devices increases exponentially, the number of unknown vulnerabilities and threats also increases, resulting in perimeter defences becoming weaker. Traditional anomaly detection systems are also ineffective within IoT ecosystems, since the range of possible normal behaviours of devices is significantly larger and more dynamic. An intrusion detection system (IDS) is responsible to monitor all of the activities in the network and user behaviors to check if there are any suspicious activities or any violations in the specified policy. Artificial Intelligence (AI) is the replication of human acumen procedures by computer systems. It comprises of skilled systems, speech identification, machine learning, deep learning platforms and robotic process automation. Machine Learning (ML) has been propelled as an exclusive technique for AI. ML comprises of supervised, semi supervised, unsupervised and reinforcement learning methods [2].
ML could be applied in IDS of IoT based WSN, to classify the anomaly behaviours of users and traffic patterns.
A. Problem Identification and Objectives
Optimal features learning and data set management are significant issues that affect the accuracy of attack detection [3]. It is evident that previous IDS techniques for the IoT system are still at the early stages of development. Such approaches focus on detecting whether specific cyber-attacks have occurred, and not classify the type of attack. This is an important feature of an IDS, as specific countermeasures can be employed for specific attack types.
Few approaches to classifying attack types currently exist. Such approaches, however, have only been employed and evaluated in traditional networks. Therefore, as these approaches were not designed to consider the specific requirements and computational capabilities of IoT [4].
Hence the objective of the work is to develop a ML algorithm to classify the selected features and detect the malicious behaviour of users and unauthorised devices dynamically.
II. LITERATURE REVIEW
Yulong Fu et al [5] have suggested a constant intrusion recognition technique for the massive varied IoT networks. Their technique utilises an allowance of labelled transition systems to suggest a constant depiction of IoT systems and can notice the interferences by associating the preoccupied movement’s flows. They intended the IDS method, constructed the tables, and applied the analyzer to attain the IDS methods. They also intended attesting atmosphere to authenticate the suggested IDS technique and observe the attack of RADIUS application. But it requires specific hardware and software features to detect the anomalies.
An intellectual faith calculation exemplary [6] based on ML has been industrialized. It contains a multi-class SVM method to categorize the reliable communications and malevolent communications. To cluster the communications, K-Means grouping is used. On the other hand, as it includes both unverified and verified learning methods for perceiving reliable dealings, it includes enormous computational difficulty.
A ML outline for DDoS bouts have been industrialized [7]. The congestion detention procedure gathers numerous topographies of congestion. The gathered topographies are clustered and have been removed based on the IoT performances. Lastly, certain dualistic cataloguing methods were used precisely to differentiate normal congestion from DDoS about congestion.
In anomaly detection technique for IoT sensors [8], Logistic Regression (LR), SVM , ANN, Decision Tree and Random Forest (RF) algorithms are used. From the cross-validation, it was inferred that RF and ANN have performed best both in training and testing accuracy. However it did not include any feature selection methods
An intelligent IDS has been developed [9] using deep learning algorithm detect malicious traffic in IoT networks. However the connection prober module involves huge communication overhead. An IoT based intrusion detection system was implemented by means of the passive infrared sensor (PIR) [10], as the PIR sensor cannot be tracked effortlessly. When an intrusion is perceived, warnings will be conveyed to the subsequent customers by the IDS. However it is used in real-time applications to notify the occupant of the house about intrusion of an unknown person.
II. PROPOSED METHODOLOGY
A. Overview
In this paper feature Selection and classification for anomaly detection in IoT using MLP-CALO algorithm is proposed. In our proposed method, Filter method using Fisher’ score and correlation coefficient is applied to select the candidate feature set. Then we use the combination of MLP and CALO as the classifier for the feature selection. It categorises the static and dynamic features of IoT traffic. The macro-averaged F1 score is used as the evaluation metric for the MLP-CALO classifier model.
B. Filter based Feature selection method
Filter methods are used to select the best features to build a decision tree model. In this work, Filter method using Fisher’ score and correlation coefficient is applied to select the candidate feature set. Initially, Fisher’s score (F) is computed for each of the numeric features, which is the ratio of the average inter-class separation to the average intra-class separation [11]. Among the various features of IoT traffic, the 20 best host-centric features (e.g., Host-IP and Host-MAC&IP categories) are selected by F. For the DDoS type of attacks which generate a high amount of traffic with varying frequencies, host-centric statistics would exhibit the differences between various class behaviors. Followed by F1, the correlation coefficient (CC) measures the linear relationship between two variables, ranging from [-1,1]. The pairwise CCs are computed for all features. To avoid redundancy, all high correlated features were dropped, so that features with CC in the range of [0,0.80] are selected. Among the 18 selected features, there are 3 host-centric features and 15 host-to-host communication features (such as channel, channel jitter and socket categories).
C. Classification using MLP-CALO
To classify the selected features and to detect the anomalies, the MLP-CALO classifier is applied.
1) Multi Layer Perception (MLP)
The Multi-Layer Perceptron (MLP) is a special type of the Feed-forward Neural Networks (FNNs) in which in the information is passed in one direction throughout the NNs and its neurons are arranged in various parallel layers where the first one is known as the input layer and the last one is called the output layer [12]. The layers, between these two layers, are named hidden layers. When the FNNs has only one hidden layer, it is known as a Multi-Layer Perceptron (MLP).
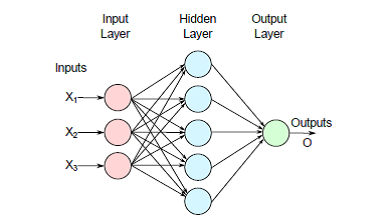
Figure 1 MLP with three inputs
According to the inputs, weights, and biases, the outputs of MLP are calculated as in the following steps:
- The weighted totals of inputs are initially computed as follows,
, where n is the number of the input nodes, Wij demonstrates the association weight from the ith node in the input layer to the jth node in the hidden layer, Yi indicates the ith input, h number of hidden nodes, and Bj is the bias (threshold) of the jth hidden node.
- The output of each hidden node is computed as:
(1)
- The final outputs are characterized depend on the computed outputs of the hidden nodes:
(2)
(3)
Where Wjk is the connection weight from the jth hidden node to the kth output node, m is the number of outputs, and is the threshold of the kth output node. From these three steps, it is clear that the output of MLPs is determined through the weights and biases. Thus, in this paper, the ALO algorithm was utilized as a trainer for MLPs’s parameters.
2) Ant Lion Optimizer (ALO)
ALO [13] is a new developed stochastic search algorithm, which mimics the hunting mechanism of antlions in nature. In this new approach, ants and antlions as search agents are proposed to find solutions by steps of hunting prey, which includes the random walk of ants, building traps, entrapment of ants in traps, catching prey, and rebuilding traps.
The mathematical model of ALO can be described as following.
Ants move stochastically in nature when searching food, therefore a random walk for an ant at each step of optimization process is defined as follows:
(4)
Where i = 1,..., dim, dim is the ant or antlion dimension, T is the maximum number of iteration, X = [X1; . . . ; Xdim], Xi is a (T + 1) X 1 matrix, and r(j) is a stochastic function and can be expressed as:
(5)
Where rand is a random number generated with uniform distribution in the interval of [0, 1].
Random walks of ants need to be converted to the position in actual search space according to lower and upper boundary. It can be calculated using Equation (3):
(6)
Where ai and bi is the minimum and maximum of Xi,ci, and di indicate the minimum and maximum of antlion in the ith dimension respectively, Y = [Y1; . . . ; Ydim], Yi is a (T + 1)X1 matrix. Xi is normalized in the domain [0, 1] using Then it is converted into the domain [ci,di] using Equation (3). It means the position around the selected antlion.
The ants’ movements are affected by antlions’ traps. This can be described as:
(7)
Where c’ and d’ is the minimum and maximum of changing limit at current iteration, Antlion is the position of the antlion selected by Roulette wheel, according to the fitnesses.
The possibility of antlions’ building traps is proportional to their fitnesses. Once the antlions know that the ants are trapped and try to escape, the sliding process of ants with decreasing radius occurs. c’ and d’ are updated using Equation (5):
(8)
Where t is the current iteration, lb and ub are the upper limit and lower limit, respectively, W is a constant defined based on the current iteration (W = 2 when t > 0.1 T, W = 3 when t > 0.5 T, W = 4 when t > 0.75 T, W = 5 when t > 0.9 T, W = 6 when t > 0.95 T).
It is easy to find that Y is a (T + 1) X dim matrix calculated in the order of Equations (5), (4), (2), (1), and (3). In the ALO algorithm, Y(t,:) that is based on the MATLAB(R2017a, MathWorks, Natick, MA, USA) format is the final result as the random walk around the chosen antlion. Besides, elitism is adopted in the ALO algorithm. It means that the best antlion is selected as elite throughout the optimization process. The position update of each ant depends on the random walks around an antlion selected by the Roulette wheel and the elite. It can be determined as:
(9)
Where Ant is the new position, RA is the random walk around the antlion selected by the Roulette wheel, RE is the random walk around the elite. The new position of the ant should be modified if it is beyond the boundary. If the ant reaches the bottom of the pit and is fitter than the antlion, then the antlion should take its position. This process is called catching prey and can be given as:
(10)
Where f (.) is the fitness function.
The flowchart of the ALO algorithm is shown in Figure 2.
____________________________________________________________
Algorithm 1 Ant Lion Optimizer (ALO)
______________________________________________________________
1) Initialize a population of n ant-lions and ants at random.
2) Compute the ant-lions and ants fitness.
3) Locate the best ant-lions and suppose it is the elite.
4) While the end criterion is not satisfied.
For each ant.
Choose an ant-lion utilizing Roulette wheel.
Generate a random walk and normalize it.
Update the position of ant.
End for
Compute the fitness of all ants.
If the ant is fitter
Substitute an ant-lion with its comparing ant
If an ant-lion gets fitter than the elite
Update elite.
5) End while
6) Return elite
______________________________________________________________________
3) Chaotic Ant Lion Optimization (CALO)
In this section, the chaotic ALO (CALO) algorithm [14] based on K-Nearest neighbor (K-NN) is presented. Exploration can be defined as the acquisition of new information through searching. Exploration is a main concern for all optimizers because it might lead to new search regions that might contain better solutions. Exploitation is defined as the application of known information. The good sites are exploited via the application of a local search. The selection process should be balanced between random selection and greedy selection to bias the search toward fitter candidate solutions (exploitation) while promoting useful diversity into the population (exploration).
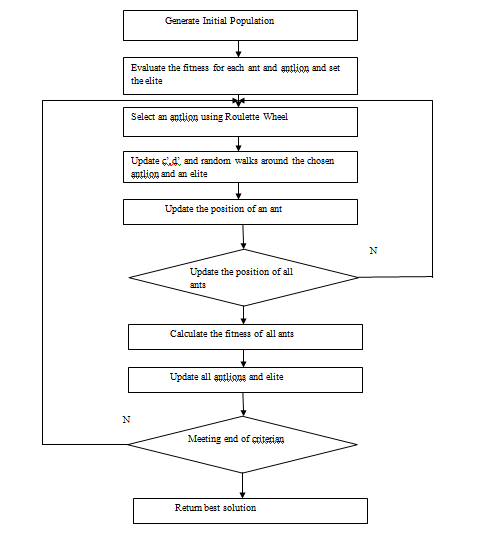
Figure 2 Flowchart of ALO algorithm.
The proposed CALO algorithm is schematically presented in (Figure 3). The search strategy of the wrapper-based approach explores the feature space to find a feature subset guided by the classification performance of individual feature subsets.
This approach may be slow because the classifier must be retrained on all the candidate subsets of the feature set and its performance must be measured. Therefore, an intelligent search of the feature space is required. The goals are to maximize the classification performance P and to minimize the number of selected features Nf.
The fitness function is given in Equation (11).
(11)
Where:
- Nf is the size of the selected feature subset;
- Nt is the total number of features in the dataset;
- α ? [0, 1] defines the weights of the sub-goals;
- P is the classification performance measured as
(12)
Where Nc is the number of correctly classified data instances and N is the total number of instances in the dataset.
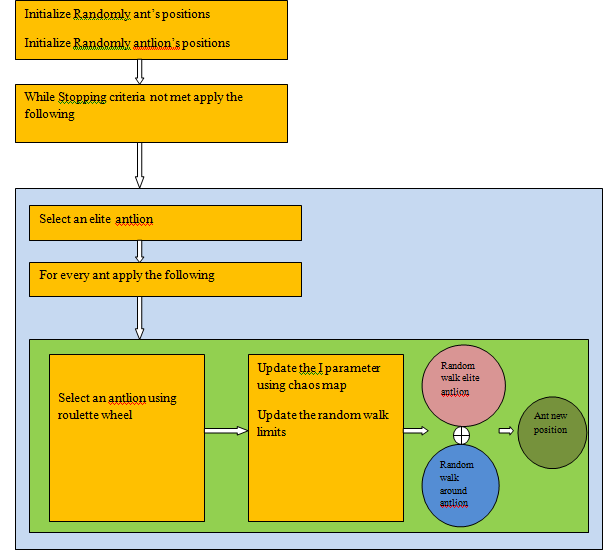
Figure 3 The process of CALO
The number of dimensions in the optimization is the same as the number of features, with each feature related to a dimension and each variable limited to the range [0, 1]. To determine whether a feature will be selected at the evaluation stage, a static threshold of 0.5 is used, as shown below:
(13)
Where yij is the discrete representation of solution vector x, and xij xij is the continuous position of the search agent i in dimension j.
4) MLP with CALO
The aim of any optimizer is to search for values corresponding to the variables of MLP such that they give the highest classification rate and the lowest error rate. To achieve this, the CALO algorithm was used to optimize the weights and biases which represent a vector as follows:
, (14)
where n represents the number of inputs, Wij is the weight of the connection between the ith node to the jth node, and φk represents the bias of the kth hidden node.
In other words, the objective function of the proposed algorithm is to achieve the highest classification rate at both training and testing samples. To evaluate the MLP output, the Mean Square Error (MSE) was used which is the difference between the desired output and the actual output of the MLP.
In other words, MSE is used to measure how the value of desired output is deviated from the value of the actual output as follows
, (15)
where m represents the number of outputs, and
are the desired and actual outputs, respectively, of the ith input unit when the kth training sample is used.
Thus, the average of MSE is calculated for all training samples as follows:
(16)
where N is the total number of training samples. The objective function of the CALO algorithm aims to minimize the average MSE as follows
.
Thus, the weights and biases of the MLP move to minimized average MSE in each iteration. Hence, CALO iteratively converges to a global solution that is better than random initial solutions.
IV. EXPERIMENTAL RESULTS
A. Experimental Setup
The training and testing was performed on the DARPA 1998 dataset. The training and testing samples are deliberately chosen from each dataset to evaluate the performance of the proposed model. 10% of the training set was selected as experimental data.
The feature selection methods were validated on a test set that simulates the prediction of unseen data.
Table-1 shows the extracted features and assigned weights.
|
S.No |
Features |
Weight value |
|
1 |
Protocol type |
1 |
|
2 |
src (bytes) |
2 |
|
3 |
sest (bytes) |
2 |
|
4 |
Duration |
1 |
|
5 |
Flag |
1 |
|
6 |
Service |
3 |
|
7 |
dst_host_count |
3 |
|
8 |
serv_count |
2 |
|
9 |
serv_error_rate |
4 |
|
10 |
same_serv_rate |
3 |
|
11 |
diff_serv_rate |
3 |
|
12 |
dst_host_same_serv_rate |
2 |
|
13 |
dst_host_diff_serv_rate |
2 |
|
14 |
dst_host_same_src_port |
3 |
|
15 |
dst_host_diff_src_port |
3 |
|
16 |
Dst_host_serror_rate |
5 |
|
17 |
No_failed_attempts |
5 |
|
18 |
No_file_creations |
4 |
|
19 |
No_access_files |
4 |
|
20 |
No_compromized |
5 |
Table 1 Extracted features and assigned weights
In all experiments, the weights and biases are randomly initialized in ranges [-10, 10] for all datasets. Moreover, the population size of the CALO algorithm is 200 for the datasets and the maximum number of iterations is 250.In this research, the hidden nodes of MLPs are assumed to be equal to 2 X N+1, where N represents the number of features or attributes (inputs) of the datasets.
Each algorithm was run 10 times on each dataset and the average (AVG) and standard deviation (STD) of the best Mean Square Errors (MSEs) in the last iteration in each algorithm were calculated. Moreover, the best classification rates or test errors of each algorithm were calculated.
B. Results
This section presents the comparison results of MLP-CALO with ALO and Artificial Neural Networks (ANN) by varying the nodes from 20 to 100.
|
Nodes |
MLP-CALO |
ALO |
ANN |
|
20 |
22.83 |
30.18 |
41.18 |
|
40 |
24.65 |
34.79 |
41.79 |
|
60 |
25.47 |
37.05 |
43.05 |
|
80 |
26.14 |
39.52 |
44.52 |
|
100 |
26.92 |
39.73 |
45.73 |
Table 2 Results of computation Cost
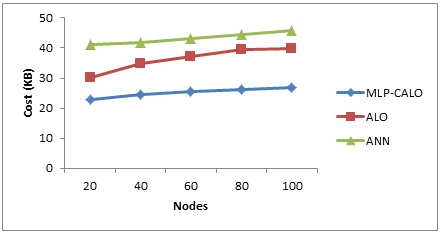
Figure 4 Computation cost for varying Nodes
Table 2 and Figure 4 show the results of computation cost of all the 3 algorithms for varying the nodes. The figure depicts that the cost of MLP-CALO is 16% lesser than ALO and 42% lesser than ANN.
|
Nodes |
MLP-CALO |
ALO |
ANN |
|
20 |
0.976 |
0.958 |
0.947 |
|
40 |
0.963 |
0.952 |
0.941 |
|
60 |
0.957 |
0.943 |
0.931 |
|
80 |
0.951 |
0.929 |
0.919 |
|
100 |
0.948 |
0.923 |
0.912 |
Table 3 Results of Classification Accuracy
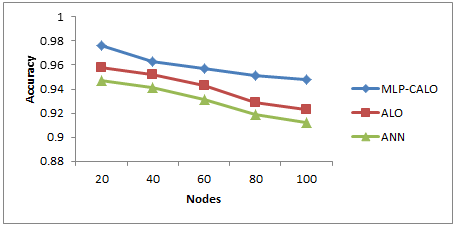
Figure 5 Classification Accuracy for varying Nodes
Table 3 and Figure 5 show the results of classification accuracy of all the 3 algorithms for varying the nodes. The figure depicts that the accuracy of MLP-CALO is 2% higher than ALO and 3% higher than ANN.
|
Nodes |
MLP-CALO (sec) |
ALO (sec) |
ANN (sec) |
|
20 |
0.315 |
0.347 |
0.357 |
|
40 |
0.325 |
0.372 |
0.382 |
|
60 |
0.345 |
0.41 |
0.441 |
|
80 |
0.371 |
0.421 |
0.471 |
|
100 |
0.374 |
0.424 |
0.534 |
Table 4 Results of classification delay
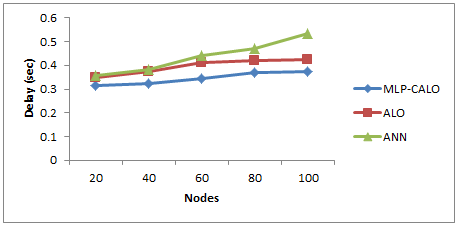
Figure 6 Classification Delay for varying Nodes
Table 4 and Figure 6 show the results of classification delay of all the 3 algorithms for varying the nodes. The figure depicts that the delay of MLP-CALO is 12% lesser than ALO and 20% lesser than ANN.
|
Nodes |
MLP-CALO (Joules) |
ALO (Joules) |
ANN (Joules) |
|
20 |
12.95 |
11.40 |
10.91 |
|
40 |
12.55 |
11.03 |
10.60 |
|
60 |
12.68 |
10.78 |
10.12 |
|
80 |
12.55 |
10.66 |
9.67 |
|
100 |
12.54 |
10.66 |
9.35 |
Table 5 Results of Average Residual Energy
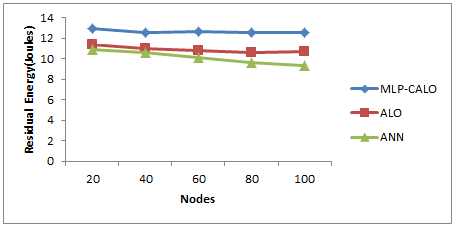
Figure 7 Residual Energy for varying Nodes
Table 5 and Figure 7 show results of average residual energy for varying the nodes. The figure depicts that the residual energy of MLP-CALO is 14% higher than ALO and 20% higher than ANN.
Conclusion
In this paper feature selection and classification for anomaly detection in IoT using MLP-CALO algorithm is proposed. In this technique, Fisher’ score and correlation coefficient are applied to extract the candidate feature set. Then the hybrid MLP-CALO algorithm is used to classify the features and detect the anomalies from IoT traffic. The objective function of the CALO algorithm minimizes the average MSE of MLP output. The performance of MLP-CALO is compared with ALO and ANN algorithms. Experimental results have shown that MLP-CALO has higher classification accuracy and lesser computation cost when compared to ALO and ANN.
References
[1] Dehua Zheng, Zhen Hong , Ning Wang and Ping Chen, \"An Improved LDA-Based ELM Classification for Intrusion Detection Algorithm in IoT Application\", Sensors,20, 1706; doi:10.3390/s20061706,2020. [2] Eirini Anthi, Lowri Williams, Ma?gorzataS?owi´nska, George Theodorakopoulos, Pete Burnap, \"A Supervised Intrusion Detection System for Smart Home IoT Devices\", IEEE Internet of Things Journal,Vol-6,No-5,pp:9042-9053,2019. [3] Yazan Otoum,Dandan Liu and AmiyaNayak, \"DL-IDS: a deep learning-based intrusion detection framework for securing IoT\",Trans Emerging Tel Tech,https://doi.org/10.1002/ett.3999,2019. [4] Simone Facchini, GiacomoGiorgi, Andrea Saracino and GianlucaDini, \"Multi-level Distributed Intrusion Detection System for an IoT based Smart Home Environment\",6th International Conference on Information Systems Security and Privacy,Egypt,2020. [5] Yulong Fu, Zheng Yan,Jin Cao,Ousmane Kone, and Xuefei Cao, \"An Automata Based Intrusion Detection Method for Internet of Things\",Hindawi Mobile Information Systems,Volume 2017, Article ID 1750637, 13 pages,2017. [6] Upul Jayasinghe, GyuMyoung Lee, Tai-Won Um, Qi Shi,\"Machine Learning based Trust Computational Model for IoT Services\", IEEE Transactions on Sustainable Computing, TSUSC, Vol-4, pages 39-51, March 2019. [7] Rohan Doshi,Noah Apthorpe and Nick Feamster, “Machine Learning DDoS Detection for Consumer Internet of Things Devices”, ArXiv Journal Publications, May-2018. [8] Mahmudul Hasan ?, Md. Milon Islam , Md Ishrak Islam Zarif , M.M.A. Hashem,\"Attack and anomaly detection in IoT sensors in IoT sites using machine learning approaches\", Internet of Things, Elsevier, 7 (2019) 100059 [9] Geethapriya Thamilarasu and Shiven Chawla,\"Towards Deep-Learning-Driven Intrusion Detection for the Internet of Things\", Sensors, 27 April 2019 [10] Khirod Chandra Sahoo and Umesh Chandra Pati, “IoT Based Intrusion Detection System Using PIR Sensor”, 2nd IEEE International Conference On Recent Trends in Electronics Information-&-Communication-Technology-(RTEICT), pages-1641-1645, 2017. [11] Alejandro Guerra-Manzanares, Hayretdin Bahsi, Sven N˜omm,” Hybrid Feature Selection Models for Machine Learning Based Botnet Detection in IoT Networks”, IEEE International Conference on Cyberworlds (CW), 2019 [12] Waleed Yamany;Alaa Tharwat, Mohamed Fawzy, Tarek Gaber and Aboul Ella Hassanien,” A New Multi-layer Perceptrons Trainer based on Ant Lion Optimization Algorithm”, IEEE Fourth International Conference on Information Science and Industrial Applications (ISI), 2015 [13] Tian Tian, Changyu Liu, Qi Guo, Yi Yuan, Wei Li and Qiurong Yan,” An Improved Ant Lion Optimization Algorithm and Its Application in Hydraulic Turbine Governing System Parameter Identification”, Energies, MDPI, 2018. [14] Hossam M. Zawbaa, E. Emary and Crina Grosan,” Feature Selection via Chaotic Antlion Optimization”, PLUS One, 2016
Copyright
Copyright © 2024 Kavitha K. This is an open access article distributed under the Creative Commons Attribution License, which permits unrestricted use, distribution, and reproduction in any medium, provided the original work is properly cited.

Download Paper
Paper Id : IJRASET65236
Publish Date : 2024-11-13
ISSN : 2321-9653
Publisher Name : IJRASET
DOI Link : Click Here
 Submit Paper Online

