

Ijraset Journal For Research in Applied Science and Engineering Technology
Groundwater Quality Assessment around Industrial Area of Gautam Budh Nagar, U.P., India
Authors: Neelam Nigam, Indu Saxena
DOI Link: https://doi.org/10.22214/ijraset.2025.66578
Certificate: View Certificate
Abstract
In areas where surface water resources are scarce ground water is used to meet industrial demand. Of great concern is the large volume of water withdrawn and the much smaller volume actually consumed thus rendering a greater portion of it as waste water or effluent to be disposed off. It is the volume of these effluents and the concentration of hazardous substances they contain combined with mode of disposal and the vulnerability of the underlying ground water which determines the risk of pollution. In assessing industrial impact on ground water, quality issue emerges to be of major concern. Water quality of a particular source and area depends on its physical, chemical and biological parameters, which are useful in assessing or monitoring of the water quality for a designated use. If the values of these defining parameters exceed the permissible limit it may pose threat for human health [1]. The best technique is to evaluate appropriate indices to gain information about water quality for a specific use. The present paper deals with the assessment of ground water quality by Geochemical classification of ground water, determining various statistical correlations and evaluating a new comprehensive and flexible index i.e. Water Pollution Index [2] to provide a basic or overall knowledge of water quality status in context of any designated use around Gautam Budh Nagar Industrial area, U.P. India. Gautam Budh Nagar lies in between 28.3383°N latitude to 77.6078°E longitude. It is a doab, bound on the west and south-west by the Yamuna River and south-east by the Hindon River. Ground water occur under phreatic conditions in shallow aquifers down to the depth of 100 mbgl, in intermediate and deeper aquifers it occurs under confined to semi-confined conditions. The chemical analysis data of eleven ground water samples from tubewell (TW) in and around industrial area confined to Noida and Greater Noida, Gautam Budh Nagar [3] were systematically computed to determine Water Pollution Index (WPI), Geochemical classification of ground water and various statistical correlations. It has been observed that the ground water of the study area is slightly alkaline (pH ranges from 7.37 to 8.23). Total Dissolved Solids (TDS) >2000 mg/l is found in 27% samples with a maximum of 3587 mg/l in water sample from TW, Subros Air Conditioning System, Phase II, Noida. 17% samples are associated with Total Hardness (TH) above permissible limit [4] with a maximum of 921mg/l in water sample from TW, Subros Air Conditioning System, Phase II, Noida. Geochemical classification of ground water shows that alkali metals exceed alkaline earths and strong acids exceed weak acids. Fluoride (F) content in 66 % samples is found to exceed the maximum permissible limit of 1.5 mg /l with a maximum of 4.3 mg/l in water sample from TW, New Holland Fiat Pvt. Ltd. Udyog Kendra, Greater Noida. Various statistical correlations have been evaluated and it has been observed that there exists a positive correlation between F & HCO3 with correlation Coefficient (r) 0.65 and negative correlation between F & Ca with (r) -0.86 thus indicating its origin to be geogenic in nature. WPI was evaluated and it was observed that it ranged from 0.76 to 2.85. 64% samples exhibited highly polluted water with WPI >1.0 with a maximum of 2.85 in water sample from TW Subros Air Conditioning System, Phase II, Noida and 36% samples showed moderately polluted water with WPI (0.75-1.0) with a minimum of 0.76 in water from TW Surya Processors Pvt. Ltd.,Chapraula, Greater Noida.
Introduction
I. INTRODUCTION
Water is used by industry in many ways – for cleaning, heating and cooling and generating steam, as a solvent and for transporting dissolved substances, and as a constituent part of the industrial product itself. Withdrawal of water for industry is usually much greater than the amount actually consumed. Of great concern is the potential for negative impact of industry on the quality of the subsurface environment. This is because the balance between the volume of water withdrawn and the much smaller volume actually consumed resulting in greater volume of wastewater or effluent to be disposed off.
Managing these large volumes of wastewater is a major challenge for urban authorities. While there is sometimes scope for reclamation of industrial wastewater to make it reusable within the industry itself or by other users, nevertheless most effluent is returned directly to the water cycle, often without adequate treatment. It is the volumes of these effluents and the concentrations of hazardous substances they contain, combined with the mode of disposal and the vulnerability of the underlying ground water which determine the risk of pollution. Water quality of a particular source and area depends on its physical, chemical and biological parameters, which are useful in assessing or monitoring of the water quality for a designated use. If the values of these defining parameters exceed the permissible limit it may pose threat for human health [1]. The best technique is to evaluate appropriate indices to gain information about water quality for a specific use.
The present paper deals with the assessment of ground water quality by Geochemical classification of ground water, determining various statistical correlations and evaluating a new comprehensive and flexible index i.e. Water Pollution Index [2] to provide a basic or overall knowledge of water quality status in context of any designated use around Gautam Budh Nagar Industrial area, U.P. India.
A. Geomorphology of the Study Area
Gautam Budh Nagar district (G.B.Nagar) lies in between 28.3383°N latitude to 77.6078°E longitude. It falls in Yamuna sub-basin and forms a part of Ganga Yamuna doab. Major part of the district is covered by Hindon river water shed. At places close to river, ravines are developed in the form of narrow gullies on land surface due to excessive erosion by surface runoff. Ravines form bad land topography along Hindon and Bhuriya Nadi between Bisrakh and Dankaur areas and also in Jhajhar area. District of Gautam Budh Nagar is drained by river Yamuna and its tributaries namely- Hindon River and Bhuriya nadi. All these drainage ways flow in a southerly or south-easterly course. These streams generally follow a meandering course through narrow flood plains.
B. Hydrogeology of the Study Area
The alluvial deposit occurring in Ganga -Yamuna doab area, comprises of an aquifer system with good repository of ground water that occur in granular zones constituted of fine to coarse sand and occasional gravel. Thick clay beds inter lying with sand act as confining layers and separate the aquifers. The thickness of the unconsolidated sediments progressively increases towards east.
Ground water occur under phreatic conditions in shallow aquifers down to the depth of 100 mbgl, in intermediate and deeper aquifers it occurs under confined to semi-confined conditions.
II. APPROACH AND METHOD
The chemical analysis data of eleven groundwater samples collected from industrial area of G.B. Nagar [3] were systematically computed and interpreted to assess ground water quality. The location of sampling points are tabulated below (Table 1) and depicted on the location map (Fig.1).
Table 1 : Location of samples collected from industrial area of G.B.Nagar District, U.P.
|
|
|
Block |
|
|
|
|
||||||
|
Serial No. |
District |
|
|
Location |
Sampling |
|
||||||
|
|
|
|
|
|||||||||
|
|
|
|
Points |
|
||||||||
|
|
|
|
|
|
|
|||||||
|
|
|
|
|
|
|
|
||||||
|
1 |
G.B. Nagar |
Bisrakh |
Sumi Motherson System, Sector -1, Noida |
TW1 |
|
|||||||
|
|
|
|
|
|
|
|
||||||
|
2 |
G.B. Nagar |
Bisrakh |
Barahi Industries, Sector 6, Noida |
TW2 |
|
|||||||
|
|
|
|
|
|
|
|
||||||
|
3 |
G.B. Nagar |
Bisrakh |
Minda Automobile Solution Ltd., Sector-59, Noida |
TW3 |
|
|||||||
|
|
|
|
|
|
|
|
||||||
|
4 |
G.B. Nagar |
Bisrakh |
Haldi Ram, Sector -63, Noida |
TW4 |
|
|||||||
|
|
|
|
|
|
|
|
||||||
|
|
G.B. Nagar |
Bisrakh |
Subros Airconditioning System, Phase II, B-188, Noida |
TW5 |
||||||||
|
|
|
|
|
|
|
|||||||
|
|
6 |
G.B. Nagar |
Dankur |
HONDA, Sector-41, Greater Noida |
TW6 |
|||||||
|
|
|
|
|
|
|
|||||||
|
|
7 |
G.B. Nagar |
Dadri |
R P Foams, Chitaihra, Dadri, Greater Noida |
TW7 |
|||||||
|
|
|
|
|
|
|
|||||||
|
|
8 |
G.B. Nagar |
Dadri |
Hero Mptors, Village: Acheja, 10 km stone, GT Road, |
TW8 |
|||||||
|
|
Chapraula, Greater Noida |
|||||||||||
|
|
|
|
|
|
||||||||
|
|
|
|
|
|
|
|||||||
|
|
9 |
G.B. Nagar |
Bisrakh |
Surya Processors Pvt. Ltd., Chapraula, Greater Noida |
TW9 |
|||||||
|
|
|
|
|
|
|
|||||||
|
|
10 |
G.B. Nagar |
Bisrakh |
New Holland Fiat Pvt Ltd., Udyog Kendra, Greater Noida |
TW10 |
|||||||
|
|
|
|
|
|
|
|||||||
|
|
11 |
G.B. Nagar |
Bisrakh |
India Yamha Motors Pvt. Ltd., A3, Industrial Area, |
TW11 |
|||||||
|
|
Surajpur, Greater Noida |
|||||||||||
|
|
|
|
|
|
||||||||
|
|
|
|
|
|
|
|||||||
|
|
||||||||||||
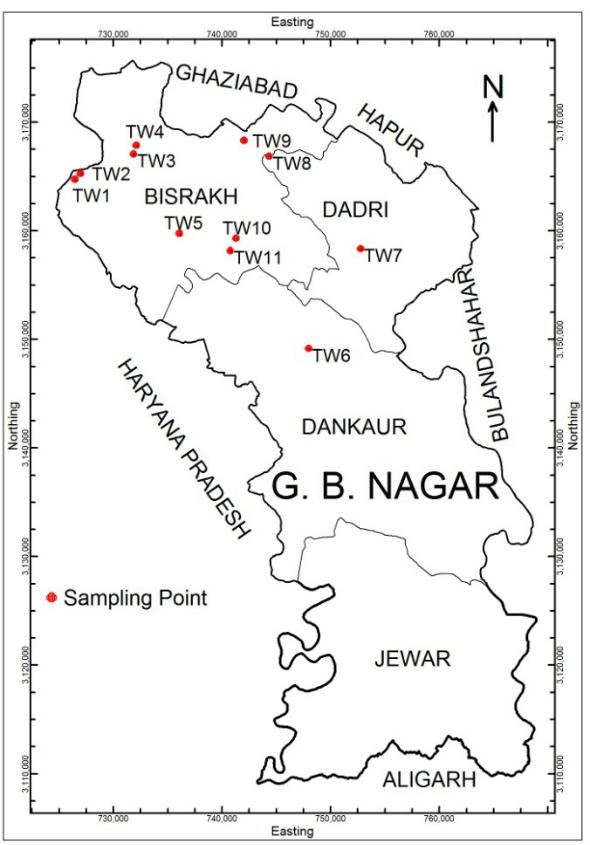
Fig. 1 : Map showing sampling points in G.B.Nagar District, U.P.
- Preparation of modified piper diagram [5]using chemical analysis data for geo-chemical classification of ground water.
- Determination of various statistical correlations for the purpose of defining the origin of contamination in ground water.
- Evaluation of Water Pollution Index [2] for overall assessment of ground water quality.
III. RESULTS AND DISCUSSION
Systematic analysis and computation of the chemical data [3] of a total number of 11 water samples reveals that the ground water in the study area is mildly alkaline in nature (pH ranges from 7.37 to 8.23).
The Total Dissolved Solids (TDS) in Bisrakh block is found to exceed the permissible limit of 2000 mg/l [4] at three locations viz. TW 2 (2198 mg/l), TW 4 (2949 mg/l) & TW 5 exhibiting maximum value of 3587 mg/l. In Dadri & Dankaur block ground water is found to be fresh with TDS within the permissible limit.
Total Hardness (TH) in TW 4, Haldi Ram, Sector-63, Noida (761 mg/l) & TW 5, Subros Airconditioning System, Phase II, B-188 Noida (921 mg/l) in Bisrakh block is found to be greater than the permissible limit [4].
Fluoride (F) content in 66% samples (Fig. 2) from the entire study area is found to exceed the maximum permissible limit of 1.5 mg /l [4] with the highest value of 4.3 mg /l fluoride detected in TW 10, New Holland Fiat Pvt. Ltd., Udyog Kendra, Bisrakh block whereas all the water samples from Dadri & Dankaur block under study exhibit high Fluoride. High Fluoride water is unsuitable for potable purposes as it causes dental fluorosis.
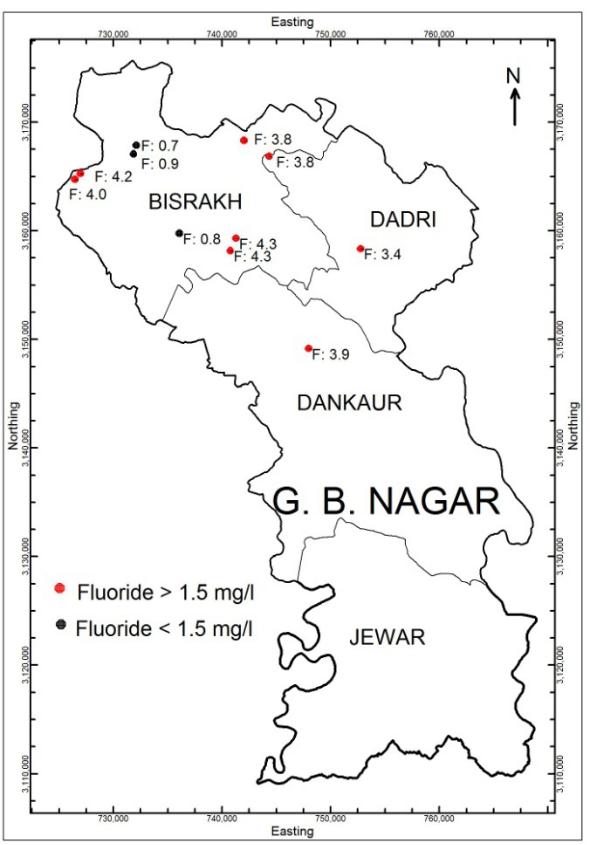
Fig. 2 : Map showing Distribution of Fluoride in G.B.Nagar District
The geochemical classification of ground water (Fig. 3) reveals that in 100 % of the water samples alkali metals exceed alkaline earths and strong acidic anions exceed weak acidic anions exhibiting Na-Cl type water as is evident from modified Piper diagram [5]. This is also supported by the occurrence of very strong correlation between Na & Cl (Fig. 4). Such waters have salinity problem and are unfit for drinking as well as irrigation purposes.
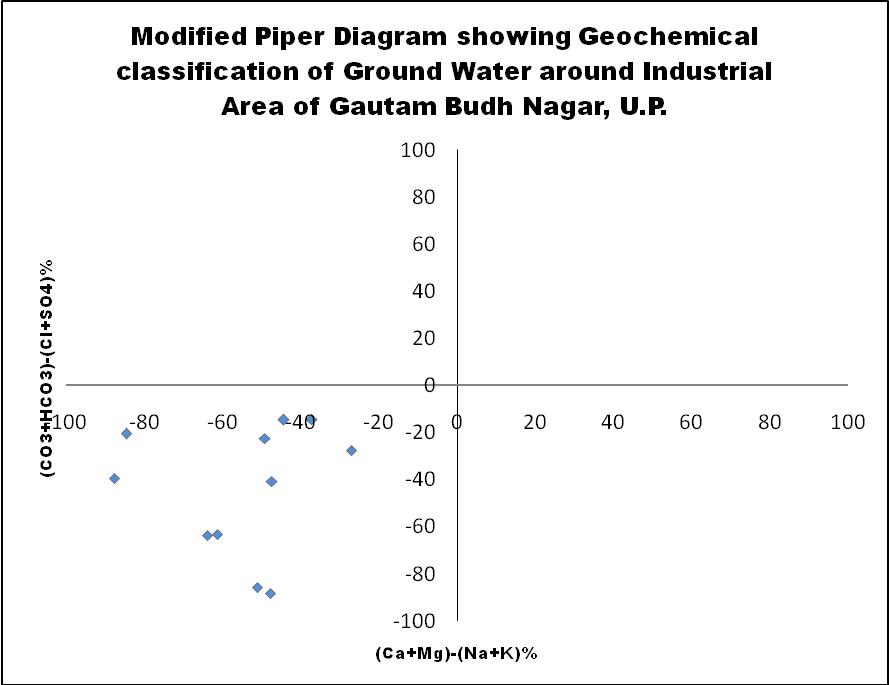
Fig. 3: Modified Piper Diagram exhibiting Geochemical Classification of Ground Water
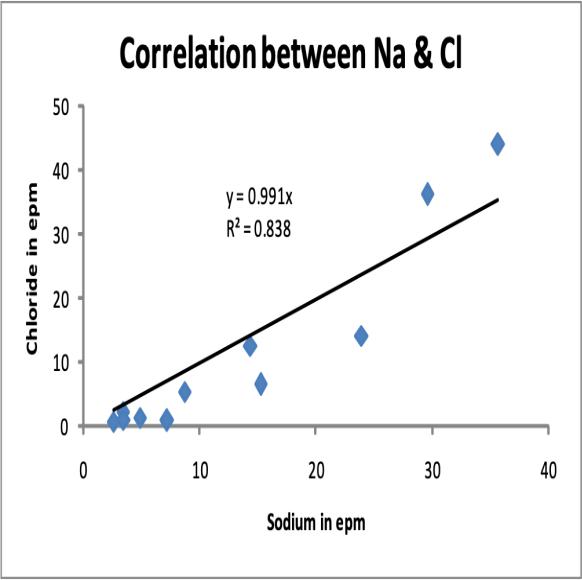
Fig. 4 : Correlation between Sodium & Chloride in Ground Water around Industrial Area of G. B. Nagar District U.P.
Correlation coefficient between Fluoride and various Chemical Indices were evaluated (Table 2) and it was observed that there exists a very strong negative correlation between Ca and F and a positive correlation between HCO3 & F. These results are in conformity with those reported by [6] and Jacks [7]. It is graphically being shown by the regression line (Fig. 5 & 6).
Table 2 : Correlation Coefficient (r) between Fluoride & various Chemical Indices
|
Chemical Indices |
F |
|
|
|
|
HCO3 |
0.65 |
|
|
|
|
Ca |
-0.86 |
|
|
|
|
Na |
-0.66 |
|
|
|
|
Mg |
-0.49 |
|
|
|
|
K |
-0.45 |
|
|
|
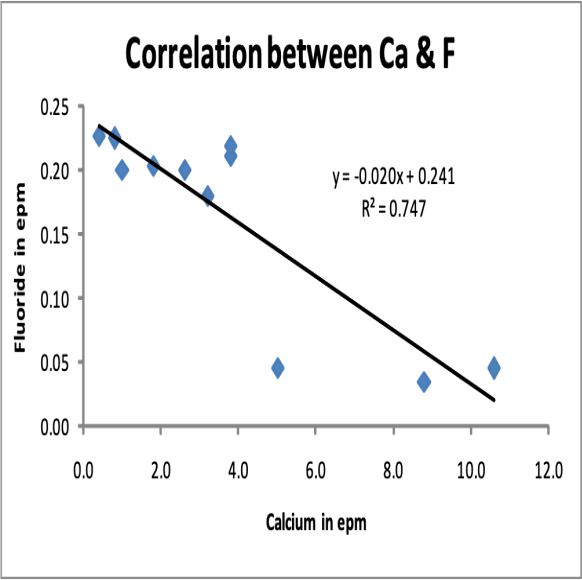
Fig. 5: Correlation between Ca & F in Ground Water around Industrial Area of G.B.Nagar District, U.P.
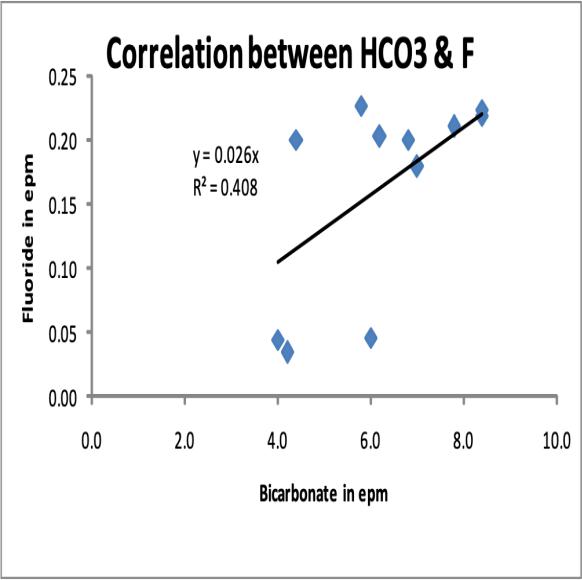
Fig. 6: Correlation between HCO3 & F in Ground Water around Industrial Area of G.B.Nagar District, U.P.
Water Pollution Index (WPI) score based on’ n’ number of parameters is utilised to classify water quality in four category [2] in Table 3.
Table 3 : Water Classification method with respect to WPI score
|
WPI value |
Category |
|
|
|
|
<0.5 |
Excellent water |
|
|
|
|
0.5-0.75 |
Good water |
|
|
|
|
0.75-1.0 |
Moderately polluted water |
|
|
|
|
>1.0 |
Highly polluted water |
|
|
|
For the purpose of Water Pollution Index (WPI) calculation [2] , here 12 water quality parameters viz. pH, EC, TDS, Na+, K+, Mg2+, Ca2+, F-, HCO3-, Cl-, NO3- & SO42- were taken to estimate firstly the pollution load (PLi) of ith parameter of a ground water sample based on their standard permissible limits as defined by [4] and [8] , (Table 2 ) using (eqn. 1).
PLi = 1+[(Ci-Si)/Si] ……… (1)
Where Ci is observed conc. of ith parameter
Si is the standard permissible limit for the respective parameter
For pollution load in case of pH, if pH is < 7 then minimum acceptable pH value of 6.5 is used for Sia (eqn.1.1).
PLi = (Ci-7)/(Sia-7)………..(1.1)
if pH is > 7 then maximum acceptable pH value of 8.5 is used for Sib (eqn.1.2).
PLi = (Ci-7)/(Sib-7)………..(1.2)
Finally WPI for a ground water sample is determined by aggregating the pollution load of all the parameters and dividing it with the number of parameters (n) using (eqn. 2).
WPI = 1/n ∑(PLi (i=1 to n)………(2)
The range of physicochemical parameters of 11 ground water samples collected from industrial area of G.B.Nagar District, U.P., along with standard guidelines is summarised in Table 4 below-
Table 4 :Range of physicochemical parameters of 11 ground water samples with standard guidelines
|
Parameters |
Range |
WHO (2011) |
BIS (2012) |
|
|
|
|
|
|
pH |
7.37-8.23 |
6.5-8.5 |
6.5-8.5 |
|
|
|
|
|
|
EC |
581-5353 |
750 |
- |
|
|
|
|
|
|
TDS |
389-3587 |
500 |
500 |
|
|
|
|
|
|
Ca |
8-212 |
75 |
75 |
|
|
|
|
|
|
Mg |
9.7-95 |
50 |
30 |
|
|
|
|
|
|
Na |
58-820 |
200 |
- |
|
|
|
|
|
|
4.3-19 |
200 |
- |
|
|
|
|
|
|
|
HCO3 |
244-512 |
- |
240 |
|
|
|
|
|
|
SO4 |
25-425 |
250 |
200 |
|
|
|
|
|
|
Cl |
21-1553 |
250 |
250 |
|
|
|
|
|
|
NO3 |
0.03-21 |
45 |
45 |
|
|
|
|
|
|
F |
0.65-4.3 |
1.5 |
1.0 |
|
|
|
|
|
WPI was evaluated and it was observed that it ranged from 0.76 to 2.85. As per WPI classification (Table 3), 64% samples exhibited highly polluted water with WPI >1.0 with a maximum of 2.85 in water sample from TW Subros Air Conditioning System, Phase II, Noida and 36% samples showed moderately polluted water with WPI (0.75-1.0) with a minimum of 0.76 in water from TW Surya Processors Pvt. Ltd.,Chapraula, Greater Noida (Fig. 7).
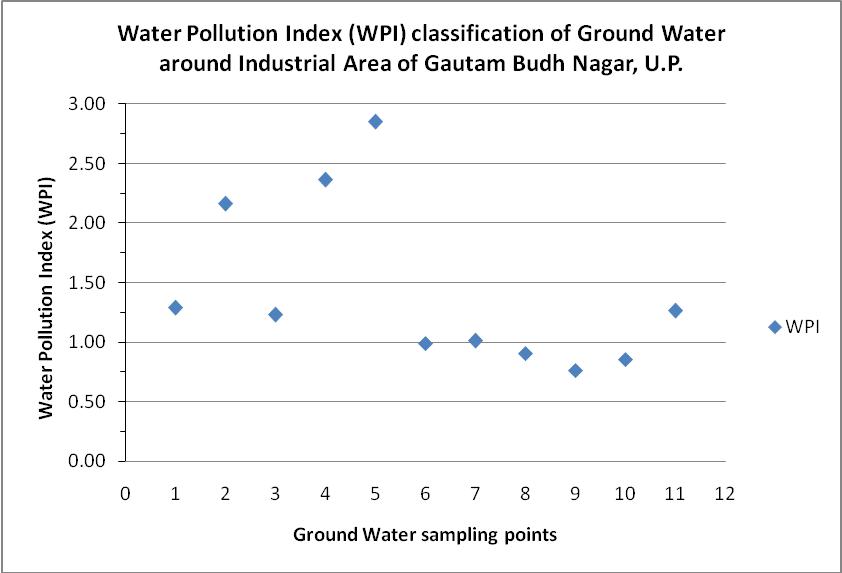
Fig. 7 : Classification of ground water with respect to Water Pollution Index score
Conclusion
The ground water of the study area is found to be slightly alkaline (pH ranges from 7.37 to 8.23). Total Dissolved Solids >2000 mg/l is observed in 27% samples with a maximum of 3587 mg/l in water sample from TW 5, at Subros Air Conditioning System, Phase II, Noida. 17% samples are associated with Total Hardness above permissible limit with a maximum of 921mg/l in water sample from TW 5, at Subros Air Conditioning System, Phase II, Noida. Geochemical classification of ground water shows that alkali metals exceed alkaline earths and strong acidic anions exceed weak acidic anions exhibiting Na-Cl type water. Fluoride content in 66 % samples is found to exceed the maximum permissible limit of 1.5 mg /l with a maximum of 4.3 mg/l in water sample from TW 10, New Holland Fiat Pvt. Ltd. Udyog Kendra, Greater Noida. Various statistical correlations have been evaluated and it has been observed that there exists a positive correlation between F & HCO3 with correlation Coefficient (r) 0.65 and negative correlation between F & Ca with (r) -0.86 thus indicating its origin to be geogenic in nature. Water Pollution Index (WPI) was evaluated and it was observed that it ranged from 0.76 to 2.85. As per WPI classification, 64% samples exhibited highly polluted water with WPI >1.0 with a maximum of 2.85 in water sample from TW Subros Air Conditioning System, Phase II, Noida and 36% samples showed moderately polluted water with WPI (0.75-1.0) with a minimum of 0.76 in water from TW Surya Processors Pvt. Ltd.,Chapraula, Greater Noida. Thus, as per various observations obtained through geochemical classification of ground water, statistical correlations and WPI, it is inferred that ground water samples collected from Gautam Budh Nagar Industrial area exhibit geogenic contamination resulting in high Salinity and high Fluoride. These contaminated ground water sources should be avoided for potable purposes as they may cause health hazard.
References
[1] Mukate, S.,Wagh, V., Panaskar, D., Jacobs, J. A., Sawant, A.– Development of new Integrated Water Quality Index (IWQI) model to evaluate the drinking suitability of water, Ecol. Ind. 101, 348-354. (2019). [2] Hossain, M. & Patra, P. K.– Water Pollution Index – A new integrated approach to rank Water Quality, Ecol. Ind. 117, article 106668 (2020). [3] Nigam, N., Mehrotra, P., Prakash, R., Bhartariya, K. G., Srivastava, S. K., Singh, K. – Tech. Report : A Report on Ground Water Quality of some Industrial Clusters of Uttar Pradesh, Govt. of India, Ministry of Water Resources, C.G.W.B., NR, Lucknow (2016). [4] B.I.S.- Indian Standard Specifications for drinking water, I.S. 10500 (2012). [5] Chadha D.K. - A new Diagram for Geochemical Classification of Natural Waters and Interpretation of Chemical Data, Bhu-Jal News, Vol. 13, No.1&2, pp1-4 (1998). [6] Handa, B.K. Geochemistry and genesis of fluoride containing ground water in India, V13, pp 275-281 (1975). [7] Jacks, G. Hydrochemical studies in Noyil river basin, CGWB, SIDA project 1:5 (1977). [8] WHO – Guidelines for Drinking Water Quality, fourth Ed., World Health Organisation, Geneva (2011).
Copyright
Copyright © 2025 Neelam Nigam, Indu Saxena. This is an open access article distributed under the Creative Commons Attribution License, which permits unrestricted use, distribution, and reproduction in any medium, provided the original work is properly cited.

Download Paper
Paper Id : IJRASET66578
Publish Date : 2025-01-19
ISSN : 2321-9653
Publisher Name : IJRASET
DOI Link : Click Here
 Submit Paper Online