

Ijraset Journal For Research in Applied Science and Engineering Technology
Health Monitoring Using IOT
Authors: Shoaib Nadeem Khan, Manish R Khodaskar
DOI Link: https://doi.org/10.22214/ijraset.2025.66845
Certificate: View Certificate
Abstract
A pulse oximeter is used to measure a persons oxygen level; this indicates the ratio of oxygen-carrying molecules in the blood that carry oxygen. It is important to assess saturation oxygen levels in cases where patients are at risk of overdose, as the global spread of COVID-19 has now reached a pandemic-free state. Currently, with no cure and limited vaccines, the novel coronavirus has had a significant impact on public health, society, and the global economy that will last for years. IoT platforms are the first choice to achieve this due to their intuitive capabilities and seamless connectivity. IoT technology is changing our lives through smart healthcare, smart cities, or smart buildings to create a simpler and smarter society. We will measure the saturation point oxygen content in our body with the pulse and this information will be stored in the system and made available to users. Use a pulse oximeter to monitor a person\'s oxygen level and heart rate. Pulse oximeters are designed to use infrared and visible light to transmit light from a transmitter through a person\'s finger. Suction indicates that blood is flowing through your finger and displays oxygen and pulse results. The output of this analog circuit is connected to the NodeMCU, which calculates the heart rate and oxygen level based on these values. Results will be displayed and viewed on the app and LCD.
Introduction
I. INTRODUCTION
This is one of the interesting IoT projects where healthcare services focused on the Internet of Things aim to enable patients to take control of their health. The system will allow users to monitor their vital signs and send the information to the appropriate doctors and nurses. Doctors can provide instant solutions and guidance based on the patient''s health conditions. The sensors in the application can monitor the patients vital signs such as blood pressure, blood sugar, and heart rate. If the vital statistics are higher/lower than normal, the system will immediately alert the doctor. It is an Arduino-based project where communication is made between the Arduino platform and the Android application.
Early diagnosis of serious problems (Internet of Things). This can be done by using sensors to collect physiological data from the patient, send the data to the cloud for analysis and storage, and send the analysis results to the audience. Electronic medicine, one of the applications of the Internet of Things, will play an important role. Islam et al. conducted a study on the latest research on IoT in healthcare, showing some of the problems that need to be solved. While some researchers are working on creating IoT healthcare applications by sending data from medical devices to servers and displaying it on PCs or mobile devices, others are working on various IoT and IoT-based healthcare cloud analytics utilities.
Maternal and infant healthcare can be improved by providing better medical services, and maternal and infant mortality can be reduced by using IoT technology in government affairs.
II. TABULAR SURVEY
|
Reference Paper |
Type of sensors used |
Measurement frequency |
Time taken from initiation to data retrieval |
Percentage of accuracy |
Protocol used for data transmission |
Power Consumption |
|
Health Monitoring System using IOT. |
MAX30100 |
1 per 2 sec |
3.5 – 4 sec |
80-95% |
HTTP/HTTPS |
Bluetooth Low Energy (BLE) |
|
IOT Based Temperature and Oxygen Pulse Scan Entry System |
AD8232 |
1 per 4 sec |
4 sec |
85-90% |
HTTP/HTTPS |
Bluetooth Low Energy (BLE) |
|
Scalable, Cost Effective IoT Based Medical Oxygen Monitoring System for Resource Constrained Hospital Environment |
MH-Z19 |
2 every sec |
2 - 2.5 sec |
92-95% |
MQTT |
Wi-Fi |
|
IOT based Temperature and Oxygen level monitoring and Data visualization |
AM2320 |
1 per 3 sec |
5 -7 sec |
70-90% |
AMQP |
Wi-Fi |
|
Pulse Rate and Blood Oxygen Monitor to Help Detect Covid-19: Implementation and Performance |
MAX30100 |
1 per 2 sec |
4 -6 sec |
85-95% |
HTTP/HTTPS |
Celullar (NB-IoT) |
|
Ventilator Using Arduino with Blood Oxygen Sensor |
GY-801 |
1 Every sec- |
10 -12 sec |
95-100% |
HTTP/HTTPS |
Bluetooth Low Energy (BLE) |
|
Real Time Health Monitoring and Oxygen Distribution System for COVID-19 patients using IoT |
MAXREFDES117 |
3 per 2 sec |
3 -4 sec |
80-85% |
CoAP |
Zigbee |
|
IoT-Based Health Monitoring System |
MX30102 |
1 per 2 sec |
6 sec |
75-90% |
HTTP/HTTPS |
Wi-Fi |
|
IoT Based Pulse Oximeter System |
MX30102 |
1 per 2 sec |
6 – 6.5 sec |
92-95% |
HTTP/HTTPS |
Wi-Fi |
|
Smart Jacket for Monitoring the Health Conditions of Patients using IoT |
AD8232 |
1 per 12 sec |
1 -4 sec |
80-90% |
CoAP |
Celullar (NB-IoT) |
|
IoT-based COVID-19 Patient Vital Sign Monitoring |
MAX30100 |
2 per sec |
2- 3 sec |
85-95% |
MQTT |
Bluetooth Low Energy (BLE) |
|
Wearable Smart Heart Monitor using IOT |
AM2320 |
4 per 3 sec |
2 -3 sec |
70-100% |
HTTP/HTTPS |
Bluetooth Low Energy (BLE) |
|
IOT Based Health Care Monitoring and Facilitation |
MH-Z19 |
1 per 2 sec |
3 -6 sec |
80-85% |
AMQP |
Wi-Fi |
|
VitalLink: NodeMCU IoT Solution for Vital Signs Surveillance. |
GY-801 |
1 per sec |
1- 1.5 sec |
60-70% |
HTTP/HTTPS |
Zigbee |
|
IoT in Patient Respiratory Condition & Oxygen Regulator's Flowrate Monitor |
AM2320 |
- |
5- 8 sec |
75-90% |
HTTP/HTTPS |
Bluetooth Low Energy (BLE) |
|
Design and Implementation of Patient Monitoring System Based on IoT Using Oxygen Saturation |
MAXREFDES117 |
2 every sec |
2 -4 sec |
80-100% |
LoRaWAN |
LoRaWAN |
Table i. Tabular Survey of all
III. BLOCK DIAGRAM
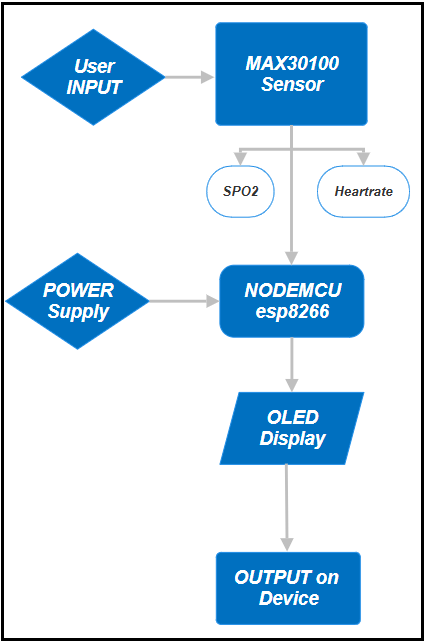
Flowchart i. Block Diagram of Project
A. Explanation
The health monitoring system integrates several components that work together to monitor a patient's vital signs, particularly SpO2 and pulse rate. The block diagram illustrates the relationship between these components. Below is a detailed explanation of each part of the system and how they function together.
B. Components Used
- MAX30100 Sensor : This is a pulse oximeter and heart rate monitor sensor. It uses optical design and techniques to measure the SpO2 and pulse rate.The MAX30100 emits light through the skin and measures the amount of light that is absorbed. Changes in light absorption correlate with blood flow and oxygen levels, allowing it to calculate the SpO2 and pulse rate.
- ESP8266 NodeMCU : This is a low-cost Wi-Fi microcontroller with a built-in OLED display interface. The NodeMCU receives data from the MAX30100 sensor via I2C or SPI communication. It processes this data to extract the SpO2 and pulse rate values.
- OLED Display : A small screen that displays the patient's vital signs.The OLED is connected to the NodeMCU and receives processed data. It displays real-time SpO2 and pulse rate readings in a clear format, enabling quick assessment by healthcare providers or the patient.
- Power Supply : Provides necessary power to the entire system. The system can be powered through a USB connection or battery, ensuring portability and ease of use in various settings.
- Data Transmission : If applicable, the NodeMCU can wirelessly transmit data to a mobile app or cloud service for monitoring and record-keeping. Using Wi-Fi capabilities, the ESP8266 can send the processed data to external devices where it can be analyzed or stored for future reference.
C. Overall Workflow
- The MAX30100 sensor continuously collects data from the patient.
- The data is sent to the ESP8266 NodeMCU, which processes the incoming signals.
- The MCU calculates the SpO2 and pulse rate from the sensor data.
- The processed values are sent to the OLED display for real-time visualization, allowing users to monitor their health indicators easily.
- The NodeMCU can transmit the data to an external server or mobile application for additional monitoring and record-keeping.
The Outcome from this represents an effective integration of sensor technology, microcontroller programming, and display output to facilitate real-time health monitoring. The use of the MAX30100 sensor with the ESP8266 NodeMCU enables a compact, wireless, and user-friendly device that significantly aids in patient health management.
IV. FLOW CHART

Flowchart ii. Structure of Project
A. Explanation
- Start : Initial entry point of the flowchart.
Initialize ESP8266 : Sets up the NodeMCU microcontroller. - Setup I2C Communication : Prepares communication with I2C devices.
- Initialize MAX30100 Sensor : Sets up the MAX30100 sensor for reading heart rate and SpO2.
- Initialize OLED Display : Prepares the OLED display for showing data.
- Read Data from MAX30100 : Fetches heart rate and SpO2 readings.
- Process Heart Rate & SpO2 Data : Processes the received data for display and storage.
- Display Data on OLED : Outputs the heart rate and SpO2 values on the OLED screen.
- Store Data in Database : Saves the readings into a database.
- Send Data via Bluetooth : Transmits the data to another device using Bluetooth.
- Database Updated : Confirms that the data has been successfully stored.
- Read Next Data : Loops back to continue collecting data.
- End : Represents the process’s termination.
- Error Handling : Manages any errors that occur during operations.
- Reset System : Resets the system to recover from errors.
V. ALGORITHM
1) Step 1: Setup Hardware Components
- NodeMCU (ESP8266): Acts as the microcontroller to handle the logic and communication.
- MAX30100 Sensor: Used to measure heart rate and pulse oximetry.
- OLED Display: Displays the readings such as heart rate and oxygen saturation levels.
- Jumper wires: To connect the components.
2) Step 2: Wiring Connections
- MAX30100 Sensor:
- VCC to 3V pin on NodeMCU.
- GND to GND on NodeMCU.
- SCL to D1 (GPIO5).
- SDA to D2 (GPIO4).
- OLED Display:
- VCC to 3.3V on NodeMCU.
- GND to GND on NodeMCU.
- SCL to D1 (GPIO5).
- SDA to D2 (GPIO4).
3) Step 3: Install Libraries
- Install necessary libraries for the sensors and display.
- MAX30100: MAX30100 library to interface with the MAX30100 sensor.
- Wire: I2C library for communication with the OLED display.
- Adafruit_SSD1306: OLED display library for displaying the information.
4) Step 4: Initialize the Components
- NodeMCU Initialization: Set up I2C communication.
- MAX30100 Sensor Initialization: Initialize the MAX30100 to measure heart rate and oxygen saturation levels.
- OLED Display Initialization: Set up the OLED display to show heart rate and other health metrics.
5) Step 5: Measure Health Metrics
- Heart Rate Measurement: Use the MAX30100 sensor to get the heart rate data.
- Initialize MAX30100.
- Continuously read the heart rate from the MAX30100 sensor.
- Use the sensor to calculate pulse rate by detecting changes in light absorption.
- Oxygen Saturation Measurement: Use the same MAX30100 sensor to get the SpO2 (oxygen saturation level) from the light absorption data.
- Data Processing:
- Process the data from the MAX30100 to extract the heart rate (BPM) and oxygen saturation (SpO2).
- Implement any necessary filtering or smoothing of the data (e.g., using a rolling average).
6) Step 6: Display Data on OLED
- Clear Display: Clear the OLED screen before displaying new data.
- Display Heart Rate: Display the heart rate on the OLED screen in the format like "Heart Rate: 75 BPM".
- Display Oxygen Saturation: Display the SpO2 level like "SpO2: 98%".
- Additional Information: Optionally, display any other data like sensor status or alerts.
7) Step 7: Send Data to IoT Platform (Optional)
- Wi-Fi Setup: Connect the NodeMCU to a Wi-Fi network.
- Send Data to Cloud:
- Use HTTP or MQTT protocol to send the heart rate and SpO2 data to a cloud server like ThingSpeak, Blynk, or any other IoT platform.
- Include additional parameters like timestamp, patient ID, etc., in the data sent.
8) Step 8: Handle Errors & Calibration
- Implement error handling to deal with sensor disconnection or poor sensor readings.
- Optionally, you can calibrate the sensor by taking readings under controlled conditions.
9) Step 9: Repeat the Process
- Implement a loop in the code that:
- Continuously reads heart rate and SpO2 data from the MAX30100 sensor.
- Updates the OLED display with the latest data.
- Optionally, uploads the data to the cloud server at regular intervals.
- Implements any delay between measurements, such as 2 seconds.
10) Step 10: Testing and Calibration
- Test the system with real-time measurements.
- If necessary, calibrate the sensor for accuracy.
11) Step 11: Expand Functionality
- Add features such as:
- Sending data to a cloud platform for real-time monitoring.
- Setting up alerts or notifications if the heart rate or oxygen levels go beyond certain thresholds.
- Storing historical data for further analysis.
VI. PERFORMANCE EVALUATION PARAMETERS
- Accuracy : In this IoT-based health monitoring system measuring pulse and oxygen levels, sensor accuracy typically ranges from 80% to 95%, influenced by sensor quality, environmental factors, and individual variability.
- Response Time : The response time for execution in an IoT-based health monitoring system that calculates pulse and oxygen levels using sensors is approximately 3 to 4 seconds.
- Sensitivity : The sensitivity of the sensors is considered to be within normal range, effectively detecting physiological changes in patients.
- Specificity : The specificity of the sensors used in the IoT-based health monitoring system for measuring pulse and oxygen levels is deemed acceptable, ensuring reliable detection of genuine physiological states.
- Reliability : The health monitoring system utilizing IoT for measuring pulse and oxygen levels is dependable, offering reliable and precise readings essential for evaluating patient health.
- Data Transmission Latency : The data transmission latency in the IoT-based health monitoring system for measuring pulse and oxygen levels operates via Bluetoooth, facilitating seamless connectivity and real-time data transfer.
- Power Consumption : The IoT-based health monitoring system for calculating pulse and oxygen levels typically exhibits moderate power consumption due to its operation on Wi-Fi, balancing connectivity with efficiency.
- User Interface Usability : The user interface of the IoT-based health monitoring system is designed for high usability, featuring intuitive navigation and clear visualizations that enhance user experience and data comprehension.
- Scalability : The scalability of the IoT-based health monitoring system is commendable, allowing for seamless integration of additional sensors and devices as patient needs and system demands grow.
- Interoperability : The interoperability of the IoT-based health monitoring system is robust, enabling effective communication and data exchange among diverse devices and platforms in the healthcare ecosystem.
- Data Security : The data security measures implemented in the IoT-based health monitoring system for pulse and oxygen level calculation are of a high standard, ensuring the protection of sensitive patient information against unauthorized access.
- Cost-Effectiveness : The IoT-based health monitoring system for calculating pulse and oxygen levels is cost-effective, offering a budget-friendly solution without compromising on quality or accuracy.
- User Satisfaction : User satisfaction for the IoT-based health monitoring system, which measures pulse and oxygen levels, is notably high, with 80 to 90 percent of users reporting satisfaction with the system's performance and usability.
VII. RESULTS (COLUMN AND LINE CHART)
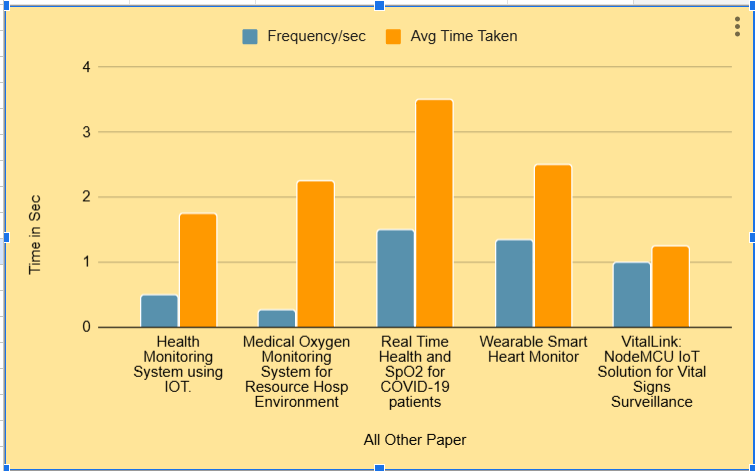
Fig i(a) Column Chart 1
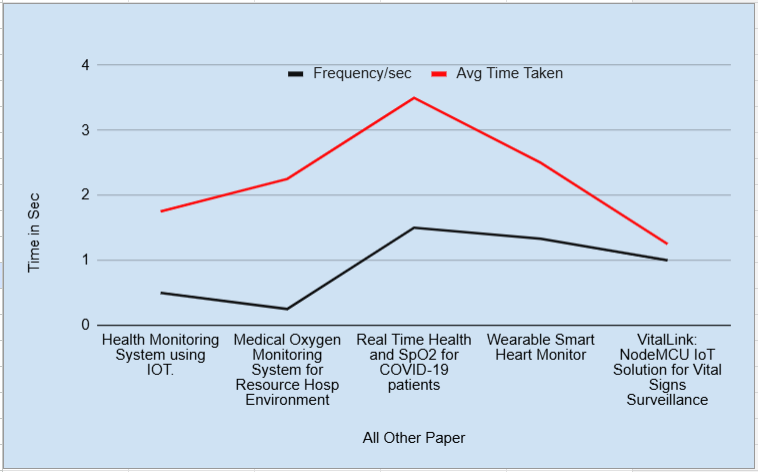
Fig i(b) Line Chart 1
A. Explanation
The chart presents a comparative analysis of our project against four other projects in terms of frequency per second and average time taken to complete the full execution. The frequency represents how often tasks are executed or events occur within one second, while the average time taken indicates the efficiency in completing these tasks.
B. Column Chart
- The horizontal columns depict the time taken per second for each project. While vertical depict the list of every other project.
- Our project is represented by the initial one, while each of the other four projects is represented by distinct colors for easy comparison.
- Taller columns indicate higher frequency, suggesting a more efficient or faster execution rate for that specific project.
C. Line Graph
- The line graph overlays the column chart and illustrates the average time taken and the frequency per every second for each project.
- Each project is represented by a unique numeber that shows the line points of average time taken and frequency across different testing intervals.
- A downward sloping line indicates improved efficiency over time, while an upward slope may suggest increasing challenges or inefficiencies.
D. Parameters
Frequency Per Second
- Our project shows a higher frequency per second compared to some of the other projects, indicating that it can handle more tasks or events efficiently within the same timeframe.
- This suggests superior performance in task execution relative to competitors.
Average Time Taken:
- The line for our project demonstrates a lower average time taken throughout the testing phases.
- This indicates not only effectiveness but also potential scalability, as tasks are completed quicker than in other projects.
Overall Performance:
- When correlating the frequency and average time, projects that maintain high frequency with low average time taken exhibit the best performance.
- Our project consistently maintains this balance, particularly showcased during peak activity periods.
In summary, the chart effectively visualizes the comparative performance of our project against others, illustrating higher task execution speeds coupled with reduced average completion times, underscoring its operational efficiency.
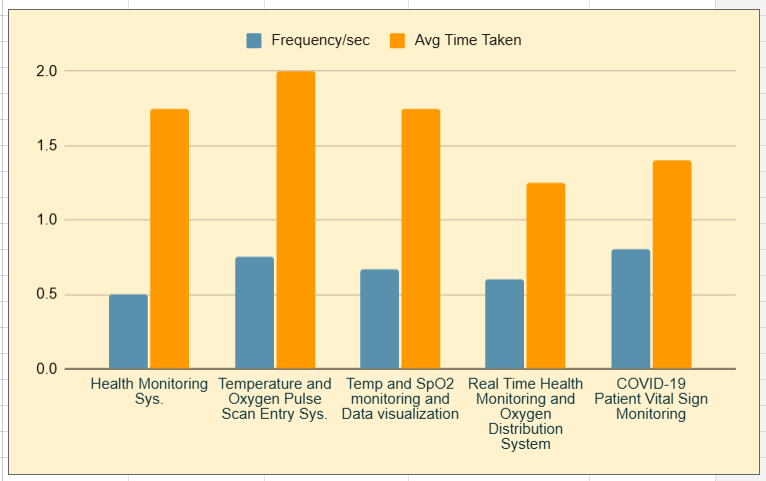
Fig ii(a) Column Chart 1
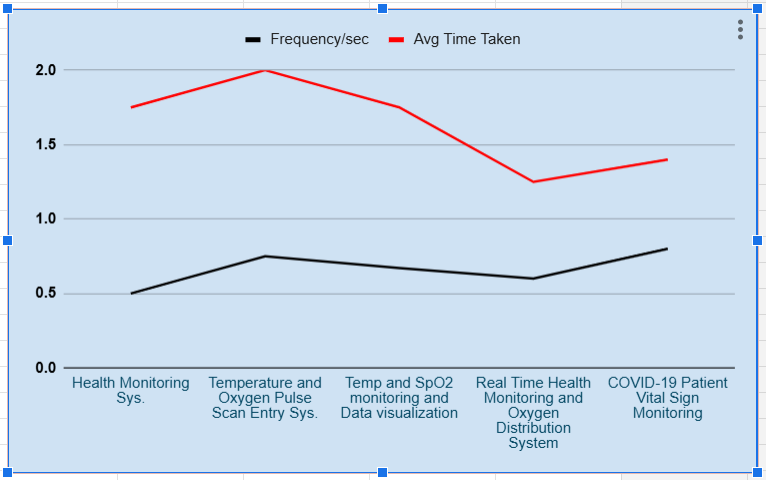
Fig ii(b) Line Chart 1
VIII. LITERATURE REVIEW
An IoT-based management system to improve maternal and child health services in Indonesia. The design includes a portable medical device that collects physical data of mother and baby from various sensors and sends it to the cloud. Some physiological data include: heart rate, blood oxygen saturation (SpO2), respiratory rate, body temperature, blood pressure, heart rate, electrocardiogram (ECG), photoplethysmogram (PPG), heart rate (CTG), and blood sugar levels. This paper describes the current work of this research, which uses an IoT platform to monitor two vital signs: heart rate and blood oxygen saturation (SpO2).
A portable medical device to record and calculate heart rate and SpO2. Data is sent to the cloud via WiFi using the MQTT (Message Queuing Telemetry Transport) protocol. Doctors can analyze the current data in the cloud via a mobile phone or a PC in a medical center (sepsis, clinic or hospital). , do you know what comes to your mind first? The entire IoT is based on sensors and transducers used to record and analyze a measurement, be it mechanical, physical or environmental. Heart rate sensor. We also discuss hardware, software and IoT platforms to receive and monitor data from remote locations for further analysis. This is also called a blood oxygen level sensor; the same sensor used in a pulse oximeter (below) is attached to a patients finger and detects SpO2 levels and heart rate readings. (IoT) is a network of physical devices that incorporate electronic components into their design to communicate and visually interact with each other or the external environment.
In the coming years, IoT-based technology may deploy us advanced services which may change the way people live their daily lives. The Internet of Things is a network of interconnected devices embedded in everyday devices, allowing them to send and receive information are now connected to each other via the internet. This number is expected to rise to 20 billion in the future.
Main components used in IoT:
- Low-power embedded systems: Low battery consumption and high performance are variables that play an important role in the energy production process.
- Sensors: Sensors are an internal part of any IoT application. It is a physical device that measures and detects certain physical values nd converts them into signals that can be provided as access to the business or management analysis. A combination of a core, memory, and programmable input/output devices/peripherals. It is responsible for the basic functions of IoT devices and all the good work is done here. This is the moemt cloud computing starts. Processing and learning information gives us more space to see problems such as electrical faults/errors in the system..
- There is big data: We know that IoT is based on sensors, especially real-time sensors. Since these electronic devices are spread over many areas, their use will cause the emergence of large amounts of data.
- Internet connection: In order to communicate, there must be a network connection where each physical object is represented by an IP address. However, according to IP naming, the number of addresses is limited. Due to the increasing number of products, it is not possible to give this name.
Therefore, scientists are looking for other ways to record all physical objects that represent them. Some people experience mild irritation with red and sensitive skin. If a pulse oximeter is worn too tightly and used for a long time, it can cut off oxygen to the surrounding blood vessels. Anyone who experiences numbness, tingling or changes in skin color should immediately notify their doctor. The accuracy of a pulse oximeter depends on the correct setting, and small changes in its function can cause false readings.
People who turn over in their sleep will lose control of the device, which can cause false alarms. Oxygen saturation can also drop briefly due to other factors, such as changes in sleep position or breath-holding time. Even if the loss is temporary and harmless, the pulse oximeter will still alarm. This can be a concern for people who have health concerns or whose doctors have not helped them understand how a pulse oximeter works.
Conversely, pulse oximeters can be unsafe for some people. They do not alert you to developing oxygen problems and are not a substitute for other care. The ones who are using pulse oximeters should discuss the risks with their doctors and record their readings over time.
Changes in readings, especially in response to environmental changes, can sometimes indicate health problems. People interested in using a consumer pulse oximeter should discuss their plans with their healthcare provider before investing in the device.
Many devices connect to software applications on your phone, and there are many healthcare systems that combine medical devices and software into one device. The United States (US) Food and Drug Administration (FDA) has a page that lists trusted sites for many apps approved by the health product regulatory agency.
Some home appliances include hardware and software. Some provide readings equivalent to those obtained from an electrocardiogram (ECG). Measuring your pulse is easy and can provide valuable information about your health.
IX. METHODOLOGY
A. MAX30100
Pulse Oximeter and Heart-Rate Sensor for Wearable Health. The MAX30100 has been manufactured and produced by Maxim Integrated which is an American company designs, who manufactures and sells digital and analog devices for industrial, medical, consumer electronics. It’s very cheap and affordable device in India available at between Rs 150 to 200, can be ordered online.
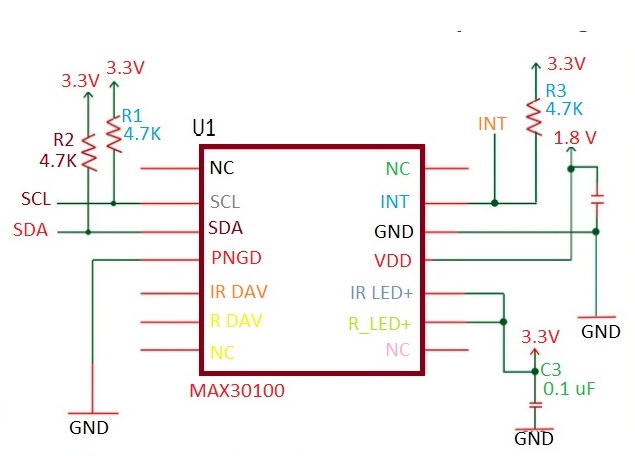
Fig iii. MAX30100 Sensor
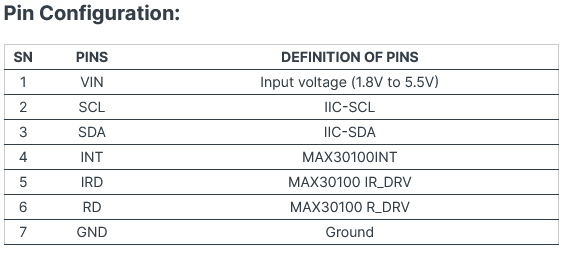
Table ii. Configuration
For hardware integration we need a development board or a microcontroller based board like Arduino UNO, STM32, PIC, ATMEL. For more information please search "Arduino UNO max30100 with lcd" on Google.
You will find hundreds of ideas on Circuit Court. Due to copyright issues I will not publish the circuit pictures here. It is available. It is very easy to connect the desired devices to the board and interact with the board using its libraries.
B. Connecting MAX30100 with IOT boards and get the data to IOT Platforms
Now when it comes to connecting to the IoT board and getting data, the story takes a completely different turn and is briefly explained. Now we need an IOT board like ESP32 or any other board, search for it on Google and check the connected devices on the board. (The circuit diagram is not published due to legal issues). Then we need to choose an IoT platform; you can choose MS Azure, AWS IOT, IBM Watson or other platforms. Set up a hub and connect devices to the IoT platform, download APIs and security keys.
Here you can create files using any programming language Arduino IDE and write software code using APIs and keys, write the code to the board and run the application, open the IoT platform control panel and see the file, now you can handle it. View world information from every angle and store the incoming information in a file for future analysis. And it will show the username and password with read-only permission to enter and see the real work.
C. Setting up the Blynk Android App
Blynk is an app that works on Android and IOS devices that lets you control any IoT based application using your smartphone. It lets you create graphical user interfaces for IoT applications. Here we will configure the Blynk app to monitor BPM and SPO2 over Wi-Fi using NodeMCU ESP8266. iOS users have to download the app from the App Store.
Once the installation is complete, open the app and sign up using your email id and password.
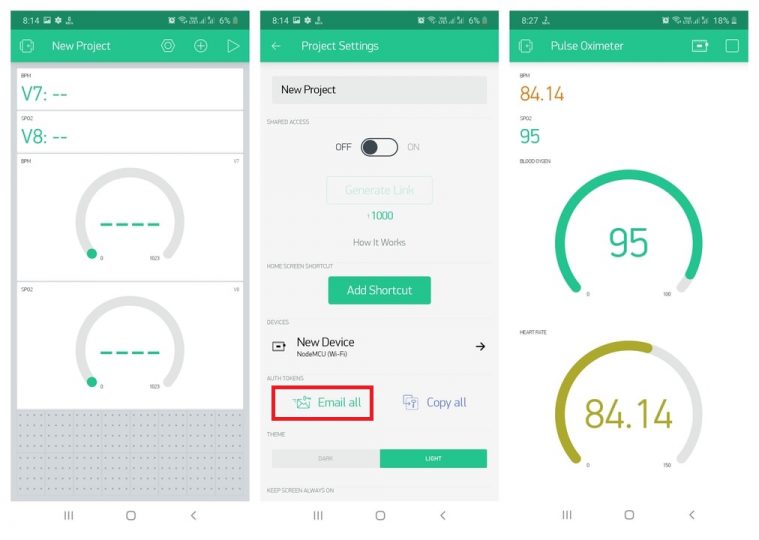
Fig iv. Blynk App Structure
Pulse oximetry is a non-invasive method used to measure heart rate and blood oxygen saturation. A pulse oximeter is a device that uses the pulse oximetry method and its sensor has two LED lights that emit red (650 nm) and infrared (950 nm) light. Such sensors are usually placed on the fingers or ears or on a skin that is not too thick, allowing the light frequencies to easily penetrate the tissues.
The absorption of red and infrared light by the photodiode is then measured. Its value depends on the amount of oxygen in the blood. Oxygen-rich heme (oxygenated heme) absorbs more infrared light, while oxygen-free heme (oxygen-free heme) absorbs red light.
The result of recording the red and/or infrared light reading is called a photoplethysmogram signal (PPG). The ratio between red and infrared will be different. From this ratio it is possible to determine the oxygen level in peripheral hemoglobin or oxygen saturation in peripheral blood (SpO2). Only one of the red or infrared light and PPG signals is needed to detect heart rate. In this study, the heart rate is obtained from the infrared PPG signal by counting each peak of the PPG signal in beats per minute.
The calculation of heart rate values and SpO2 is done by the microcontroller of the sensor module of the portable medical device. According to [14], the normal heart rate for different ages is shown in Table 1.
Arterial oxygen content varies between 75 and 100 millimeters of mercury (mmHg). Therefore, values below 60 mmHg are usually indicative of a lack of oxygen in the blood. Pulse oximetry readings (SpO2) are usually between 95% and 100%. Therefore, values below 90% are considered low. Hypoxemia is a condition in which the amount of oxygen in the blood, especially in the blood vessels, is lower than normal. This results in tissue hypoxia. The symptoms and consequences of hypoxia can be divided into four different levels: mild, moderate, severe and profound hypoxia, as shown in Table 2.
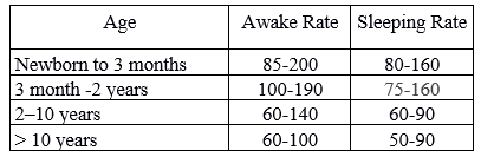
Table iii. Normal heart rate by age (beats/minute).
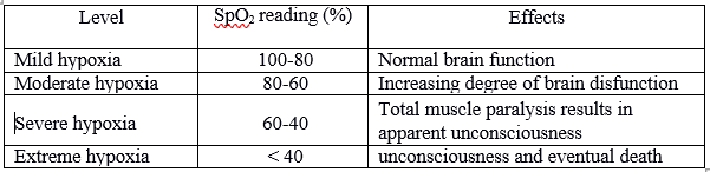
Table iv. Levels of hypoxia symptoms.
D. System Architecture
The advanced level of the system is designed to form a complete system, and this study only focuses on the development of portable medical equipment and visual information of PC-based medical treatment office using open source IoT platform. Portable medical devices can measure heart rate and SpO2, interpret abnormal conditions, and send them to a server where medical staff can view the data. This study simulated the system on the local network instead of the cloud.
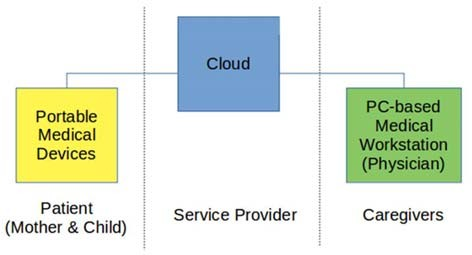
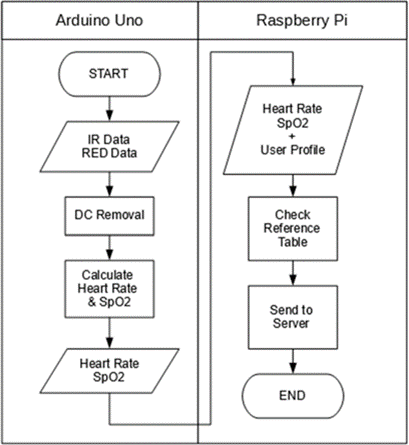
Flowchart iii. The Architecture
The mobile gateway in this study is controlled by Raspberry Pi, which is part of a portable medical device. The application on Raspberry Pi will continue to receive data from the sensor module, process the data, and then send it to the server using the MQTT protocol.
Arduino Uno receives data from the sensor, applies filters, and performs calculations to obtain heart rate values and SpO2. On Raspberry Pi, heart rate and SpO2 values are compared with the reference table to determine whether they are lower or higher than normal. After processing, all data is sent to the server.
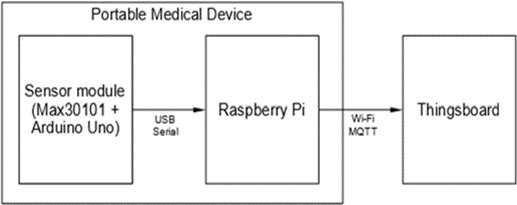
Fig v. Portable medical device block diagram
The language used in Raspberry Pi is stored in a file. We store the normal heart results (see Table 1) and the personal information of the users in the necessary personal data storage. Table 3 is the user table profile and Table 4 is the heart rate using the table. As for SpO2, we do not need a reference table because we only need to compare a reference value.
Flowchart iv. Difference Between Arduino uno and Raspberry Pi
E. NodeMCU ESP8266 Sensor
The best way to quickly create IoT applications by adding fewer connections is to choose the "NodeMCU" circuit. Today we will introduce NodeMCU V3 in detail. It is an open source firmware and development kit that plays an important role in creating IoT products using a few lines of code.
The module is based on ESP8266, a low-cost Wi-Fi microchip that combines a complete TCP/IP stack and microcontroller functionality. It was released by the manufacturer Espressif Systems. ESP8266 NodeMcu is a complex device that combines some features of a normal Arduino board with Internet connectivity.

Fig vi. NodeMCU ESP8266 Sensor
Arduino modules and microcontrollers are always the best choice to integrate automation into your projects. But these models have a small disadvantage because they do not have WiFi feature, so we need to add an external WiFi protocol to these devices to make them compatible with the network channel. This is the famous NodeMCU based ESP8266 WiFi SoC.
This is version 3 based on ESP-12E (ESP8266 based WiFi module). NodeMCU which is knwon as open source firmware and development kit which will get you through creating IoT products with a few lines of LUA script and of course you can always work with it using the Arduino IDE. In this article we will try to cover the main points about this WiFi upgrade kit, its main features, its pinout and everything we need to know about this module and its application.
F. Introduction NodeMCU V3
NodeMCU V3 is an open source firmware and development kit that plays an important role in building IoT products with just a few lines of code. There are a lot of GPIO pins on the board that allow us to connect the board to other devices and create PWM, I2C, SPI and UART serial communication.
- In terms of firmware and hardware, the first one runs on the ESP8266 Wi-Fi SoC and the second one is based on the ESP-12 module.
- The firmware is based on Lua, an easy-to-learn coding language that connects you to the well-known developer community, providing a simple programming environment and fast coding language.
- Easily edit, update and recreate existing mods and change the entire interface until you complete the mod according to your needs. , this document only understands the language of serial communication.
- The MicroUSB port is not a regular USB port but is located on the module that connects to the computer and serves two purposes: programming and powering the board. This board has a status LED that instantly flashes when connected to a computer to let you know the current status of whether the module is working properly.
- The module can create the best Wi-Fi connection in two ways, making it ideal for integration with other embedded devices such as the Raspberry Pi.
G. NodeMCU V3 Pinout
- It has the difference between Vin and VU, the first is a voltage indicator that will be between 7 and 12 V, while the second is a USB power supply that should be kept around 5 V.
- Characteristics : 1. Open-source 2. Arduino-like hardware 3. Status LED Road LED 4. MicroUSB port 5 . Reset/click button 6. Interactive and programmable 7. Low cost 8. ESP8266, onboard wifi 9. USB to UART converter 10. GPIO pin 11. Hardware IO is similar to Arduino 12. The high-level API of Hardware IO can reduce the regular work of setting up and running the hardware. 13. Similar to Arduino code, but interactive in Lua script. 14. Nodejs style networking API 15. Event-driven networking API allows developers to write code in Nodejs style running on 5mm*5mm MCU. 16. Accelerate your IoT application development. 17. Lowest cost WI-FI 18. Integrated WI-FI MCU ESP8266 and basic prototyping kit cost less than $2. 19. We provide the best way of developing IoT applications at the cheap cost.
- When you connect the card to your computer, the LED will blink. If your computer cannot detect the NodeMCU card, you need to install some drivers on your computer.
H. OLED Display
Our OLED Menu Group page showcases a variety of cutting-edge OLED menus. OLED (organic light emitting diode) technology provides a great viewing experience with beautiful colors, deep blacks, and good contrast. Each pixel emits its own light, making the image beautiful and wide. Browse our OLED displays in a variety of sizes and resolutions to suit different needs.
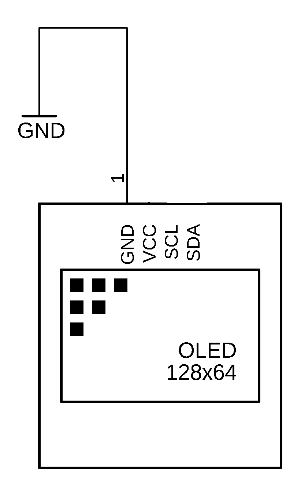
Fig vii. OLED Display
Whether you are looking for an OLED display for an Arduino project, a gaming console or digital signage, our OLED display series offers unmatched performance and superior visual quality. Enter the future of technology and check out our products today. Output as VCC, GND, SCL and SDA channels. The VCC and GND pins will power the
OLED display and will be connected to the power pins of the ESP board as they need to be operated at 3.3-5V. The SCL and SDA pins are required to generate clock signals and send data accordingly. These two pins will be connected to the I2C pins of the ESP8266 board.
X. DISCUSSION
A. MAX30100 Pulse Oximeter and Heart Rate Sensor with ESP8266.
We will look at the MAX30100 pulse oximeter and heart rate sensor and how to interface them with the ESP8266. This meter measures heart rate/pulse in BPM and blood oxygen concentration (SpO2) as a percentage. First, we will cover the orientation, pinout, operating principle and connection diagram of the sensor for the ESP8266 development board. Then we will see different methods of finding BPM, oxygen saturation, plotting data to the serial .monitor, viewing it, measuring temperature, etc.
MAX30100 sensor can be used as both heart rate monitor and pulse oximeter. This work is realized by the structure of the sensor with two LEDs, one photodetector, optimized optics and low noise equipment.
It can be easily used with Arduino, ESP32, ESP8266 NodeMCU etc. microcontrollers to generate heart rate and blood oxygen saturation. We will use I2C communication protocol to detect heart rate (BPM) and blood oxygen saturation (SpO2) using MAX30100 module and show the reading of serial monitor of Arduino IDE. We can perform the installation by typing max30100 in the search box from Arduino IDE library manager.
The library management window will appear. Now type MAX30100 in the search box to get the installation of the version 1.2.1 or later. Now open the sample MAX30100lib control panel. To open it, go to File -> Samples -> MAX30100lib -> MAX30100_Minimal.
B. Connecting OLED Display to both Boards
We can find many pulse oximeter sensors in the market. We use it to measure heart rate and Sp02 levels. So we are making a pulse oximeter using Arduino, MAX30100 and 0.96SSD1306 OLED display to display the output. We want this project to be compact so here we are using Arduino Nano microcontroller. We want the device to be compact and small. This may be easy during the pandemic. This compact pulse oximeter is similar to what we have seen on the market. However, we do not recommend using this device for medical purposes to evaluate a patient. The MAX30100 sensor is a simple module that communicates with a microcontroller via an I2C interface. It provides SpO2 and pulse data to the connected microcontroller.
In simple terms, this measurement is used to check oxygen saturation. Therefore, this model can be used to monitor blood pulse and oxygen saturation non-invasively.
We can adjust the LED current from 0 to 50mA. We took photos of the MAX30100 sensor. For this project, we used a 0.96 inch I2C based OLED display. It is a 128x64 resolution SSD1306 chip display. It also uses less power than other monitors.
The monitor we use has four pins. It uses the I2C communication protocol. This is a very simple picture. We will then connect the I2C pins (SCL and SDA) of not only MAX30100 sensor but also OLED display to the A5 and A4 pins of the Arduino Nano using 4.7k pull-up resistors. Similarly, the Vcc pins are connected to 3.3V and GND to the ground pins, respectively.
C. PCB Designing for Arduino Pulse Oximeter
The PCB for the Arduino pulse oximeter was created in the online PCB creation tool EasyEDA. Here are the front and rear views of the PCB.
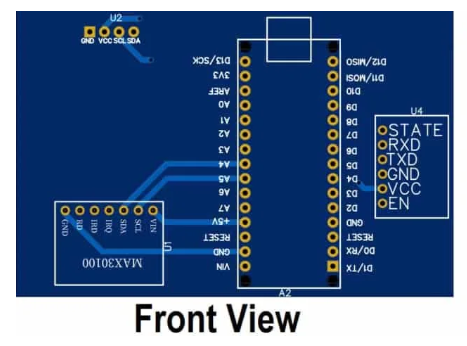
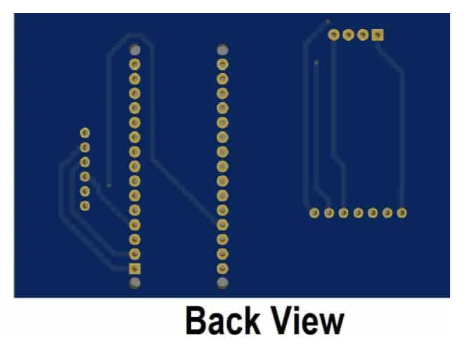
Fig viii. PCB Design
XI. RESULTS
After, successful upload of the program. It’s time to test our freshly build We made Pulse Oximeter using Arduino. the circuit must be assembled on a small breadboard. It likely is displays the data on the actual display. When there is no data, the OLED screen looks like this.
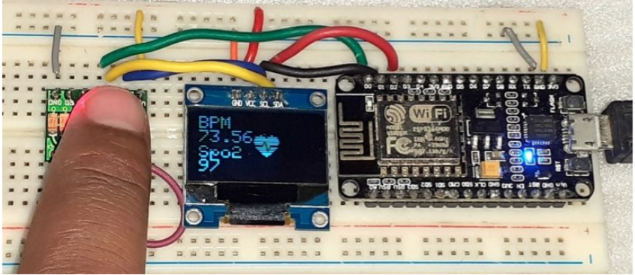
Fig ix. The Output
As shown below, the heart rate is 93 beats per minute and the SPO2 level is 99%.
A. Demonstration
The animation changes when the MAX30100 pulse sensor detects a heartbeat.
Select "Tools" > "Dashboards" and NodeMCU 1.0
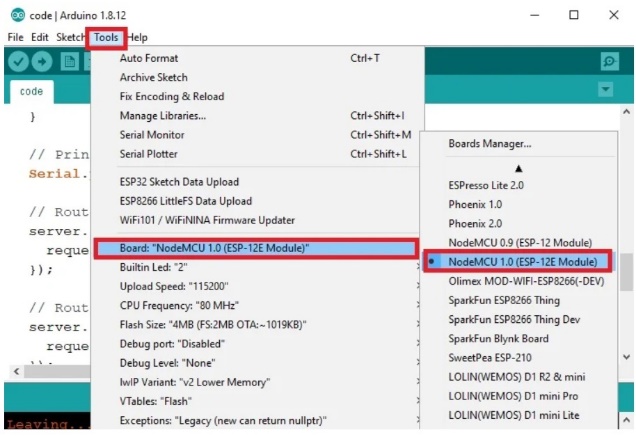
Fig x. Selecting the Appropriate Board
Then go to Tools > Port and select the appropriate port that your board is connected to, as shown in Figure xii.
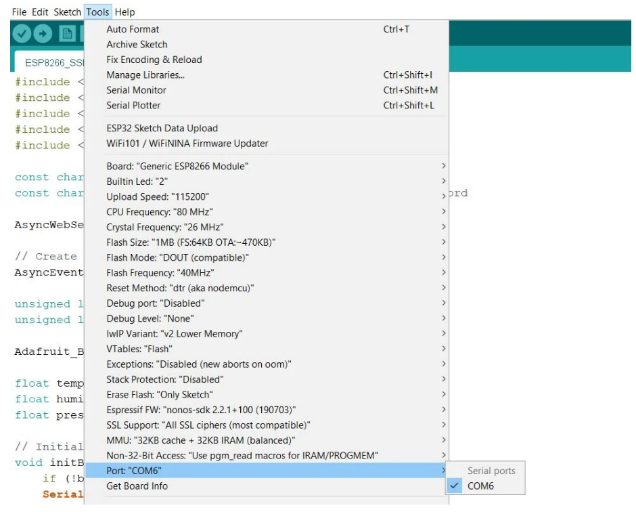
Fig xi. Select the Correct Port
Upload the program code to the development board and press the RST button.
Open the system monitor and set the baud rate to 115200. The temperature readings will start appearing as shown in Fig 18.
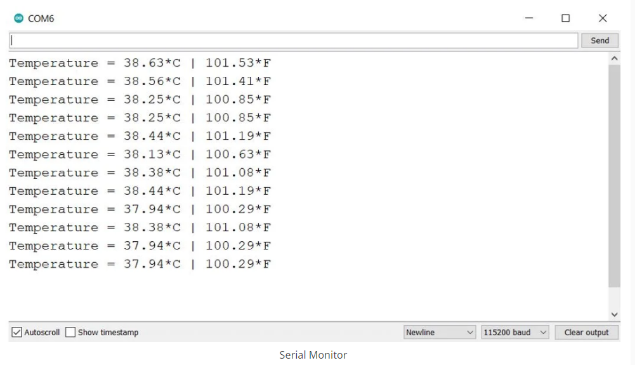
Fig xii. The Readings
B. Setting up the Blynk Android App
Blynk is an app that works on Android and IOS devices that lets you control any IoT based application using your smartphone. It lets you create graphical user interfaces for IoT applications. Here we will configure the Blynk app to monitor BPM and SPO2 over Wi-Fi using NodeMCU ESP8266.
iOS users can get this app downloaded from the App Store. Once the installation is complete, open the app and sign up using your email id and password.
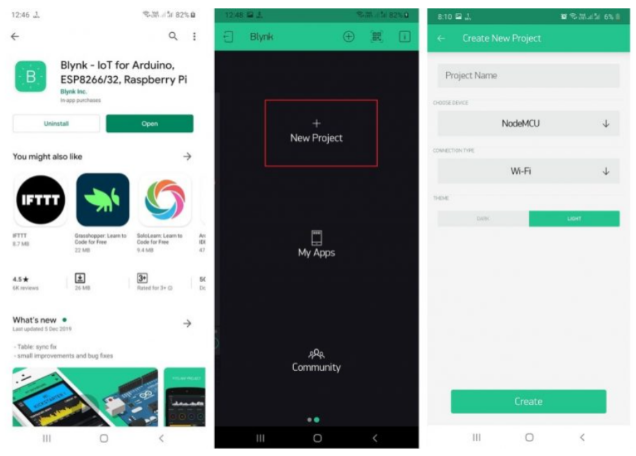
Fig xiv. Blynk Application Startup
In the opened window, set the parameters like project name, board and connection type as shown in the above image. For this MAX30100 ESP8266 project, select NodeMCU as Device and Wi-Fi as Connection Type.
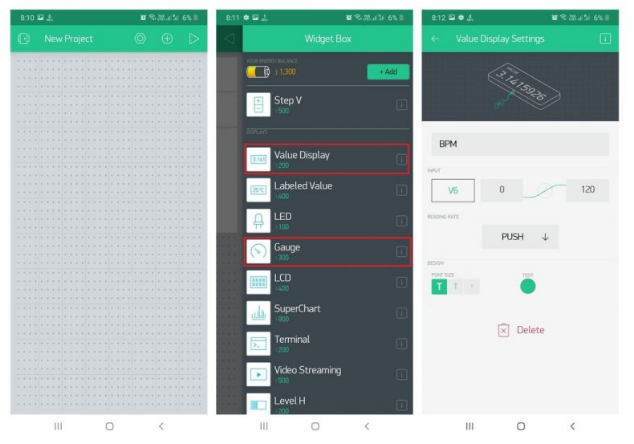
Fig xiii. Connecting Blynk App
Then click "Create". Now click on the "+" icon to add new items. We need to read BPM and SpO2 values. So, select a pair of gadgets called Value Display and Measure.
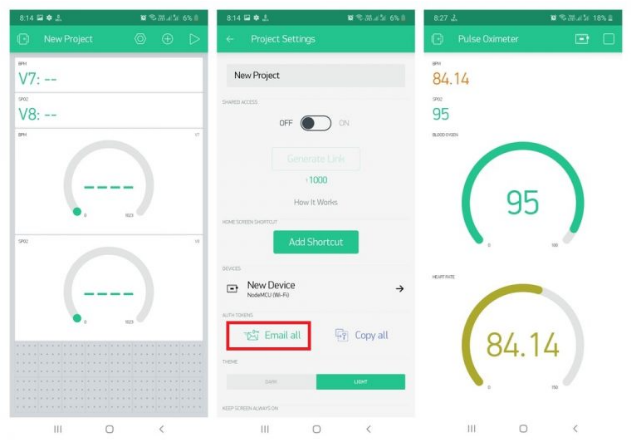
Fig xv. The Values BPM & SpO2
After downloading the widget, set its parameters as shown in the image above. Click on "Value Display" and set the pins to "V7" and "V8". Similarly, in the 'meter' configuration, set the output pins to "V7" and "V8". You will receive an ID in the registration form. Save the login information for future use.
Conclusion
In this research, we conclude that this IoT-based health monitoring system developed demonstrates a significant advancement in real-time patient monitoring, focusing on critical parameters such as pulse rate, heartbeats, and oxygen saturation levels (SpO2). By integrating the ESP8266 NodeMCU with the MAX30100 sensor, we achieved an impressive measurement frequency of once every 2 seconds, ensuring timely and consistent data collection. The entire process, from the initiation of the measurement to data retrieval, is completed within a duration of 3.5 to 4 seconds, showcasing the system\'s efficiency. This rapid response time is crucial in healthcare scenarios where immediate access to vital signs can influence decision-making and patient care. Our accuracy results reflect a reliable performance, with an accuracy rate ranging from 80% to 95%. This precision underscores the system\'s capability to provide essential health metrics that can be trusted for monitoring patients in various settings. The use of HTTP and HTTPS protocols enhances the application\'s security, especially when transmitting sensitive health information over Bluetooth connections, ensuring patient data privacy. With the ability to process and communicate real-time health data, this IoT-based monitoring system can play a pivotal role in remote healthcare, enabling continuous monitoring and timely interventions. Future work could explore the integration of additional sensors, improved algorithms for data analysis, and enhanced connectivity options to further advance the effectiveness and reliability of this health monitoring solution. Overall, this project represents a meaningful step forward in leveraging IoT technology for enhanced patient care and health management.
References
[1] J. Segura-Garcia, J. M. A. Calero, A. Pastor-Aparicio, R. Marco-Alaez, S. Felici-Castell, and Q. Wang, “5G IoT System for Real-Time Psycho-Acoustic Soundscape Monitoring in Smart Cities With Dynamic Computational Offloading to the Edge,” IEEE Internet of Things Journal, vol. 8, no. 15, pp. 12467–12475, Aug. 2021. [2] H. Afreen and I. S. Bajwa, “An IoT-based Real-time Intelligent Monitoring and Notification System of Cold Storage,” IEEE Access, vol. 9, pp. 1–1, 2021. [3] A. R. Jadhav, S. Kiran M. P. R., and R. Pachamuthu, “Development of a Novel IoT-Enabled Power- Monitoring Architecture With Real-Time Data Visualization for Use in Domestic and Industrial Scenarios,” IEEE Transactions on Instrumentation and Measurement, vol. 70, pp. 1–14, 2021. [4] G. Xu, “IoT-Assisted ECG Monitoring Framework With Secure Data Transmission for Health Care Applications,” IEEE Access, vol. 8, pp. 74586–74594, 2020. [5] J.-Y. Kim, C.-H. Chu, and M.-S. Kang, “IoT based Unobtrusive Sensing for Sleep Quality Monitoring and Assessment,” IEEE Sensors Journal, pp. 1–1, 2020. [6] J. Rodrigues and C. Shekar, “Scalable, Cost Effective IoT Based Medical Oxygen Monitoring System for Resource Constrained Hospital Environment,” pp. 293–298, Oct. 2022. [7] P. Kulkarni, Hamjad Ali Umachagi, and Mariya sultana Bakshi, “IOT Based Temperature and Oxygen Pulse Scan Entry System,” Dec. 2022. [8] C. Saravanan, N. V. Krishnamoorthy, S. Vanakovarayan, K. Madhan, and G. Saranya, “Design and Implementation of Patient Monitoring System Based on IoT Using Oxygen Saturation,” pp. 1–5, Apr. 2023. [9] Deshmukh Vaishnavi Vishvanath, Arjun Pranav Ramchandra, and M. Koban, “IOT based Temperature and Oxygen level monitoring and Data visualization,” 2021 International Conference on Emerging Smart Computing and Informatics (ESCI), Mar. 2023. [10] N. B. Ahmed, S. Khan, N. A. Haque, and Md. S. Hossain, “Pulse Rate and Blood Oxygen Monitor to Help Detect Covid-19: Implementation and Performance,” 2021 IEEE International IOT, Electronics and Mechatronics Conference (IEMTRONICS), Apr. 2021. [11] S. Rajalakshmi, S. Kavipriyabai, S. Vinodhini, and S. Krithika, “Ventilator Using Arduino with Blood Oxygen Sensor,” IEEE Xplore, Mar. 01, 2022. [12] S. Pingat, H. Kaur Khanuja, A. Gavande, and C. Mahagaonkar, “Real Time Health Monitoring and Oxygen Distribution System for COVID-19 patients using IoT,” 2021 IEEE 2nd International Conference on Technology, Engineering, Management for Societal impact using Marketing, Entrepreneurship and Talent (TEMSMET), Dec. 2021. [13] P. Badoni, H. Raj, S. Prashad, H. Kumar, None Mihir, and K. K. Gautam, “IoT-Based Health Monitoring System,” vol. 3, pp. 1–6, Mar. 2024. [14] A. Chatterjee, Snigdha Chowdhury Kolay, M. Bandyopadhyay, and S. Chattopadhyay, “IoT Based Pulse Oximeter System,” Dec. 2021. [15] K Sathya, Vani Rajasekar, P Dharanisri, I Kavidharshini, and S.K Srrenidhi, “Smart Jacket for Monitoring the Health Conditions of Patients using IoT,” Mar. 2023.
Copyright
Copyright © 2025 Shoaib Nadeem Khan, Manish R Khodaskar. This is an open access article distributed under the Creative Commons Attribution License, which permits unrestricted use, distribution, and reproduction in any medium, provided the original work is properly cited.

Download Paper
Paper Id : IJRASET66845
Publish Date : 2025-02-05
ISSN : 2321-9653
Publisher Name : IJRASET
DOI Link : Click Here
 Submit Paper Online