

Ijraset Journal For Research in Applied Science and Engineering Technology
Heart Disease Prediction Using R
Authors: Gowri J
DOI Link: https://doi.org/10.22214/ijraset.2025.66966
Certificate: View Certificate
Abstract
Heart disease is one of the leading causes of mortality worldwide, making early detection and prevention critical for improving healthcare outcomes. This project focuses on leveraging machine learning techniques in R to develop predictive models for heart disease based on a dataset comprising demographic, behavioral, and medical risk factors. The dataset includes features such as BMI, smoking status, alcohol consumption, physical activity, mental and physical health conditions, and other indicators. The project explores and compares the performance of multiple machine learning algorithms, includ- ing Logistic Regression, Decision Trees, Random Forests, and Gradient Boosting (XGBoost), for predicting the likelihood of heart disease. Extensive data preprocessing, feature engineering, and model evaluation techniques are applied to ensure the accuracy and reliability of predictions. The models are evaluated using metrics such as accuracy, precision, recall, and F1 score, and visualization techniques are employed to interpret model performance and feature importance. The best-performing model achieves high accuracy, demonstrating its potential for identifying individuals at risk of heart disease. Additionally, the project in- cludes a user-friendly prediction function that accepts individual patient data as input and provides risk predictions, facilitating clinical decision-making. By combining statistical rigor with machine learning, this project provides a data-driven approach to heart disease prediction, aiming to enhance early intervention strategies, reduce healthcare costs, and ultimately save lives.
Introduction
I. INTRODUCTION
Heart disease prediction is a crucial application of data science and machine learning in healthcare, aiming to identify individuals at risk of cardiovascular conditions such as coro- nary artery disease, heart attacks, and strokes. Early detection is essential for preventing severe outcomes and improving patient care. Predictive modeling leverages risk factors like age, gender, blood pressure, cholesterol levels, smoking, dia- betes, and physical activity to assess heart disease likelihood. R, an open-source programming language, provides powerful libraries such as caret, Random Forest, and e1071 for data preprocessing, machine learning, and model evaluation.The process begins with data collection and cleaning, incorpo- rating demographic, clinical, and lifestyle factors, followed by exploratory data analysis (EDA) using visualization tools like ggplot2 to identify patterns and correlations. Machine learning models, including logistic regression, decision trees, random forests, and gradient boosting, are applied to uncover relationships between risk factors and heart disease. Feature selection and dimensionality reduction techniques enhance model efficiency while preventing overfitting. Evaluation met- rics such as accuracy, sensitivity, specificity, and AUC-ROC, using tools like ROCR and pROC, help optimize model per- formance. Once developed, these models can be deployed for real-time predictions, assisting clinicians in identifying high- risk individuals and tailoring interventions. The integration of R’s predictive capabilities with healthcare systems supports precision medicine, improving patient outcomes and reducing healthcare costs through personalized, data-driven decision- making.
II. PROPOSED WORK
A. Objectives
The objectives of this study focus on early detection and prevention of heart disease by identifying individuals at risk through the analysis of key medical and lifestyle data, al- lowing for timely interventions to halt disease progression. By leveraging R’s statistical and machine learning tools, the project aims to develop accurate predictive models based on risk factors such as age, cholesterol levels, blood pressure, and lifestyle habits.
Additionally, it seeks to enhance diagnostic accuracy by providing healthcare professionals with data- driven insights to supplement traditional diagnostic methods. A thorough risk factor analysis will be conducted to quantify the impact of various contributors to heart disease, offering valuable insights for researchers and clinicians. Ultimately, this study aims to promote personalized healthcare by tailoring treatment and prevention strategies to individual risk profiles, facilitating the shift from generalized to precision medicine.
B. Problem Statement
Heart disease remains one of the leading causes of morbidity and mortality worldwide, posing a significant challenge to healthcare systems and societies. Despite advancements in medical technology, early diagnosis and effective prevention strategies are still limited due to the complex interplay of genetic, lifestyle, and environmental factors contributing to heart disease. Traditional diagnostic methods often rely on manual assessments, which can be time-consuming, prone to errors, and insufficient for detecting individuals at risk in early stages.
There is a pressing need for an efficient, data- driven approach to predict the likelihood of heart disease, enabling early interventions and personalized treatment plans. Leveraging R, an open-source programming language with robust statistical and machine learning capabilities, offers a powerful solution to address this gap. The challenge lies in processing and analyzing large, heterogeneous datasets to 3 develop accurate and interpretable predictive models. These models must identify key risk factors, provide reliable predictions, and integrate seamlessly into healthcare practices to improve patient outcomes and reduce healthcare costs.
Thus, the objective is to utilize R’s analytical power to create predictive models for heart disease, ensuring they are accurate, scalable, and actionable for clinical and public health applications.
III. Existing System
The existing systems for heart disease prediction primarily rely on traditional diagnostic methods and manual assess- ments, often complemented by rule-based systems and limited use of predictive technologies. These systems generally incor- porate clinical evaluations, medical imaging, and laboratory tests, such as electrocardiograms (ECG), echocardiograms, stress tests, cholesterol level checks, and blood pressure measurements.
While effective for diagnosing existing conditions, these methods often fail to predict the likelihood of heart disease at an early stage, especially in asymptomatic individu- als. Many healthcare institutions use electronic health records (EHR) to store patient data, but this data is underutilized for predictive purposes. Some systems employ basic statistical methods or scoring tools, like the Framingham Risk Score or ASCVD Risk Calculator, to estimate the probability of developing heart disease based on predefined factors.
However, these approaches have limitations, including reliance on simplified assumptions, lack of personalization, and inability to handle complex, nonlinear relationships between variables. In recent years, machine learning and data analytics have been introduced into heart disease prediction systems. While strides have been made in leveraging technology for heart disease prediction, the existing systems remain constrained by scalability, accuracy, and accessibility issues, underscoring the need for more advanced, flexible, and interpretable solutions.
IV. PROPOSED SYSTEM
The proposed system is a comprehensive, data-driven frame- work designed to predict the likelihood of heart disease with enhanced accuracy and usability. Leveraging advanced statistical and machine learning techniques in R, it addresses limitations of existing methods, such as inefficiency in early detection, lack of personalization, and limited interpretability. The system incorporates multiple predictive models, including Logistic Regression, Decision Trees, Random Forests, and XGBoost, to analyze key risk factors and identify pat- terns associated with heart disease.
It features robust data preprocessing by converting categorical variables into factors and splitting data into training and testing sets for effec- tive validation. Additionally, it provides user input prediction functionality, ensuring data consistency and compatibility with trained models. Model evaluation is performed using accuracy metrics and visual comparisons to identify the best-performing approach.
The system also includes visual analytics, offering insights through accuracy comparisons, feature importance analysis, correlation heatmaps, and heart disease prevalence by age group. Key advantages of the system include enhanced accuracy,with Logistic Regression achieving 91.6 percentage as accuracy along with personalized predictions based on user health metrics, and comprehensive risk factor analysis to aid in preventive measures and clinical decision-making. Designed for interactivity, scalability, and adaptability to various health- care environments, this system integrates machine learning, automation, and visual analytics into a unified framework, making heart disease prediction more reliable, actionable, and accessible for both healthcare professionals and individuals.
V. BLOCK DIAGRAM
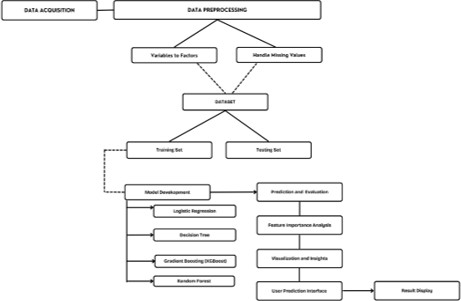
Fig. 1. Block Diagram of the Proposed System
The process begins with data acquisition, where relevant medical and lifestyle data are collected. The next step is data preprocessing, which involves converting categorical vari- ables into factors and handling missing values to ensure data integrity. Once preprocessing is complete, the dataset is divided into training and testing sets, facilitating model validation. In the model development phase, multiple machine learning models—Logistic Regression, Decision Tree, Gra- dient Boosting (XGBoost), and Random Forest—are trained on the dataset to identify key risk factors and predict heart disease. The trained models are then subjected to prediction and evaluation, where their performance is assessed using accuracy metrics. A feature importance analysis is conducted to determine the most influential factors contributing to heart disease. Furthermore, visualization and insights are generated through various graphical representations, helping to interpret model outcomes. A user prediction interface allows individuals to input their health metrics and obtain a prediction regarding their heart disease risk. Finally, the system presents the results through a result display, making the predictions accessible and interpretable for users and healthcare professionals alike.
A. Libraries used and their Description
The heart disease prediction project utilizes a variety of R libraries to ensure efficient data processing, model training, evaluation, and visualization. dplyr is employed for data manipulation tasks such as filtering, selecting, grouping, and summarizing data, with key functions like lapply for con- verting categorical variables to factors and select_if for filtering numeric features.
Caret plays a crucial role in training and evaluating machine learning models by providing tools for data partition- ing, preprocessing, and model training, using functions like createDataPartition to split the dataset into training and testing sets. The randomForest library is used to implement the Random Forest algorithm, enhancing classifi- cation accuracy while reducing overfitting, with functions like randomForest for training models and importance for extracting feature importance scores.
Similarly, rpart is utilized for building classification and regression trees with the rpart function. For high- performance gradient boosting, Xgboost is employed to handle structured data classification and regression through the xgboost function.
Model evaluation and performance visualization are sup- ported by ROCR, which is used for generating ROC curves and other metrics. Data visualization is a critical component, with ggplot2 providing functions like geom_bar for bar plots, geom_boxplot for box plots, and labs for adding labels and titles. Lattice assists in creating trellis graphics, particularly useful for multivariate data visualization, while reshape2 is used for reshaping and aggregating data with the melt function for creating heatmaps and other visuals.
ggcorrplot simplifies the creation of correlation matrix visualizations, using ggcorrplot to generate heatmaps with customizable layouts. To enhance graphical inter- pretation, RColorBrewer provides color palettes, with scale_fill_brewer adding color schemes to plots. Lastly, Base R is indispensable for fundamental operations such as calculating model accuracy using mean and converting data to data frames with as.data.frame.
Collectively, these libraries facilitate a seamless workflow from data preprocessing to predictive modeling and visual- ization, making the heart disease prediction system robust, interpretable, and efficient.
VI. METHODOLOGY
The heart disease prediction system employs various techniques for data loading, preprocessing, machine learning modeling, accuracy comparison, user prediction, and data visualization. Initially, the dataset is loaded from a CSV file into an R data frame, where categorical predictors such as Smoking and Alcohol Drinking, along with the target variable Heart Disease, are converted into factors to ensure appropriate treatment during analysis. The dataset is then split into training (70%) and testing (30%) sets using the create DataPartition function from the caret pack- age, ensuring stratified sampling for balanced representation. For machine learning modeling, Logistic Regression is implemented as a baseline model, predicting heart disease probabilities that are converted into binary classes using a 0.5 threshold, with accuracy calculated based on test set predictions. A Decision Tree is constructed using the rpart package, where nodes represent decision conditions and leaves denote classification outcomes. The Random Forest model, trained using the random Forest package, enhances predic- tion accuracy and reduces over fitting by combining multiple decision trees while calculating feature importance based on the Gini impurity criterion. Additionally, Gradient Boosting with XGBoost is implemented using the xgboost package, transforming data into matrix form and training a binary classification model that outputs probabilities converted into binary classes.
To compare model performance, the accuracy of all models is stored in a vector and visualized using a bar chart generated with ggplot2. A custom user prediction function (predict_heart_disease) is also developed, prepro- cessing user input, applying the trained model, and returning a predicted probability and classification.
Data visualization techniques enhance interpretability, in- cluding accuracy comparison through bar charts, BMI distri- bution analysis using boxplots to show BMI variations across heart disease categories, and feature importance analysis via bar charts displaying influential predictors from the Ran- dom Forest model. A correlation heatmap, generated using the ggcorrplot package, illustrates relationships between numeric features, while a stacked bar chart highlights heart disease prevalence across different age groups, emphasizing trends in risk distribution.
Collectively, these techniques ensure a robust and interpretable heart disease prediction system, integrating advanced machine learning and visualization strategies for improved decision-making.
A. Dataset
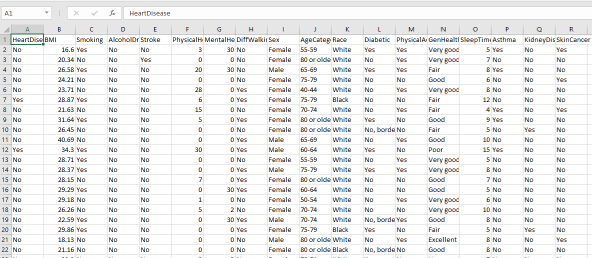
Fig. 2. Dataset
The dataset comprises 319,795 individuals recorded across 18 columns, containing a mix of categorical and numeric vari- ables relevant to heart disease prediction. The target variable, HeartDisease, indicates whether an individual has been diag- nosed with heart disease (Yes/No). Key health metrics include BMI (Body Mass Index), PhysicalHealth (number of days with physical health issues in the past 30 days), MentalHealth (days with mental health concerns in the past 30 days), and SleepTime (average hours of sleep per night). Lifestyle factors such as Smoking, AlcoholDrinking, and PhysicalActivity are included, along with medical history indicators like Stroke, Di- abetic, Asthma, KidneyDisease, and SkinCancer. Additionally, demographic details such as Sex (Male/Female), AgeCategory (e.g., ”55-59”, ”80 or older”), and Race (e.g., White, Black) provide deeper insights into potential risk factors. A notable advantage of the dataset is that it contains no missing values, ensuring complete data for analysis. The dataset includes categorical variables (e.g., Smoking, Sex, GenHealth) and numeric variables (e.g., BMI, SleepTime), enabling diverse data processing techniques. Basic statistics reveal an average BMI of approximately 28.33 with a standard deviation of 6.36, and an average sleep duration of around 7.1 hours per night. Most individuals reported no history of smoking, alcohol consumption, or major health conditions, highlighting the importance of analyzing both lifestyle and medical factors for heart disease risk assessment. This dataset provides a rich foundation for predictive modeling and exploratory analysis to identify critical patterns in heart disease prevalence.
VII. VISUALIZATIONS
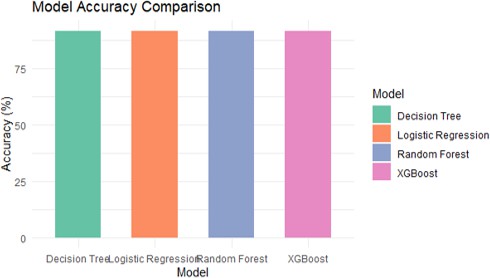
Fig. 3. Model accuracy of different Models
This bar chart illustrates the accuracy comparison of four different machine learning models used for predicting heart disease. The x-axis represents the models (Decision Tree, Logistic Regression, Random Forest, and XGBoost), while the y-axis shows their respective accuracy in percentage.
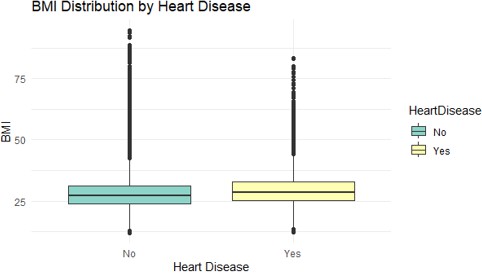
Fig. 4. BMI Distribution by Heart Disease
This box plot shows the distribution of Body Mass Index (BMI) among individuals, categorized by whether they have heart disease (”Yes”) or not (”No”). This visualization suggests a possible association between higher BMI and the presence of heart disease, although the overlap in distributions indicates BMI alone is not a definitive predictor.
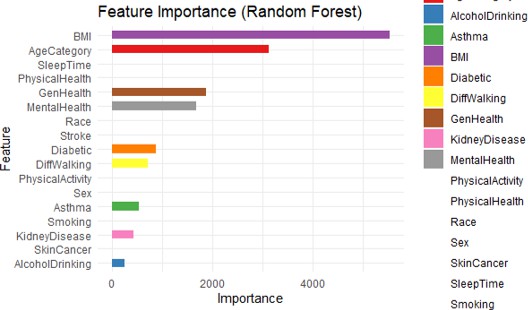
Fig. 5. Feature Importance of Random Forest
This bar chart displays the Feature Importance from the Random Forest model, showing which variables contributed the most to predicting heart disease. This chart helps prioritize features for further analysis and provides insights into the key drivers of heart disease in the Random Forest model.
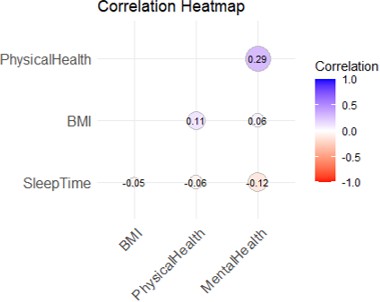
Fig. 6. Correlation Heatmap
This heatmap shows the correlation coefficients between selected variables in the dataset. The correlation values range from -1 (strong negative correlation) to +1 (strong positive cor- relation), with 0 indicating no correlation. This visualization provides insights into the relationships among the variables, helping identify factors that may influence each other.
VIII. FUTURE SCOPE
The future scope of heart disease prediction using R is vast, with potential advancements in machine learning, data integration, and clinical applications. Below are some key areas of development:
- Integration with Real-Time Health Monitoring Systems
- Implement predictive models into wearable devices and IoT-based healthcare applications.
- Continuous monitoring of vital signs (e.g., heart rate, blood pressure) with dynamic risk prediction updates.
- Enhancing Model Performance with Advanced Techniques
- Incorporating deep learning techniques such as Neural Networks and LSTMs.
- Using ensemble methods and hybrid models for improved accuracy.
- Applying feature selection and dimensionality reduction techniques.
- Personalized Risk Prediction Models
- Customizing models based on patient profiles, genetics, and lifestyle factors.
- Developing personalized treatment recommendations based on predictive insights.
- Integration with Electronic Health Records (EHRs)
- Connecting predictive models with hospital databases and EHR systems.
- Automating risk analysis for physicians to enhance patient diagnosis.
- Incorporation of Additional Data Sources
- Expanding datasets to include genomic data, medi- cal imaging, and clinical notes.
- Utilizing Natural Language Processing (NLP) for medical report insights.
- Cloud-Based and Mobile Health Applications
- Deploying models as cloud-based APIs for health- care institutions.
- Developing mobile applications for on-the-go pre- dictive insights.
- Ethical Considerations and Explainability
- Enhancing model interpretability through explain- able AI techniques.
- Addressing biases to ensure equitable healthcare predictions.
- Public Health and Preventive Care Initiatives
- Utilizing predictive models for large-scale public health studies.
- Assisting governments in developing targeted prevention strategies.
- Longitudinal Studies and Model Validation
- Conducting long-term studies for model validation.
- Refining models with real-world patient data.
- Regulatory Compliance and Clinical Deployment
- Ensuring compliance with medical regulatory standards (e.g., HIPAA, GDPR).
- Integrating predictive tools into clinical workflows.
Conclusion
The project on heart disease prediction using R demonstrates the potential of data science and machine learning in addressing critical healthcare challenges. By leveraging various predictive models such as Logistic Regression, Decision Trees, Random Forests, and XGBoost, the study provides a comparative analysis of their performance in predicting heart disease based on patient data. The models achieved high accuracy, with Logistic Regression emerging as the best- performing algorithm in this case. This indicates the reliability and effectiveness of statistical techniques for predictive tasks in healthcare. The project successfully implemented and evaluated multiple machine learning models for heart disease prediction, including Logistic Regression, Decision Tree, Ran- dom Forest, and XGBoost, using a dataset of demographic, behavioral, and medical factors. Among the models, Logistic Regression emerged as the best-performing model with an accuracy of 91.60 percentage, slightly outperforming XGBoost (91.53) percentage, Random Forest (91.46) percentage, and Decision Tree (91.44) percentage. This indicates that Logistic Regression, despite its simplicity, effectively captures the relationships between the predictors and the target variable in this dataset. The high accuracy across all models highlights the robustness of the dataset and the relevance of the selected features in predicting heart disease. The results demonstrate the potential of predictive modeling to assist healthcare pro- fessionals in identifying at-risk individuals, enabling timely interventions and preventive care. This project emphasizes the importance of machine learning in medical applications and provides a foundation for further exploration and refinement of heart disease prediction systems. Overall, this project not only underscores the role of predictive analytics in early detection and prevention of heart disease but also establishes a foundation for integrating such tools into clinical workflows. By providing accurate, interpretable, and scalable solutions, this approach contributes to improved patient outcomes, enhanced healthcare delivery, and reduced healthcare costs. The results encourage further exploration and refinement of predictive models, fostering advancements in precision medicine and public health initiatives aimed at combating heart disease.
References
[1] R.D. Canlas, Data Mining in Healthcare: Current Ap- plications and Issues, School of Information Systems & Management, Carnegie Mellon University, Australia, 2009. [2] Christoph Helma, Eva Gottmann, Stefan Kramer, Knowledge discovery and data mining in toxicology, Stat. Methods Med. Res. 9 (4) (2000) 329–358. [3] I.-N. Lee, S.-C. Liao, M. Embrechts, Data mining tech- niques applied to medical information, Med. Inf. Internet Med. 25 (2) (2000) 81–102. [4] L. Parthiban, R. Subramanian, Intelligent heart disease prediction system using CANFIS and genetic algorithm, Int. J. Biol., Biomed. Med. Sci. 3 (3) (2008). [5] P.C. Austin, J.V. Tu, J.E. Ho, D. Levy, D.S. Lee, Using methods from the data mining and machine learning literature for disease classification and prediction: a case study examining classification of heart failure subtypes, J. Clin. Epidemiol. 66 (4) (2013) 398–407. [6] S.K. Dehkordi, H. Sajedi, Prediction of disease based on prescription using data mining methods, Health Technol. 9 (1) (2018) 37–44. [7] M. Jan, A.A. Awan, M.S. Khalid, S. Nisar, Ensemble approach for developing a smart heart disease prediction system using classification algorithms, Res. Rep. Clin. Cardiol. 9 (2018) 33–45. [8] J. Soni, U. Ansari, D. Sharma, S. Soni, Predictive data mining for medical diagnosis: an overview of heart disease prediction, Int. J. Comput. Appl. 17 (8) (2011) [9] 43–48. [10] H.M. Islam, Y. Elgendy, R. Segal, A.A. Bavry, J. Bian, Risk prediction model for inhospital mortality in women with ST-elevation myocardial infarction: a machine learning approach, J. Heart & Lung (2017) 1–7.
Copyright
Copyright © 2025 Gowri J. This is an open access article distributed under the Creative Commons Attribution License, which permits unrestricted use, distribution, and reproduction in any medium, provided the original work is properly cited.

Download Paper
Paper Id : IJRASET66966
Publish Date : 2025-02-15
ISSN : 2321-9653
Publisher Name : IJRASET
DOI Link : Click Here
 Submit Paper Online