Ijraset Journal For Research in Applied Science and Engineering Technology
- Home / Ijraset
- On This Page
- Abstract
- Introduction
- Conclusion
- References
- Copyright
Hydrochemistry and Groundwater Quality Assessment for Drinking and Irrigation Purposes in Kakarveni River Basin, Vikarabad District, Telangana, India
Authors: Ramulu M, I. Panduranga Reddy
DOI Link: https://doi.org/10.22214/ijraset.2023.55651
Certificate: View Certificate
Abstract
This study aims to assess the hydrochemistry and groundwater quality in the Kakarveni river basin in Vikarabad district, Telangana, India. Groundwater is a vital natural resource for human, agricultural, and ecological needs. Understanding hydrochemistry and groundwater quality is essential for identifying potential contaminants for selecting water treatment and agricultural management practices. The study will analyse hydro-chemical parameters such as pH, electrical conductivity, total dissolved solids, and major ions, and collect water samples from different locations to assess permeability index, Kelly’s index, magnesium hazard, sodium percentage, residual sodium carbonate, or Eaton\'s index. The research methodology involves field sampling and laboratory analysis to ensure accurate and reliable results. The study area is about 192 sq. km and includes agricultural fields, forests, and human settlements. The geology and hydrology of the area are crucial for sustainable development and effective water resource management. The study found significant variations in measured parameters between pre-monsoon and post-monsoon seasons, with slightly acidic pH levels and higher electrical conductivity and total dissolved solids during the post-monsoon season. The study analyses water samples during the pre-monsoon and post-monsoon periods and compares them with the WHO\'s drinking water quality standards. The study computes the findings and arrives at the suitability of groundwater for irrigation.
Introduction
I. INTRODUCTION
Groundwater refers to the water that is found beneath the Earth's surface in the pores and crevices of soil, rock, and other geological formations. It is one of the Earth's most important natural resources, serving as a vital source of fresh water for various human, agricultural, and ecological needs. Its quality is crucial for community health and agricultural productivity. This study aims to assess the hydrochemistry and groundwater quality in the Kakarveni river basin of Vikarabad district, Telangana, India. The availability of safe drinking water and sustainable irrigation practices are vital for local communities and the region's agricultural productivity. Understanding hydrochemistry and groundwater quality is essential for identifying potential contaminants and formulating appropriate strategies for water treatment and agricultural management. This comprehensive study will provide valuable insights to make informed decisions regarding water resource management in the region. The study will analyse hydro-chemical parameters such as pH, electrical conductivity, total dissolved solids, and major ions and collect water samples from different locations to assess the permeability index, Kelly’s index, magnesium hazard, sodium percentage, residual sodium carbonate or Eaton's index. The research methodology will involve field sampling and laboratory analysis to ensure accurate and reliable results.
A. Study Area
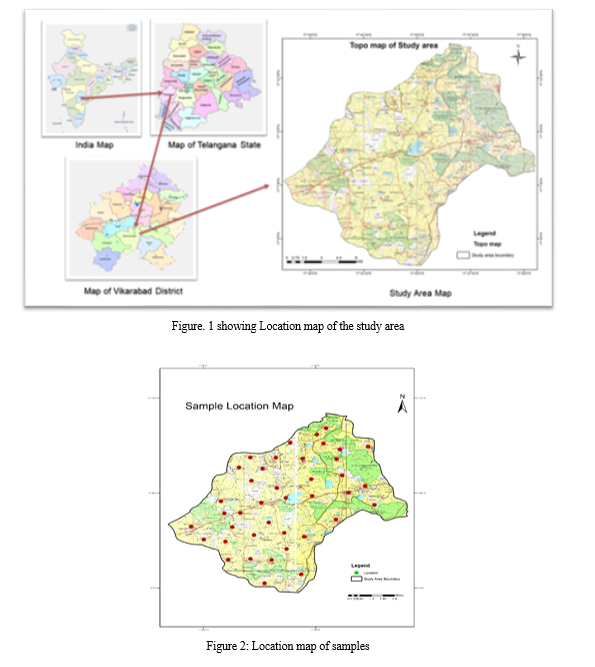
The present study area is about 192 sq. km, and belongs to the Karkarveni river basin of R. Kanga, a tributary of R. Bhima, which is a tributary of R. Tungabhadra. lies between latitude 170.12'30'' N to 170.20'30'N' and longitude 770.44'.00''E to 770.50'.00''E. A variety of rock types belonging to the Peninsular Gneissic Complex (Archaean) Schistose rocks of Dharwar Supergroup (Archaean-Proterozoic age), granitoids and younger acidic and basaltic intrusive (Lower Proterozoic), Deccan Traps (Upper Cretaceous lower Eocene) and laterite (Pleistocene) are exposed in the district. The Peninsular Gneissic Complex occurring as enclaves and rest within the younger granitoids is seen in the southern part of the district mainly Bomraspet and Parigi.
The Karkarveni River basin is an important hydrological system in the region, providing water for irrigation and domestic use. The study area also includes agricultural fields, forests, and human settlements, making it a diverse and dynamic landscape. Understanding the geology and hydrology of this area is crucial for sustainable development and effective water resource management. The granites are predominantly of pink and grey varieties which are coarse pegmatite and epidote. In the study area, the dolerite dykes are very common. Groundwater occurs along the weathered and fractured zones of basaltic nature, granites, and gneisses. The depth of the weathered zone ranges from 18 feet to 60 feet. The topography extensively influences the groundwater regime.

II. METHODOLOGY
A total of forty samples were collected from borewells, dug wells, and surface water tanks in the Kakarveni River basin during pre-monsoon and post-monsoon seasons. The samples were analysed for parameters like pH, electrical conductivity, total dissolved solids, total hardness, calcium, magnesium, sodium, potassium, chlorides, carbonates, bi-carbonates, sulphates, nitrates, and fluoride using standard methods.
The data was graphically represented and interpreted using Aquachem and Microsoft Excel software. The SAR, Na%, PI, KI, RSC, and MH were computed.
The analysis of water samples from various sources in the Kakarveni River basin revealed significant variations in the measured parameters between the pre and post-monsoon seasons.
The pH levels were found to be slightly acidic in both seasons, while electrical conductivity and total dissolved solids were higher during the post-monsoon season.
Calcium and magnesium levels were observed to be higher during the pre-monsoon season, whereas sodium and potassium levels were higher during the post-monsoon season. The presence of chlorides, carbonates, bi-carbonates, sulphates, nitrates, and fluoride was also detected in varying concentrations. These results were further analyzed using Aqua-chem and Microsoft Excel software to compute the SAR, Na%, PI, KI, RSC, and MH.
III. RESULTS AND DISCUSSION
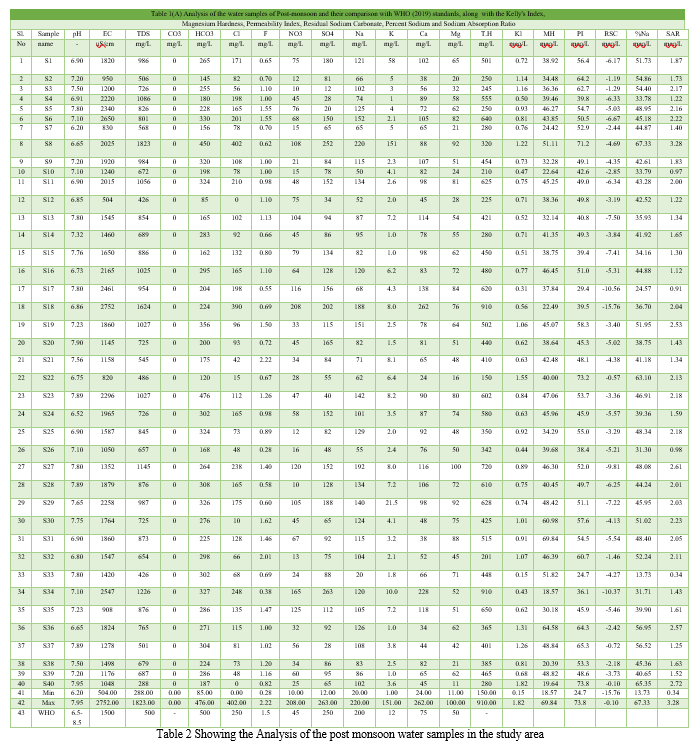
The analytical data of various water samples for different parameters during the pre-monsoon and post-monsoon with their average is presented in the table and compared with the drinking water quality standards of WHO (2011).
A. Suitability for Drinking Water
- pH and EC: The pH of the groundwater samples varies from 7.38 to 8.28 in the pre-monsoon and 6.20 to 7.95 in the post-monsoon. The pH values of all samples in the study area are within the permissible range. In the present study area, Ec ranges from 293 to 2474 uS/cm in pre-monsoon and 504 to 2752 uS/cm in post-monsoon. 43% of samples in the pre-monsoon and 87% in the post-monsoon were found to deviate from the standards. Based on the comparison with WHO's drinking water quality standards, it was found that the pH levels of the water samples were within the acceptable range for drinking water. However, the electrical conductivity (Ec) levels exceeded the recommended limits in some samples, indicating a higher mineral content. This could potentially affect the taste and overall suitability of the water for drinking purposes. Further analysis and treatment may be necessary to ensure the water meets the desired drinking water quality standards.
- Total dissolved solids: of pre-monsoon varies from 183 mg//L to 1583 mg/L and in post-monsoon from 288 mg/L to 823 mg/L. The obtained results of TDS denoted 22.5% of the samples in pre-monsoon and 57.5% were deviating from the BIS standards.
- Calcium: According to BIS standards, the Ca concentration level for the drinking water is 75 mg/L. The Concentration of calcium ions in the study area vary from 24 to 240 mg/L and 24 to 262 mg/L in the pre-monsoon and post-monsoon respectively. The obtained results indicate that 30% of the samples in pre-monsoon and 60% in post-monsoon were deviating from the standards.
- Magnesium: The Mg concentration varies from 9.72 mg/L to 77.79 mg/L in pre-monsoon and 11 mg/L to 100 mg/L in post-monsoon. No sample deviates from the standards.
- Sodium: The Na ion concentration in the area of interest varies from 25 mg/L to 285 mg/L in pre-monsoon and 20 mg/L to 220 mg/L in post-monsoon. Only one sample i.e. GP Borehole of Tunkkimetla village, Bomraspate mandal is deviating from standards in pre and post-monsoon.
- Bi-carbonates: The concentration of bi-carbonates ranges from 70 mg/L to 500 mg/L pre-monsoon and 85 mg/L to 476 mg/L. Only one sample location, Manthapuram village of Bomraspet mandal is deviating from standard in pre-monsoon and none of the samples are deviating in post-monsoon.
- Chloride: The concentration of Cl in the samples ranges from 20 mg/L to 410 mg/L in pre-monsoon and 0 mg/L to 402 mg/L in post-monsoon. 5% of the samples were deviating from standards in pre and post-monsoon. Tunkkimetla and Regadi-mailram samples were found to deviate.


8. Fluoride : F ions concentration ranges from 0 to 2.5 mg/L in the pre-monsoon 0.28 mg/L to 2.22 mg/L in the post-monsoon. 12% samples in the pre-monsoon for deviating from the standards. One sample i. e., Madaipalli Thanda bore hole is deviating from the standards in the post-monsoon.
9. Nitrates: The concentration of nitrates ranges from 10 mg/L to 208 mg/L in the post-monsoon. 0.12 mg/L to 220 mg/L in the pre-monsoon. 30% samples in the pre-monsoon for deviating from the standards. 47.5% of the samples were deviating from the standards in the post-monsoon.
10. Sulphates: The concentration of sulphates ranges between 7 mg/L to 311 mg/L in the pre-monsoon and 12 mg/L to 260 mg/L in the post-monsoon. One sample of the Handpump borehole at mattakodur village Parigi mandal in pre monsoon is deviating from the standards, and 5% of the samples of post monsoon were deviating from the standards.
11. Potassium: The K concentration ranges from 0.26 to 139.70 mg/L in the pre monsoon 1.00 mg/L to 151 mg/L in the post-monsoon. The WHO limit is 12mg/L in drinking water. 10% of the samples were deviating from the standards in the pre-monsoon and 7.5% in the post-monsoon.
B. Hydrogeochemical Classification and Hydrogeochemical Facies
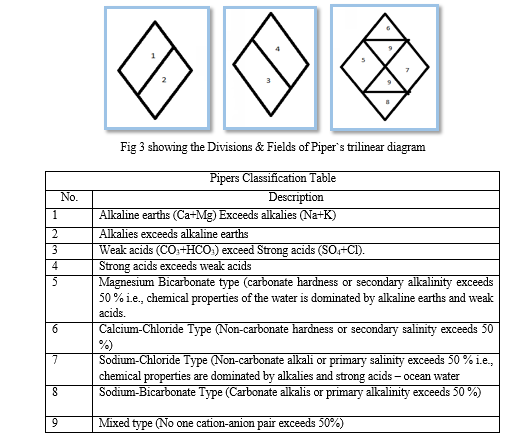
The Piper (1944) diagrams are very useful to determine the relationship of different dissolved constituents and to classify the water based on its chemical characteristics. According to Wasim et.al (2014) and Kumar Leal (2015), the geochemical evolution of groundwater can be understood by the Piper diagram: The diagram consists of three separate fields i.e. two lower triangular fields and a central diamond shape field. In the lower left side triangle the major cations Ca, Mg, Na, and K in epm % values are plotted, whereas, the major anions like HCO3, Cl and SO4 in epm % are plotted on the lower right side triangle. Then the positions of the plots in two triangular fields are projected onto a quadrilateral or central diamond-shaped field. Based on the positions of the plots in sub-areas of the diamond-shaped field different types of groundwater can be identified.


- Suitability for Irrigation: As per Ayers and Westcot (1985), electrical conductivity (EC), permeability index (PI), Kelley index (KI), Magnesium hazard (MH), percentage sodium (%Na) and sodium adsorption ratio (SAR) are useful in assessing the suitability of water for irrigation uses. Kelley's ratio, magnesium ratio, permeability index and residual sodium carbonate, per cent sodium, and sodium adsorption ratio are calculated for all the samples during both seasons and we presented them in table 1 and table 2.
Kelley's Index (KI): It is the level of sodium measured against calcium and magnesium. The KI can be determined by the flowing formula
KI = Na+/(Ca2++Mg2+)
and was used for finding out the suitability of water for agriculture Kelley (1946) and Paliwal (1967, 1972). As per Kelly's index, groundwater and surface water from the dry area are categorized into suitable if KR is <1, marginal if KR is 1-2 and unsuitable if KR is >2.
In the study, KI values vary from 0.34 to 2.08 with an average of 0.817meq/L in pre-monsoon and 0.15 to 1.82 with an average of 0.81meq/L in post-monsoon. In the present area, 80% of the samples from pre-monsoon and 75% from post-monsoon are falling in suitable, 17.5% from pre-monsoon and 25% from post-monsoon seasons are marginal and 0.25% from pre-monsoon are unsuitable categories for irrigation purposes.
2. Magnesium Hazard (MH)or Magnesium Absorption Ratio (MAR): Generally, alkaline earths are in an equilibrium state in groundwater. If soils have more alkaline earths, they reduce crop yield. This hazard is expressed in terms of Magnesium Hazard (MH), which is computed by the equation
MH= Mg/(Ca+Mg) x 100
In natural waters, Mg in equilibrium state will adversely affect crop yields (Nagaraju et al., 2006). The magnesium hazard (MAR) of irrigation water is proposed by Szabolcs and Darab (1964) and redefined by Raghunath (1987). The MAR values exceeding 50 is considered harmful and unsuitable for irrigation use. The Magnesium hazard values in the study area vary from 15.42% to 60.31% with an average of 40.79% in the pre-monsoon and 18.57% to 69.84% with an average of 40.52% in post-monsoon. In the present study, 30 % of samples of the pre-monsoon and 12.5% of the post-monsoon samples were found with MH values >50% which makes them unsuitable for irrigation.
3. Permeability Index: Permeability Index (PI) values are also useful to find out the suitability of groundwater for irrigation purposes since long-term use of irrigation water can affect soil permeability. It is influenced by the Na, Ca and HCO3- contents of the soil. The PI can be expressed by equation.
PI = 100× (Na + + √ HCO3-)/ (Ca 2+ + Mg 2+ + Na+)
Doneen (1964) has assessed the suitability of water for irrigation, based on the permeability index. According to this classification, Class I and II posses maximum permeability >75% are classified good for irrigation while third category (Class III) having 25% maximum permeability are unsuitable for irrigation purpose (Nagaraju et al., 2006). The Permeability Index values vary from 38.05% to 79.44% with an average of 53.76% in pre-monsoon and 24.67% to 73.81% with an average of 51.19% in post-monsoon periods. According to Pl values, only one sample fit in class I, 97.5% of samples fit in class II and Nil samples in class III in pre-monsoon season and Nil in class I and 97.5% fit into class II and 2.5% of samples fit into the class III of post-monsoon indicating 97% of the samples during pre-monsoon and 97% in post-monsoon seasons are marginally suitable for irrigation.
4. Residual Sodium Carbonate or Eaton's Index (RSC): Eaton (1950) has calculated residual sodium carbonate (RSC) using the following formula
RSC = (CO3+HCOs) - (Ca+ Mg).
If the residual sodium carbonate is less than 1.25 meq/l in water is probably safe, 1.25 to 2.5 meq/l is marginal and unsuitable for irrigation with more than 2.5 meq/l (USDA, 1954).
Based on this 97.5% of the groundwater samples fall in safe, 2.5% in marginal and 0% or nil in unsuitable in a pre-monsoon season whereas 100%, samples of post-monsoon fall in safe, none of the samples fall under the marginal and unsuitable category for irrigation in the present area.
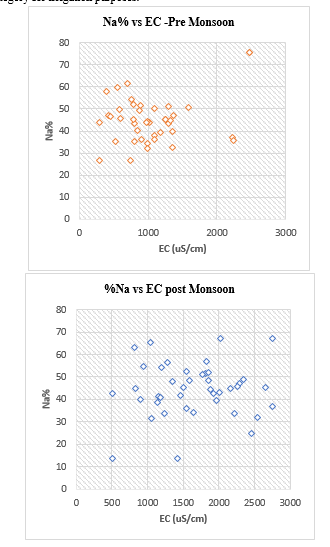
5. Percent Sodium (Na %): The concentration of sodium is important in classifying the groundwater for irrigation because it reacts with soil to reduce its permeability. Sodium-saturated soils namely alkaline soils formed on account as predominant anion or saline soils formed due to excess presence of sodium with either chloride or sulphate as predominant anion. Wilcox (1955) used percent sodium and specific conductance in evaluating irrigation waters using the Wilcox diagram as shown in the figure
The percent sodium is obtained from the below equation.
%Na=Na+K/(Ca + Mg + Na +K) 100
where all the values are expressed in meq/L,
The sodium percentage values vary from 26.25 to 75.62 meq/L with an average of 44.81 meq/L in pre-monsoon and 13.73 to 67.33 meq/L with an average of 44.56 meq/L in the post-monsoon season.
The classification of water is based on %Na as excellent (< 20%), good (20–40%), permissible (40–60%), doubtful (60–80%) and unsuitable (> 80%) (Khodapanah et al. 2009).
Based on this classification, around 30% of the samples were good 65% of the samples fell in the permissible category and 5% of the samples were a doubtful category in pre-monsoon season. In post-monsoon season, 2.5%% of the groundwater samples are excellent category, 27.5% of the samples fall in the category good and 62.5% of samples fall under the permissible category, 7.5%% of the samples are doubtful category for irrigation purposes.

6. Sodium Adsorption Ratio (SAR): SAR is one of the important parameters used to determine the suitability of groundwater for irrigation SAR value is calculated by the following formula, where all ion concentrations are in meq/L (Richards 1954, Wilcox 1955).
SAR= Na/ √ [(Ca+Mg)/2
The sodium or alkali hazard is expressed in terms of SAR. In the present area of investigation, sodium adsorption in the pre monsoon season ranges from 0.66 to 4.86 me/L with an average of 1.60 me/L. Based on the SAR, all the pre-monsoon and post-monsoon samples falling in the excellent class are good to permissible categories with little or low sodium hazard.

The US Salinity Laboratory (USSL 1954) proposed a diagram (Fig.6 and 7) for studying the suitability of groundwater for irrigation purposes based on electrical conductivity and sodium adsorption ratio. Water used for irrigation can be classified into four types- C1, C2, C3 and C4 based on salinity hazard and S1, S2, S3 and S4 based on sodium hazard. Figure 8 shows the plot of groundwater samples grouped on the above basis. In this diagram, irrigation water is classified as low (EC 250 µS/cm), medium (EC-250-750 µS/cm), high (EC-750- 2250 µS/cm) and very high (EC-2250-5000 µS/cm) salinity classes.
It is observed that the majority (70%) fall under the high salinity-low sodium waters C3S1class, 0% fall under C4S1 class indicating very high salinity and low sodium waters, 27.5% indicate medium salinity and low sodium water C2S1 class and zero% of the sample fall under C3S2 class indicating high salinity-medium sodium waters in pre-monsoon season. During the post-monsoon season, the groundwater samples fall in the 80% C3S1 category indicating high salinity-low sodium waters, 15% in C4S1 with very high salinity and low sodium, 2.5% in C2S1 with medium salinity and low sodium water, zero% in C4S2 very high salinity and medium sodium and 2.5% C3S2 high salinity-medium sodium waters (Table: 4). Electrical conductivity affects the total salt concentration and soil salinity and thereby affecting the yield of the crop and its tolerance accordingly. Since most of the waters in the study area fall in the low sodium group, these waters require adequate drainage and special management for salinity control, and plants having good salt tolerance need to be selected for cultivation
|
Wilcox plots for classification |
|||||
|
Pre-Monsoon |
Post-Monsoon |
||||
|
C3S1 |
28/40 |
70% |
C3S1 |
32/40 |
80% |
|
C2S1 |
11/40 |
27.5% |
C2S1 |
1/40 |
2.5% |
|
C3S2 |
- |
- |
C3S2 |
1/40 |
2.5% |
|
C4S2 |
1/40 |
2.5% |
C4S1 |
6/40 |
15% |
Table:4 showing Wilcox plots for classification of water samples during pre-monsoon and post monsoon.
IV. ACKNOWLEDGEMENTS
I am Very grateful to the Department of geology, University College of Science, Osmania University for all the facilities it provided me for completion of this work, I am grateful to my colleagues for helping me out at various stages of my research.
Conclusion
Hydrogeochemical studies are carried out in the Kakarveni river Basin to find out the suitability of water for drinking and agriculture. Water samples are collected from open wells, bore wells and also in the stream The pH levels of the water samples were within the acceptable range, but some samples exceeded the recommended limits, indicating higher mineral content. Further analysis and treatment may be necessary to ensure the water meets the desired drinking water quality standards. Total dissolved solids (TDS) showed 22.5% of samples deviating from the BIS standards, while calcium concentrations were higher than the recommended 75 mg/L. Magnisum concentrations were also higher than the standards, with no deviations. The study also found bi-carbonates, chloride, fluoride, nitrates, sulphates, and potassium concentrations to be deviating from the standards. Only one sample, Manthapuram village, deviated from the standards in the pre-monsoon period. Fluoride concentrations ranged from 0 to 2.5 mg/L in the pre-monsoon period to 0.28 mg/L to 2.22 mg/L in the post-monsoon period. Sulphates concentrations ranged from 7 mg/L to 260 mg/L in the pre-monsoon period to 260 mg/L in the post-monsoon period. Potassium concentrations ranged from 0.26 to 139.70 mg/L in the pre-monsoon period to 1.00 mg/L to 151 mg/L in the post-monsoon period. The Piper diagrams are useful for determining the relationship of different dissolved constituents and classifying water based on its chemical characteristics. During the pre-monsoon season, alkaline earth exceeds alkalies in the groundwater by 95%, while during the post-monsoon season, alkaline earth exceeds alkalies by 92.5%. Suitability for irrigation is assessed using various factors such as electrical conductivity, permeability index, Kelley index, Magnesium hazard, percentage sodium, and sodium adsorption ratio. Kelley\'s index measures the level of sodium measured against calcium and magnesium, while Magnesium hazard measures the amount of alkaline earths in groundwater. In the present study, 80% of pre-monsoon and 75% of post-monsoon samples fall in suitable categories, while 17.5% and 25% are marginal and 0.25% are unsuitable categories for irrigation purposes. Residual Sodium Carbonate (RSC) is calculated using Eaton\'s Index, which indicates that 97.5% of groundwater samples fall in safe category, 2.5% in marginal, and 0% or NIL in unsuitable category. Sodium Adsorption Ratio (SAR) is another important parameter used to determine the suitability of groundwater for irrigation. In the present area, 30% of samples were good, 65% in permissible, and 5% in doubtful categories. Studying the suitability of groundwater for irrigation purposes based on electrical conductivity and sodium adsorption ratio. Most of the samples fall in the high salinity-low sodium waters C3S1 class, indicating adequate drainage and special management for salinity control. Plants with good salt tolerance need to be selected for cultivation in these low sodium waters.
References
[1] Abdulhussein, Firas. (2018). Hydrochemical Assessment of Groundwater of Dibdibba Aquifer in Al-Zubair Area, Basra, South of Iraq and its Suitability for Irrigation Purposes. Iraqi Journal of Science. 59. 135-143. [2] APHA (1995) Standard Methods for the Examination of Water and Wastewater. 19th Edition, American Public Health Association Inc., New York. [3] BIS, 1983. Standards for water for drinking and other purposes. Bureau of Indian standards publication. New Delhi. [4] Doneen, L.D., 1962. The Influence of Crop and Soil on Percolating Water. Proc. 1961. Biennial Conference on Ground Water Recharge, 156-163. [5] Kelley, W.P., 1940: Permissible composition and concentration of irrigation water. Proc. Amer. Soc. Civ. Engin. 66: 607-613. [6] Kumar, SK., Logeshkumaran, A., Magesh, N.S. et al. Hydro-geochemistry and application of water quality index (WQI) for groundwater quality assessment, Anna Nagar, part of Chennai City, Tamil Nadu, India. Appl Water Sci 5, 335–343 (2015). https://doi.org/10.1007/s13201-014-0196-4 [7] Nagaraju, A., Suresh, S., Killham, K. and Hudson-Edwards, K., 2006. Hydrogeochemistry of Waters of Mangampeta Barite Mining Area, Cuddapah Basin, Andhra Pradesh, India. Turkish Journal of Engineering and Environment Sciences, 30: 203-219. [8] Naseem, S., Hamz, S. and Bashir, E. 2010. Groundwater Geochemistry of Winder Agricultural Farms, Balochistan, Pakistan and Assessment for Irrigation Water Quality, European Water, 31: 21-32 [9] Piper, A.M., 1953. A Graphic Procedure in the Geochemical Interpretation of Water Analysis. Washington D.C., USGS. [10] Ramesh, K. & Lakshmanan, Elango. (2006). Groundwater quality assessment in Tondiar Basin. 26. 497-504. [11] Ramkumar, T., Venkatramanan, S., Mary, I.A., Tamilselvi M. and Ramesh, G., 2010. Hydrogeochemical Quality of Groundwater in Vedaraniyam Town, TamilNadu, India. Research Journal of Environmental and Earth Sciences 2 (1): 44-48. [12] Richards LA. Sous la direction U.S.S.L.S. (United State Salinity Laboratory Staff) ; Diagnosis and improvement of saline and alkali soils. US Department of Agriculture, Handbook 60, US. Gov. Print. Office, Washington DC (USA); 1954, p. 160. [13] USSL, 1954. Diagnosis and improvement of saline and alkali soils. US DA Hand Book, 60: 147. [14] World Health Organization. (?2011)?. Guidelines for drinking-water quality, 4th ed. World Health Organization. https://apps.who.int/iris/handle/10665/44584 [15] Wilcox, L.V. (1955) Classification and Use of Irrigation Water. US Department of Agriculture, Circular 969, Washington DC.
Copyright
Copyright © 2023 Ramulu M, I. Panduranga Reddy. This is an open access article distributed under the Creative Commons Attribution License, which permits unrestricted use, distribution, and reproduction in any medium, provided the original work is properly cited.

Download Paper
Paper Id : IJRASET55651
Publish Date : 2023-09-07
ISSN : 2321-9653
Publisher Name : IJRASET
DOI Link : Click Here
 Submit Paper Online

