Ijraset Journal For Research in Applied Science and Engineering Technology
- Home / Ijraset
- On This Page
- Abstract
- Introduction
- Conclusion
- References
- Copyright
Hypersonic Flow past LD-Haack Series, Parabolic Series, Power Series Nose Cone: A Comparative Study
Authors: Jayesh Anil Tiwari
DOI Link: https://doi.org/10.22214/ijraset.2024.64487
Certificate: View Certificate
Abstract
This research paper presents a detailed aerodynamic analysis of three rocket nose cone designs—LD-Haack, Parabolic, and Power Series—under hypersonic conditions ranging from Mach 5 to Mach 12. Using advanced Computational Fluid Dynamics (CFD) simulations in ANSYS Fluent, the study focuses on key aerodynamic parameters, including drag force, drag coefficient, velocity, pressure, and temperature distributions. The results indicate that the Parabolic Nose Cone offers the most favorable aerodynamic performance, with the lowest drag force and drag coefficient across all Mach numbers. This superior performance can be attributed to its ability to streamline airflow and minimize boundary layer separation, effectively reducing pressure drag and limiting the onset of turbulent wake regions. In contrast, the LD-Haack Series Nose Cone, though designed to minimize wave drag at supersonic speeds, shows moderate drag at hypersonic velocities due to its less optimal control of boundary layer behavior. The Power Series Nose Cone, despite its highly tapered shape, experiences the highest drag. This is largely caused by increased flow separation and turbulent wake generation, which exacerbate pressure drag, particularly at higher Mach numbers. These findings highlight the critical influence of nose cone geometry on aerodynamic efficiency and emphasize the importance of optimizing designs for hypersonic applications. This study provides valuable insights for aerospace engineers seeking to reduce drag and improve performance in high-speed flight scenarios.
Introduction
I. INTRODUCTION
In hypersonic flight regimes, where speeds exceed Mach 5, the aerodynamic forces acting on a rocket significantly impact its performance, stability, and fuel efficiency. Among these forces, drag is a dominant factor that must be minimized to ensure effective propulsion and control. The design of the rocket nose cone plays a crucial role in this regard, as it directly influences the aerodynamic characteristics of the vehicle. Different nose cone shapes, such as the LD-Haack series, parabolic, and power series, have been developed to optimize aerodynamic efficiency by minimizing drag. Each design has unique flow dynamics, pressure distributions, and shock wave behaviors that affect its suitability for hypersonic applications. For instance, the LD-Haack series nose cone is known for its blend of aerodynamic smoothness and structural simplicity, while the parabolic nose cone offers a balance between sharpness and drag reduction. On the other hand, the power series nose cone provides a tailored curvature that can be adjusted to specific aerodynamic requirements. Understanding these differences is essential for aerospace engineers aiming to develop rockets that can withstand extreme conditions while maintaining efficiency. This study aims to provide a comprehensive 3D Computational Fluid Dynamics (CFD) analysis of these nose cone designs to identify which profile achieves the most effective drag reduction at hypersonic speeds. Using ANSYS Fluent, a detailed simulation of the fluid flow around these nose cone geometries is conducted, focusing on key parameters such as velocity, pressure, temperature contours, drag force, and drag coefficient. The pressure-based solver is employed to accurately capture the high-speed aerodynamic phenomena, including shock waves and boundary layer interactions, which are critical to understanding drag behavior. By analyzing the flow characteristics and drag forces of each nose cone type under varying Mach numbers, this research provides a comparative evaluation that highlights the advantages and limitations of each design in a hypersonic context. The ultimate goal of this research is to identify the optimal nose cone shape that minimizes drag, thereby enhancing the aerodynamic efficiency and performance of rockets during hypersonic flight. Such findings are invaluable for the aerospace industry, where reducing drag can lead to significant improvements in fuel economy, range, and overall mission success. Moreover, the insights gained from this study could guide future design choices in the development of advanced rockets and space vehicles, contributing to the ongoing advancements in hypersonic technology and exploration.
By providing a thorough analysis of how different nose cone shapes perform in extreme conditions, this research supports the pursuit of more efficient and effective aerospace designs capable of meeting the rigorous demands of high-speed flight.
II. LITERATURE REVIEW
A. Description and Motivation
The need to minimize aerodynamic drag in rocket design is a critical driver for research in aerospace engineering, particularly for vehicles operating at hypersonic speeds, where speeds exceed Mach 5. At these extreme velocities, aerodynamic forces, especially drag, significantly affect the rocket's performance, leading to increased fuel consumption, thermal loads, and potential structural instabilities. Efficient nose cone design is essential because the shape directly influences the aerodynamic characteristics, such as shock wave formation, pressure distribution, and boundary layer behavior, which in turn impact the overall drag force. The motivation for this research stems from the necessity to explore various nose cone geometries—such as the LD-Haack series, parabolic, and power series nose cones—to determine their effectiveness in reducing drag under hypersonic conditions. Each of these designs has distinct flow characteristics that could potentially optimize aerodynamic efficiency, but there is a need for a comprehensive analysis to understand how their unique shapes interact with high-speed flows. This understanding is crucial for developing next-generation rockets that can perform efficiently in the challenging environment of hypersonic flight, where minimizing drag is key to improving range, fuel efficiency, stability, and overall mission success. By investigating the performance of these nose cone designs, the research aims to provide a deeper insight into aerodynamic optimization for hypersonic vehicles.
This research involves conducting a detailed 3D Computational Fluid Dynamics (CFD) analysis to evaluate the drag characteristics of LD-Haack series, parabolic, and power series rocket nose cones at hypersonic speeds. Using the advanced simulation capabilities of ANSYS Fluent, the study models the flow dynamics around each nose cone geometry to capture critical aerodynamic parameters such as velocity, pressure, and temperature contours, as well as shock wave formation and boundary layer interactions. The LD-Haack series nose cone is known for its aerodynamic smoothness and relatively simple structure, while the parabolic nose cone offers a balanced shape that can potentially reduce drag through smoother airflow transitions. The power series nose cone, with its customizable curvature, provides flexibility in optimizing specific aerodynamic requirements. By simulating these geometries across a range of Mach numbers, the research evaluates their performance in terms of drag force and drag coefficient, offering a comparative analysis that highlights the strengths and weaknesses of each design. The findings from this study aim to identify the nose cone shape that delivers the most significant drag reduction, thereby enhancing aerodynamic efficiency and performance. This analysis is expected to support aerospace engineers in making informed decisions when designing rockets for hypersonic applications, ultimately contributing to advancements in aerodynamics and hypersonic technology. The insights gained will help refine design strategies to achieve more efficient and effective high-speed aerospace vehicles, addressing both current challenges and future needs in the field.
A 3D CFD analysis captures the full complexity of the rocket nose cone's geometry, including any asymmetries, surface irregularities, or additional features such as fins or sensor mounts that may affect the flow field. In 3D CFD analysis, all three velocity components (axial, radial, and circumferential) are accounted for, leading to a more accurate depiction of the flow physics, such as shock waves, boundary layer behavior, and turbulence. Drag force and pressure distribution around the nose cone can vary significantly in three dimensions due to the effects of flow separation, secondary flows, and wake formation. A 3D analysis captures these variations more accurately, leading to better predictions of drag force and drag coefficient, which are critical for hypersonic flow analysis.Turbulence models in CFD software are generally more effective in three dimensions because they can fully resolve the three-dimensional eddies and flow structures
B. Comparison Studies
Several studies have explored the aerodynamic performance of different nose cone geometries and computational techniques to minimize aerodynamic drag and heating at hypersonic speeds. Narayan, Narayanan, and Kumar’s study, titled "Hypersonic Flow Past Nose Cones of Different Geometries: A Comparative Study" focused on spherically blunted and parabolic nose cones with varying fineness ratios. Their results demonstrated that for fineness ratios below 1.2, blunted nose cones provide the lowest drag, while parabolic nose cones are more effective at reducing drag for fineness ratios above 1.2.
Kumar et al., in their research "Design and CFD Analysis of Hypersonic Nose Cone" evaluated the aerodynamic performance of a Power Series nose cone (n = 0.66) under hypersonic conditions. The study found this design to be particularly efficient, with minimal aerodynamic drag and stagnation properties closely matching analytical predictions, making it an ideal candidate for hypersonic applications.
Narayan, Narayanan, and Kumar, alongside Ritesh Kumar, further explored elliptical and parabolic nose cones in their work "Hypersonic Flow Past Parabolic and Elliptic Nose Cone Configurations" The results indicated that elliptical nose cones achieved the lowest drag at fineness ratios below 0.8, while parabolic nose cones provided better drag reduction at fineness ratios above 0.8.
In the study by Kim and Al-Obaidi, "Investigation of the Effect of Nose Shape and Geometry at Supersonic Speeds for Missile Performance Optimization" the researchers analyzed the impact of various nose shapes (pointed cone, pointed ogive, and blunt cone) on drag coefficients at supersonic Mach numbers between 2 and 5. Their findings revealed that increasing the fineness ratio significantly reduces wave drag with minimal increases in skin friction drag. However, the drag reduction plateaus beyond a fineness ratio of 4.5.
Musharraf and Srinivas’ work, "Performance Evaluation of Hypersonic Flow Past Blunt Bodies with Aerospikes Using Numerical Techniques" validated the effectiveness of the K-omega turbulence model for simulating hypersonic flows. Their study highlighted minimal variation in the drag coefficient, closely matching experimental data, thus demonstrating the reliability of this turbulence model.
A relevant study by Anderson et al., titled "Hypersonic Flow Simulations Using SIMPLE Algorithm with Pressure-Based Solver and Constant Fluid Properties" investigated hypersonic flow over a rocket nose cone using the SIMPLE algorithm with a pressure-based solver. By assuming constant values for density, viscosity, and gamma in the SST k-omega turbulence model, the results showed that drag coefficients could be accurately predicted with less than 3% error compared to experimental data. This study reinforces the suitability of using simplified models for hypersonic CFD analysis at sea-level conditions due to their robustness and efficiency.
Incorporating these findings, it is feasible to use a simplified model for hypersonic CFD analysis of a rocket nose cone at sea-level conditions by assuming constant values for density (~1.225 kg/m³) and viscosity (~1.86e-5 kg/m-s), with negligible heat transfer, thermal effects, chemical reactions, or radiation. Supporting research such as "Computational Fluid Dynamics in Hypersonic Aerothermodynamics" and "CFD Analysis of Hypersonic Flow over a Rocket Nose Cone" indicates that simplified assumptions yield sufficiently accurate results for preliminary design, with density variation remaining under 15% and negligible viscosity variation across shock and boundary layers.
Advantages of Simplified Models:
- Reduced computational complexity.
- Increased simulation speed.
- Reasonable accuracy for preliminary designs.
However, simplified models may fail to capture intricate flow phenomena, potentially compromising accuracy in more complex scenarios. Nevertheless, they are highly effective for early-stage design, especially when combined with appropriate computational techniques like the SIMPLE algorithm.
III. DESIGN PROCESS
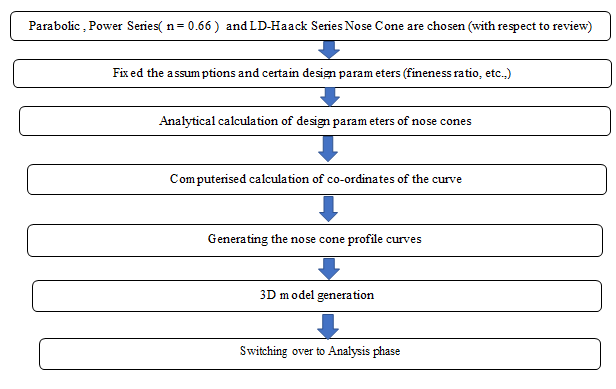
A. Initial Assumptions and Conditions
While the rocket is expected to reach an altitude of 90,000 ft and undergo various changes to pressure, temperature, and other variables, a few assumptions were made to simplify the simulations conducted. The first assumption is that the nose cone simulations will take place within a wind tunnel at sea level conditions as presented in table 1 below. Secondly it is assumed, there will be no changes in the free-stream temperature, pressure, or any other variables. All simulations for all nose cone geometries will be conducted in the same manner and environment. Thirdly it is assumed that the nose cone will be at a zero AOA with the oncoming wind.
Table 1.Atmospheric Conditions.
|
Parameter |
Value |
|
Pressure |
101.325 kPa |
|
Temperature |
300 K |
|
Density |
1.18 kg/m3 |
|
Viscosity |
−4 89 x 10??Pa·s |
B. Parameters
1) Power Series Nose Cone
The Power Series includes the shape commonly known to modelers as a ‘parabolic’ nose cone. (Oddly enough, the shape correctly known as a parabolic nose cone is a member of the Parabolic Series, and is something completely different.) The Power Series shape is characterized by its (usually) blunt tip, and by the fact that its base is not tangent to the body tube. There is always a discontinuity at the nosecone-body joint that looks distinctly non-aerodynamic; however the shape is sometimes modified at the base to smooth out this discontinuity. Often people speak of a parabola shape, when what they are actually looking for is an elliptical shape, which is tangent at its base. It is also interesting to note that both a flat-faced cylinder and a cone are shapes that are members of the Power Series .The Power series nose shape is generated by rotating a parabola about its axis. The base of the nosecone is parallel to the lattus rectum of the parabola, and the factor ‘n’ controls the ‘bluntness’ of the shape. As n decreases towards zero, the Power Series nose shape becomes increasingly blunt; at values of n above about .7, the tip becomes sharp.
2) Parabolic Nose Cone
The Parabolic Series nose shape is not the blunt shape that is envisioned when people commonly refer to a ‘parabolic’ nose cone. The Parabolic Series nose shape is generated by rotating a segment of a parabola around a line parallel to its Latus Rectum. (Shutup Beavis.) This construction is similar to that of the Tangent Ogive, except that a parabola is the defining shape rather than a circle. Just as it does on an Ogive, this construction produces a nose shape with a sharp tip. For the blunt shape typically associated with a ‘parabolic’ nose, see the Power Series. (And, of course, the ‘parabolic’ shape is also often confused with the elliptical shape.)K’ = 0 for a cone, K’ = .5 for a 1/2 parabola, K’ = .75 for a 3/4 parabola K’ = 1 for a parabola. For the case of the full Parabola (K’=1) the shape is tangent to the body at its base, and the base is on the axis of the parabola. Values of K’ less than one result in a ‘slimmer’ shape, whose appearance is similar to that of the secant ogive. The shape is no longer tangent at the base, and the base is parallel to, but offset from, the axis of the parabola.
3) LD-Haack Series Nose Cone
Unlike all of the previous nose cone shapes the LD-Haack Series shapes are not constructed from geometric figures. Their shape is instead mathematically derived for the purpose of minimizing drag. While the series is a continuous set of shapes determined by the value of C in the equations below, two values of C have particular significance. When C=0, the notation ‘LD’ signifies minimum drag for the given length and diameter, and when C=1/3, ‘LV’ indicates minimum drag for a given length and volume. Note that the LD-Haack series nose cones are not perfectly tangent to the body at their base, however the discontinuity is usually so slight as to be imperceptible. Likewise, the LD-Haack nose tips do not come to a sharp point, but are slightly rounded.
The Parabolic nose cone is designed with a fineness ratio of 5:1, an overall length (L) of 3 meters, and a base diameter (D) of 0.6 meters, corresponding to a base radius (R) of 0.3 meters. This nose cone shape is defined by a smooth, continuous curve that ensures a gradual change in the flow path, potentially reducing shock waves and flow separation at hypersonic speeds. The parabolic profile is known for its effectiveness in reducing drag through a more uniform pressure distribution along the surface. The exact profile equation is essential in defining the curvature and is used to generate the 3D model for CFD simulations.
The LD-Haack series nose cone, commonly referred to as the LD-Haack series, is also designed with a fineness ratio of 6.75, maintaining the same overall length of 3 meters. This shape is specifically optimized for minimum drag in the hypersonic regime. The LD-Haack series nose cone follows a mathematical formulation that provides the least drag for a given length and fineness ratio, making it a preferred choice for high-speed applications. Its shape is derived from aerodynamic principles that aim to minimize wave drag by producing a streamlined form that closely follows the ideal aerodynamic shape.
The Power series nose cone is characterized by a customizable curvature defined by the power-law equation with a specific exponent ( n = 0.66 ). This profile is also set with a fineness ratio of 5:1, an overall length of 3 meters, and a base diameter of 0.6 meters. The vertical coordinate (y) corresponding to different horizontal positions (x) is calculated and tabulated, ensuring that the maximum radius of 0.3 meters is achieved precisely at the nose tip (x = 3 meters). The flexibility of the power series nose cone allows for fine-tuning the curvature to achieve optimal aerodynamic performance, making it a versatile choice for designers looking to balance drag reduction with other aerodynamic and structural requirements.
C. Nose Cone Geometry
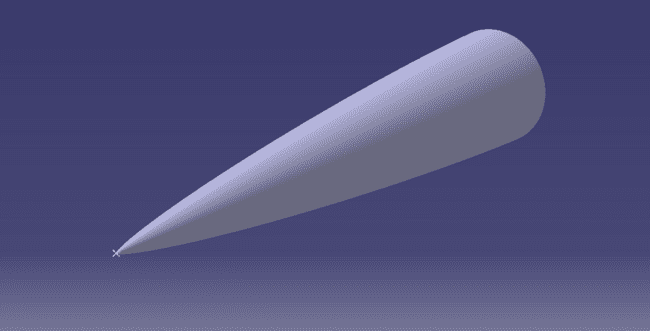
Figure 1.3D Model of LD-Haack Series Nose Cone
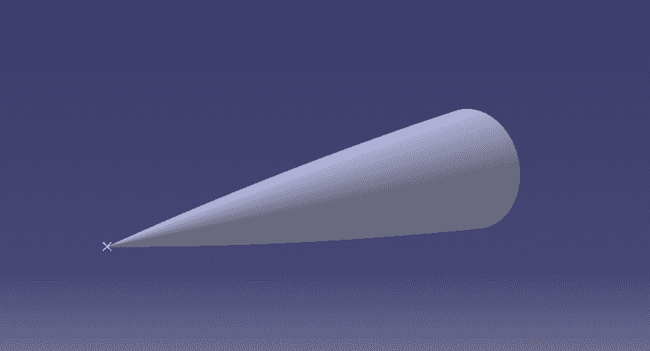
Figure 2.3D Model of Parabolic Nose Cone
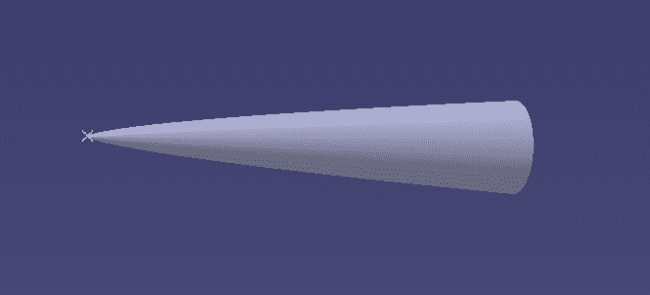
Figure 3.3D Model of Power Series Nose Cone
IV. SETUP
A. Computational Domain
For the CFD analysis presented in this research paper, a computational rectangular domain was constructed using the enclosure method in ANSYS Fluent to simulate the external flow around a rocket nose cone at hypersonic speeds. The domain was designed with dimensions of 12 meters in length, 4 meters in height, and 4 meters in breadth, providing ample space for capturing complex flow phenomena and ensuring that boundary conditions do not interfere with the flow field around the rocket. The choice of domain size was guided by best practices in CFD, which suggest maintaining a sufficient distance between the model and the domain boundaries to prevent artificial boundary effects, such as reflections of shock waves or spurious pressure changes, from affecting the solution. This spatial setup is particularly important for hypersonic flow studies, where accurate modeling of phenomena like shock wave formation and boundary layer behavior, is critical for understanding aerodynamic characteristics, such as drag and lift.
To create the computational domain, the geometry of the rocket nose cone was first imported into ANSYS Workbench, and the "Enclosure" tool within the DesignModeler was utilized to define a bounding box around the model. The enclosure was specified as a "Box" type, and the dimensions were carefully set to 12 meters in length, 4 meters in height, and 4 meters in breadth, providing an appropriate buffer zone around the nose cone.
The positioning of the enclosure ensured that the nose cone was centrally located, allowing sufficient distance from the inlet, outlet, and side boundaries to enable proper development of the flow. This setup is crucial for capturing the detailed aerodynamic behavior of the nose cone under hypersonic conditions, where high gradients in pressure, temperature, and velocity are expected, particularly near the nose and along the surface of the cone.
The enclosure method offers significant advantages in creating computational domains for external aerodynamic simulations. It simplifies the definition of the computational space by automatically generating a domain around the object of interest while providing flexibility in adjusting the size and shape to meet specific analysis requirements. This is particularly beneficial in hypersonic flow studies, where the domain must be large enough to accommodate shock waves, wake regions, and potential flow separation, yet efficient enough to manage computational resources effectively. After defining the enclosure, the meshing process was conducted to discretize the domain into computational cells, with a higher mesh density near the rocket nose cone to capture critical flow features such as shock layers, boundary layers, and separation zones accurately. The mesh was refined using inflation layers to resolve boundary layer effects and ensure a high-fidelity representation of the hypersonic flow, which is essential for accurately predicting drag force and coefficient values.
By using a carefully constructed computational domain with the enclosure method, the study ensures that the simulation environment is realistic and capable of capturing the full range of physical phenomena that occur at hypersonic speeds. The domain size was selected to provide a balance between computational cost and the need for accurate results, ensuring that the key aerodynamic parameters, such as drag coefficient, Mach number, and temperature distribution, are predicted with high confidence. The enclosure also serves as a foundational element for the subsequent analysis phases, such as turbulence modeling and solver settings, which are crucial for accurately representing the complex flow behavior around the rocket nose cone at high Mach numbers. Overall, the use of the enclosure method in creating a computational domain is a critical step in ensuring the reliability and accuracy of the CFD results presented in this research.
B. Meshing
The meshing process for the computational domain was an iterative process. When the mesh was being iterated on there were two main goals that had to be accomplished. The first goal was to ensure the important features of simulation, such as the shockwaves, boundary layer, etc. were captured. The second goal was to ensure the mesh allowed smooth transition of the flow to avoid numerical errors. The second goal was hampered since the pandemic restricted access to more processing power; therefore, the element count was kept within reasonable limits. To achieve these goals the geometry of the computational domain was split into various faces and helped to provide a more gradual mesh. These splits were based on a few iterations where different cuts were tested to see how the mesh developed and what improvements needed to be made. The final mesh was created using a combination of a structured and unstructured elements
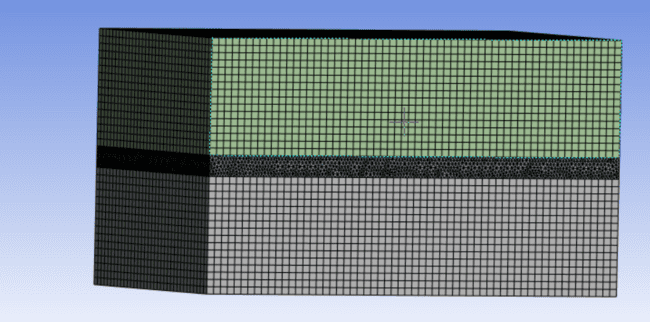

Figure 4. Meshing of LD-Haack Series Nose Cone
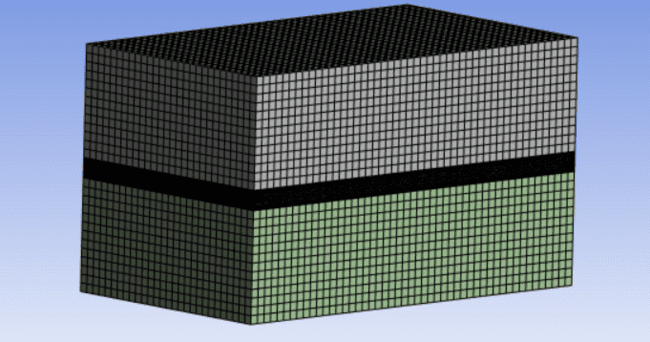

Figure 5. Meshing of Parabolic Nose Cone
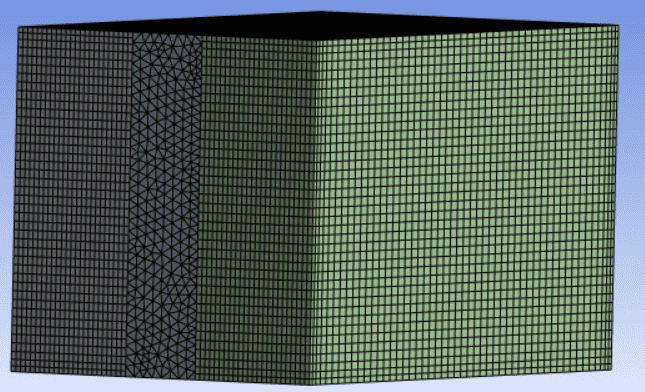
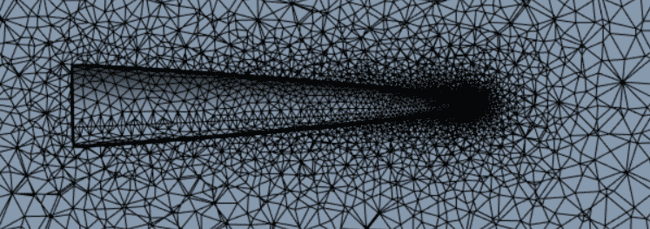
Figure 6. Meshing of Power Series Nose Cone
C. Fluent Settings
In my CFD analysis of hypersonic flow over a rocket nose cone, I initially used a density-based solver for 1,000 iterations to establish the flow field characteristics under extreme conditions. The density-based solver is particularly effective for compressible flows at high Mach numbers, as it directly solves the conservation equations for mass, momentum, and energy, thus capturing shock waves and other discontinuities more accurately. After completing the initial phase with the density-based solver, I transitioned to a pressure-based solver with the SIMPLE (Semi-Implicit Method for Pressure Linked Equations) algorithm, which is well-suited for handling incompressible and mildly compressible flows. This solver was employed to iterate the solution until convergence was achieved, ensuring that the residuals of all governing equations fell below the desired thresholds. The use of the SIMPLE algorithm helped in improving the stability of the numerical solution by linking the pressure and velocity fields effectively, which is crucial for accurately predicting the aerodynamic performance of the nose cone.
To model the turbulence effects, the SST (Shear Stress Transport) k-omega model was employed, providing a robust and reliable method for predicting both the onset and separation of turbulence in hypersonic flow regimes. The SST k-omega model combines the advantages of the k-omega model in the near-wall region with the k-epsilon model's ability to handle free-stream conditions, making it particularly suitable for complex flows involving shock-boundary layer interactions. Additionally, a simplified gas model was used to approximate the thermodynamic properties of the air. This approach balanced computational efficiency with accuracy by assuming ideal gas behavior and neglecting more complex effects like chemical reactions and vibrational energy modes, which are less significant under the conditions studied. Overall, this combination of solvers, turbulence modeling, and gas properties provided a comprehensive framework for accurately predicting the aerodynamic characteristics and drag forces on the nose cone at hypersonic speeds.
Table 2. SUMMARY OF SETTINGS FOR ANALYSIS
|
Category |
Description / Value |
||
|
Geometry |
Overall Length of Nose |
3 m |
|
|
Computational domain (see Fig. 3) |
Ahead from tip of nose |
4 m |
|
|
Behind from rear of Nose |
8 m |
||
|
Vertically above the highest point on the nose |
4 m |
||
|
Region A Element size |
LD-Haack Series Nose Cone : 0.1m Parabolic Nose Cone :0.08 m Power Series Nose Cone :0.25 m |
||
|
Region B Element size |
LD-Haack Series Nose Cone : 0.25 Parabolic Nose Cone :0.31 m Power Series Nose Cone :0.96 m |
||
|
Inflationary Mesh around the nose body |
First Layer Height |
0.0003 |
|
|
Growth Rate |
1.2 |
||
|
Number of Layers |
15 |
||
|
Setup and Solution |
Analysis Type |
3 D |
|
|
Precision |
Double |
||
|
Serial/Parallel Solver |
Serial |
||
|
Pressure/ Density Based |
Both |
||
|
Steady/Transient |
Steady |
||
|
Model |
SST k-Omega |
||
|
Boundary Conditions |
Inlet |
Velocity Inlet, Mach(5,6, 7,8,9, 10, 11,12), Turbulence Intensity 1% & Turbulence Viscosity Ratio 10.
|
|
|
Body |
Stationary Wall |
||
|
Outlet |
Pressure Outlet, Turbulence Intensity 1% & 1Turbulence Viscosity Ratio 10.
|
||
|
Reference Values |
Computed from Input |
||
|
Cd on Body |
|||
|
Residuals: made to converge to 0.001 |
|||
|
Solution Methods |
SIMPLE Solver with Second Order Upwinded Momentum and Second Order Upwinded Turbulence Kinetic Viscosity |
||
|
Number of Iterations |
Until Convergence |
||
V. ANALYSIS AND RESULT
A. Velocity Contour from Mach 5 to 12
1) LD-Haack Series Nose Cone
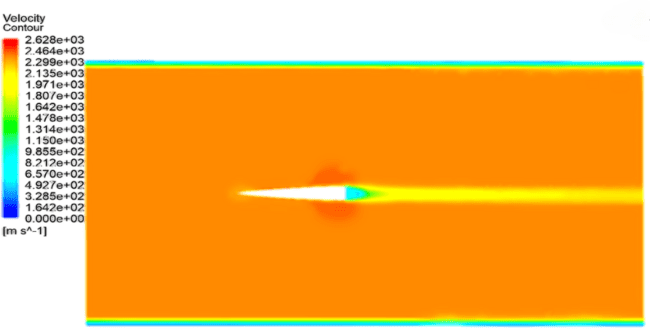
Figure 7. Velocity Contour of LD-Haack Series Nose Cone at Mach 5
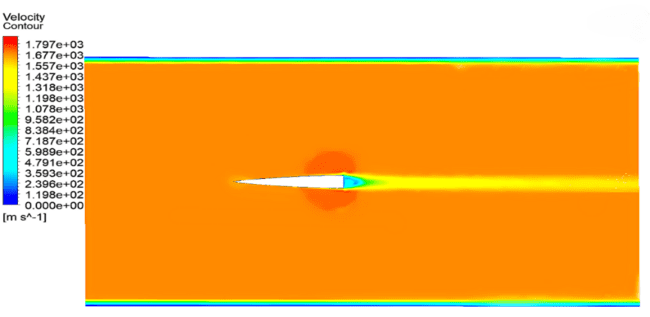
Figure 8 .Velocity Contour of LD-Haack Series Nose Cone at Mach 6
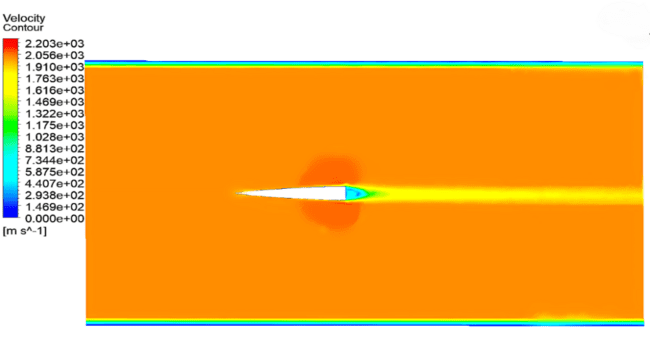
Figure 9. Velocity Contour of LD-Haack Series Nose Cone at Mach 7
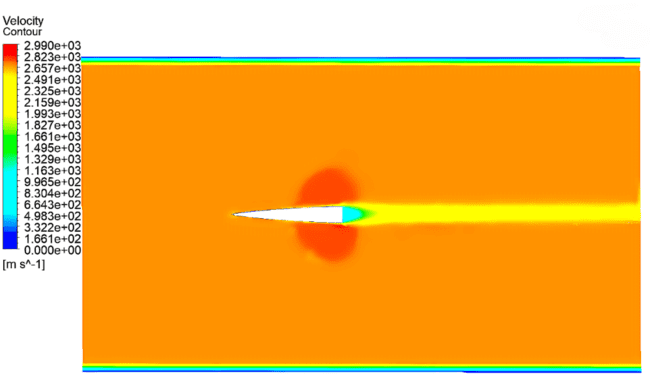
Figure 10. Velocity Contour of LD-Haack Series Nose Cone at Mach 8
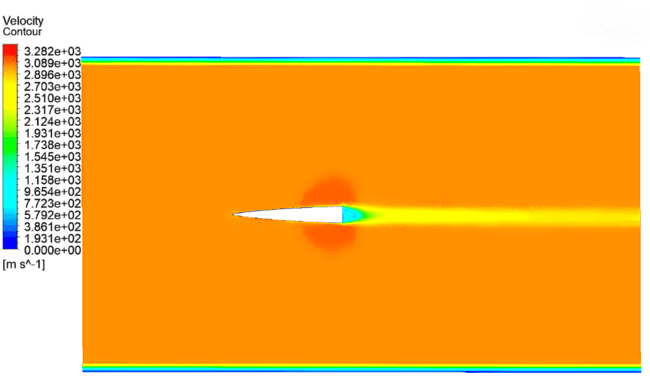
Figure 11. Velocity Contour of LD-Haack Series Nose Cone at Mach 9
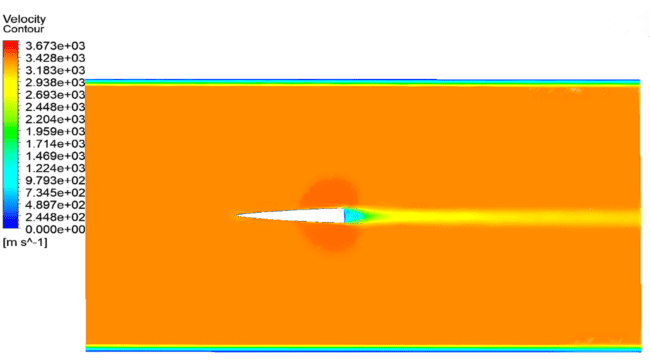
Figure 12. Velocity Contour of LD-Haack Series Nose Cone at Mach 10
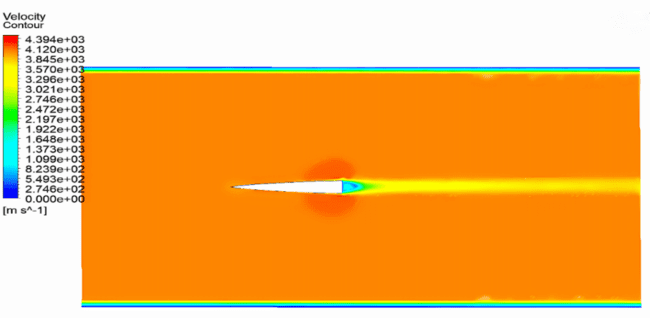
Figure 13. Velocity Contour of LD-Haack Series Nose Cone at Mach 11
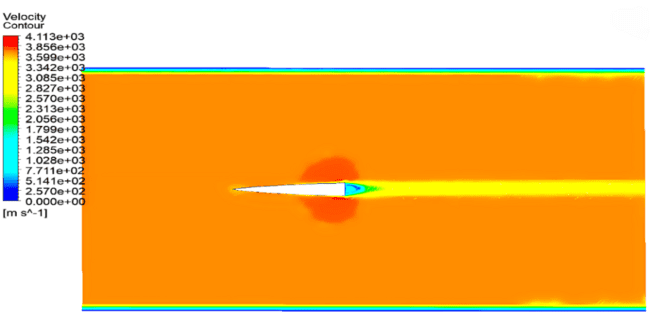
Figure 14. Velocity Contour of LD-Haack Series Nose Cone at Mach 12
2) Parabolic Nose Cone
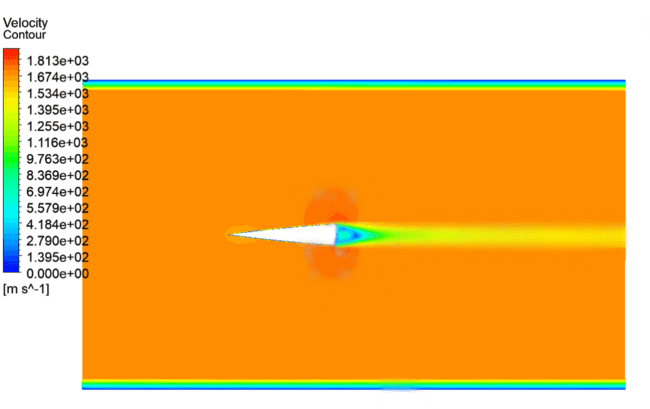
Figure 15. Velocity Contour for Parabolic Nose Cone at Mach 5
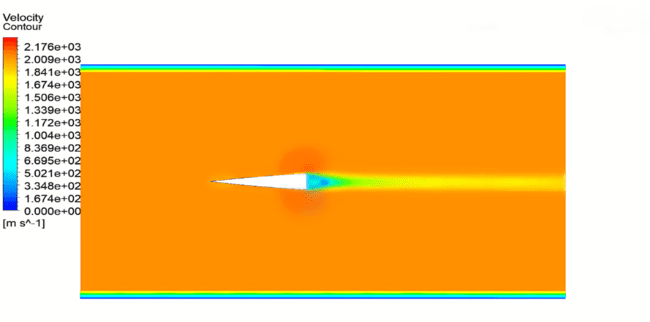
Figure 16. Velocity Contour for Parabolic Nose Cone at Mach 6
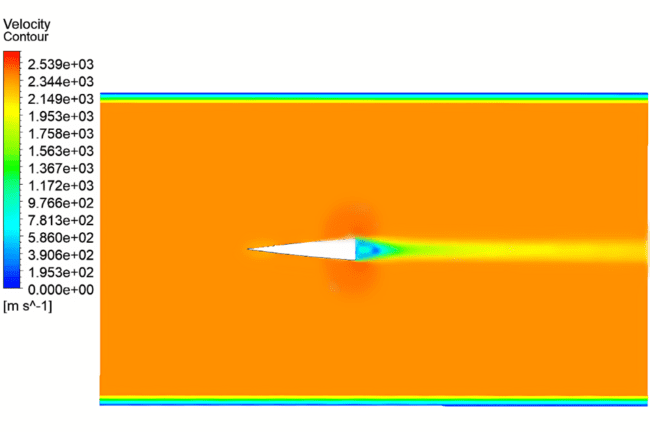
Figure 17. Velocity Contour for Parabolic Nose Cone at Mach 7
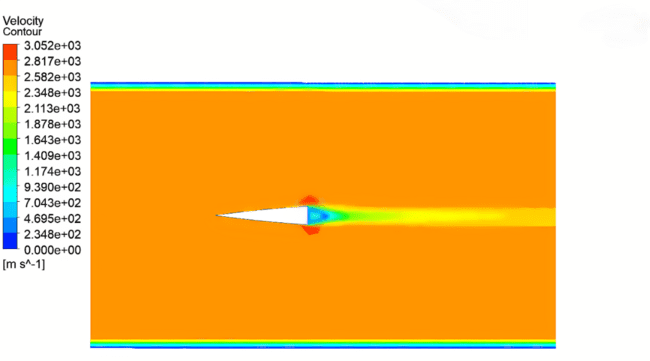
Figure 18. Velocity Contour for Parabolic Nose Cone at Mach 8
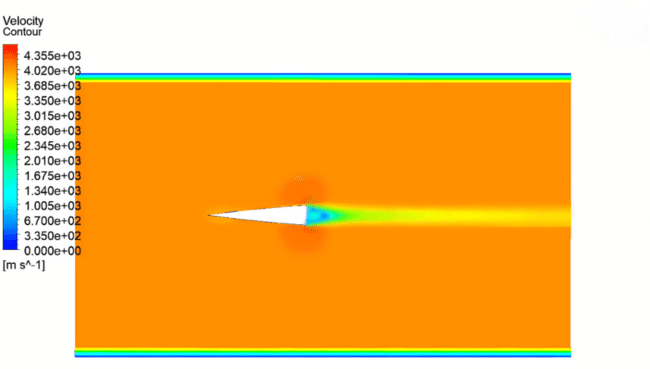
Figure 19. Velocity Contour for Parabolic Nose Cone at Mach 9
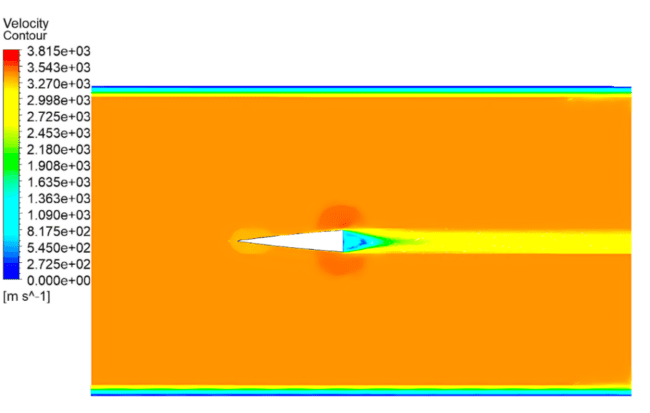
Figure 20. Velocity Contour for Parabolic Nose Cone at Mach 10
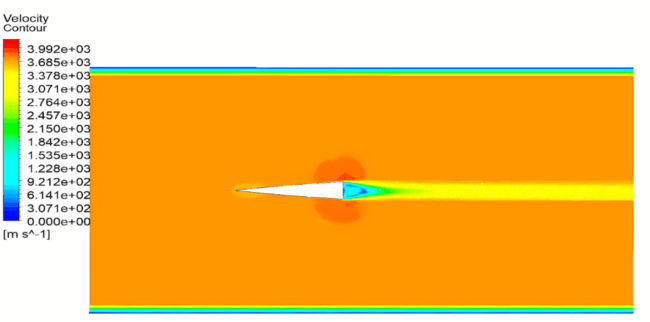
Figure 21. Velocity Contour for Parabolic Nose Cone at Mach 11
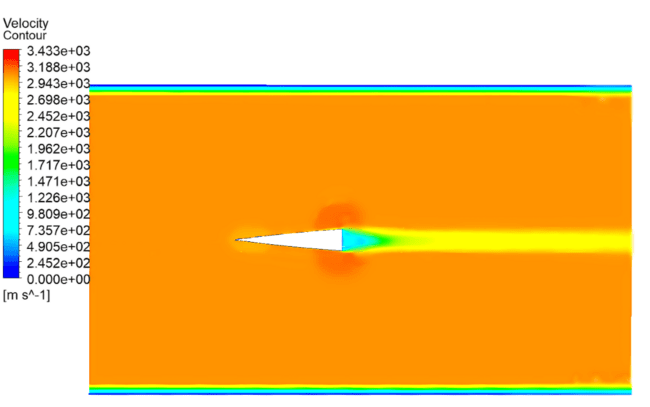
Figure 22. Velocity Contour for Parabolic Nose Cone at Mach 12
3) Power Series Nose Cone
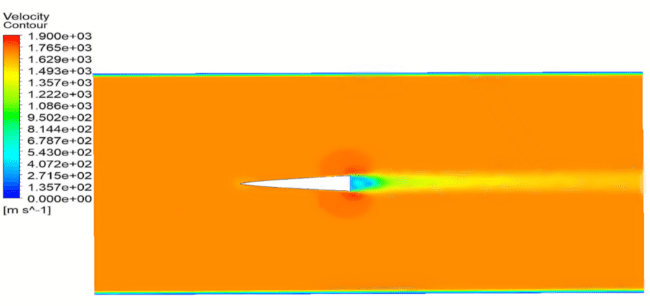
Figure 23. Velocity Contour of Power Series Nose Cone at Mach 5
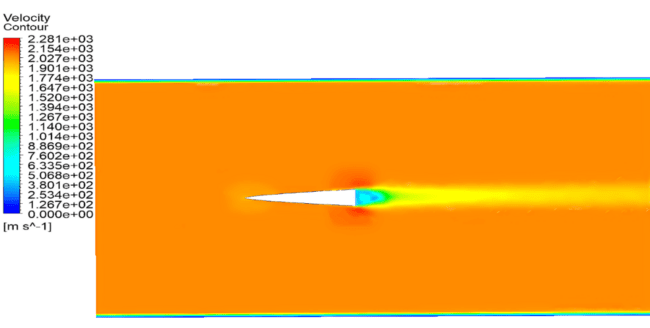
Figure 24. Velocity Contour of Power Series Nose Cone at Mach 6
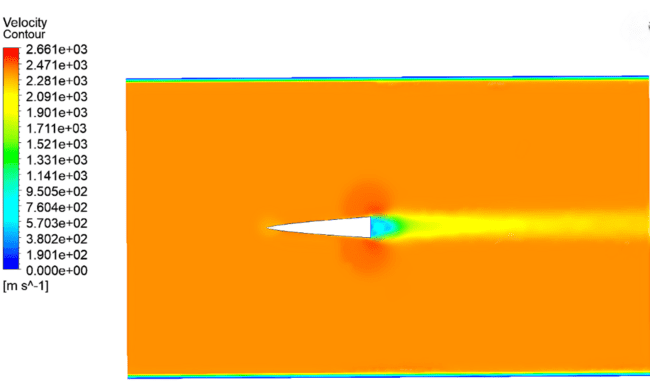
Figure 25. Velocity Contour of Power Series Nose Cone at Mach 7

Figure 26. Velocity Contour of Power Series Nose Cone at Mach 8

Figure 27. Velocity Contour of Power Series Nose Cone at Mach 9

Figure 28. Velocity Contour of Power Series Nose Cone at Mach 10

Figure 29. Velocity Contour of Power Series Nose Cone at Mach 11

Figure 30. Velocity Contour of Power Series Nose Cone at Mach 12
a) LD-Haack Series Nose Cone: Moderate Velocity Concentration with Relatively Wide Distribution
LD-Haack Series Nose Cone features a moderate velocity concentration at the tip and a relatively wide velocity distribution over its surface:
Flow Characteristics: The moderate concentration of velocity near the tip indicates that LD-Haack Series Nose Cone is moderately streamlined, allowing for some degree of airflow compression, but not as sharply as Power Series Nose Cone. The relatively wide velocity distribution suggests a more gradual change in velocity along the surface.
Drag Implications: This design results in a balance between skin friction drag and pressure drag. The moderate streamlining reduces skin friction to some extent, while the wider velocity distribution helps prevent excessive shock-induced pressure drag. However, compared to Parabolic Nose Cone, it may experience slightly higher drag due to less effective shock wave management and a thicker boundary layer.
b) Parabolic Nose Cone : Reduced Velocity Concentration with Wider Distribution
Parabolic Nose Cone has a reduced velocity concentration at the tip and the widest velocity distribution:
Flow Characteristics: The reduced concentration at the tip implies a blunter nose cone shape. This design spreads the airflow more evenly around the nose cone, leading to less intense compression of the air and a weaker, more detached bow shock that forms further from the surface.
Drag Implications: CFD analysis indicates that Parabolic Nose Cone has the minimum drag among the three designs. This is because the blunt shape effectively manages the shock waves, reducing pressure drag significantly. Additionally, the wider distribution of velocity reduces the intensity of aerodynamic heating and viscous effects, further lowering the overall drag. This result highlights that at hypersonic speeds, blunter designs are advantageous due to their ability to minimize both shock-induced drag and aerodynamic heating.
c) Power Series Nose Cone: Highest Velocity Concentration with Narrower Distribution
Power Series Nose Cone features the highest velocity concentration at the tip and a narrower distribution:
Flow Characteristics: The high concentration of velocity near the tip indicates a sharp, highly streamlined nose cone shape. This design is intended to minimize skin friction drag by reducing the wetted area exposed to high-speed flow. The narrow velocity distribution suggests a steep velocity gradient, which can lead to strong shock wave formation and increased aerodynamic heating.
Drag Implications: While Power Series Nose Cone is effective in reducing skin friction drag at lower speeds, it generates higher overall drag in hypersonic conditions due to stronger shock waves and increased pressure drag. The concentrated airflow at the tip creates a strong, attached bow shock that significantly raises the pressure in front of the nose cone, leading to higher pressure drag. Moreover, the narrow distribution leads to higher local temperatures and aerodynamic heating, further contributing to drag.
B. Pressure Contour from Mach 5 to 12
1) LD-Haack Series Nose Cone

Figure 31. Pressure Contour of LD-Haack Series Nose Cone at Mach 5

Figure 32. Pressure Contour of LD-Haack Series Nose Cone at Mach 6

Figure 33. Pressure Contour of LD-Haack Series Nose Cone at Mach 7

Figure 34. Pressure Contour of LD-Haack Series Nose Cone at Mach 8

Figure 35. Pressure Contour of LD-Haack Series Nose Cone at Mach 9

Figure 36. Pressure Contour of LD-Haack Series Nose Cone at Mach 10

Figure 37. Pressure Contour of LD-Haack Series Nose Cone at Mach 11

Figure 38. Pressure Contour of LD-Haack Series Nose Cone at Mach 12
2) Parabolic Nose Cone

Figure 39. Pressure Contour of Parabolic Nose Cone at Mach 5

Figure 40. Pressure Contour of Parabolic Nose Cone at Mach 6

Figure 41. Pressure Contour of Parabolic Nose Cone at Mach 7

Figure 42. Pressure Contour of Parabolic Nose Cone at Mach 8

Figure 43. Pressure Contour of Parabolic Nose Cone at Mach 9

Figure 44. Pressure Contour of Parabolic Nose Cone at Mach 10

Figure 45. Pressure Contour of Parabolic Nose Cone at Mach 11

Figure 46. Pressure Contour of Parabolic Nose Cone at Mach 12
3) Power Series Nose Cone

Figure 47. Pressure Contour of Power Series Nose Cone at Mach 5

Figure 48. Pressure Contour of Power Series Nose Cone at Mach 6

Figure 49.Pressure Contour of Power Series Nose Cone at Mach 7

Figure 50.Pressure Contour of Power Series Nose Cone at Mach 8

Figure 51.Pressure Contour of Power Series Nose Cone at Mach 9

Figure 52.Pressure Contour of Power Series Nose Cone at Mach 10

Figure 53.Pressure Contour of Power Series Nose Cone at Mach 11

Figure 54.Pressure Contour of Power Series Nose Cone at Mach 12
a) LD-Haack Series Nose Cone : Highest Pressure Concentration and Steep Gradient
High Pressure Concentration at the Tip: LD-Haack Series Nose Cone exhibits the highest pressure concentration at the tip among the three designs. This strong compression of airflow creates a high-pressure region at the tip, resulting in a significant, but concentrated, pressure drag.
Steep Pressure Gradient: The steep pressure gradient near the tip means that the pressure changes rapidly over a small distance. While this gradient can increase pressure drag, it also helps in reducing flow separation, thereby limiting the wake region behind the nose cone.
Boundary Layer Effects: Due to the steep pressure gradient, boundary layer effects are less prominent, reducing skin friction drag.
Drag Implications: Despite the high pressure at the tip, LD-Haack Series Nose Cone has less drag than Power Series Nose Cone. The steep pressure gradient prevents extensive boundary layer growth and flow separation, which helps in reducing the overall drag.
b) Parabolic Nose Cone: Moderate Pressure Concentration and Similar Gradient
Moderate Pressure Concentration at the Tip: Parabolic Nose Cone has a slightly lower pressure concentration at the tip compared to LD-Haack Series Nose Cone. This blunter shape reduces the pressure intensity and helps manage shock wave formation, resulting in moderate pressure drag.
Similar Pressure Gradient: The pressure gradient near the tip is still relatively steep but slightly less than LD-Haack Series Nose Cone, which helps in distributing the pressure over a slightly larger area.
Boundary Layer Effects: Boundary layer effects are slightly more noticeable compared to LD-Haack Series Nose Cone due to the less steep pressure gradient. However, they remain moderate, contributing to a reduction in total drag.
Drag Implications: Parabolic Nose Cone has the minimum drag overall due to its optimal balance between pressure drag and boundary layer effects. The moderate pressure concentration and gradient effectively minimize total aerodynamic drag in hypersonic conditions.
c) Power Series Nose Cone: Reduced Pressure and Less Intense Gradient
Lower Overall Pressure Level: Power Series Nose Cone shows a lower overall pressure level compared to LD-Haack Series Nose Cone and Parabolic Nose Cone. However, the design causes a more gradual pressure transition along the surface.
Less Intense Tip Pressure: The high-pressure region at the tip is less intense, leading to a less steep pressure gradient. This can reduce pressure drag but may not sufficiently control flow separation.
Prominent Boundary Layer Effects: The lower pressure gradient allows the boundary layer to grow more significantly along the surface, making boundary layer effects more pronounced.
Drag Implications: Despite having a reduced pressure level, Power Series Nose Cone experiences higher drag than LD-Haack Series Nose Cone. The less intense pressure gradient leads to more significant boundary layer growth and potential flow separation, increasing skin friction drag and contributing to a higher total drag.
C. Temperature Contour from Mach 5 to 12
1) LD-Haack Series Nose Cone

Figure 55.Temperature Contour of LD-Haack Series Nose Cone at Mach 5

Figure 56.Temperature Contour of LD-Haack Series Nose Cone at Mach 6

Figure 57.Temperature Contour of LD-Haack Series Nose Cone at Mach 7

Figure 58.Temperature Contour of LD-Haack Series Nose Cone at Mach 8

Figure 59.Temperature Contour of LD-Haack Series Nose Cone at Mach 9

Figure 60.Temperature Contour of LD-Haack Series Nose Cone at Mach 10

Figure 61.Temperature Contour of LD-Haack Series Nose Cone at Mach 11

Figure 62.Temperature Contour of LD-Haack Series Nose Cone at Mach 12
2) Parabolic Nose Cone

Figure 63.Temperature Contour of Parabolic Nose Cone at Mach 5

Figure 64.Temperature Contour of Parabolic Nose Cone at Mach 6

Figure 65.Temperature Contour of Parabolic Nose Cone at Mach 7
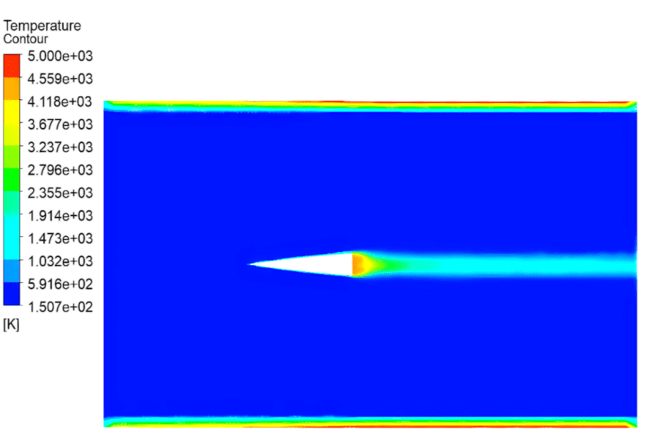
Figure 66.Temperature Contour of Parabolic Nose Cone at Mach 8

Figure 67.Temperature Contour of Parabolic Nose Cone at Mach 9

Figure 68.Temperature Contour of Parabolic Nose Cone at Mach 10

Figure 69.Temperature Contour of Parabolic Nose Cone at Mach 11

Figure 70.Temperature Contour of Parabolic Nose Cone at Mach 12
3) Power Series Nose Cone

Figure 71 .Temperature Contour of. Power Series Nose Cone at Mach 5

Figure 72.Temperature Contour of. Power Series Nose Cone at Mach 6

Figure 73.Temperature Contour of. Power Series Nose Cone at Mach 7

Figure 74.Temperature Contour of. Power Series Nose Cone at Mach 8

Figure 75.Temperature Contour of. Power Series Nose Cone at Mach 9

Figure 76. Temperature Contour of. Power Series Nose Cone at Mach 10
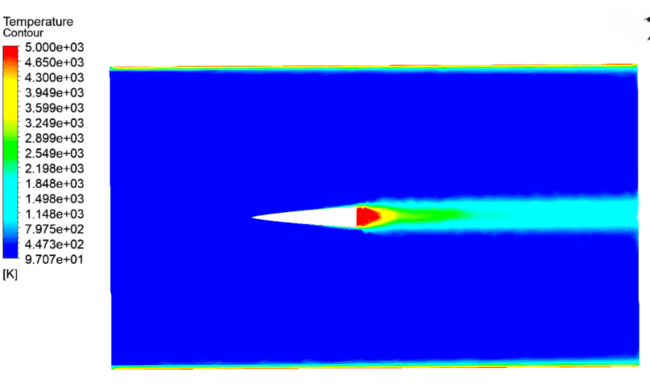
Figure 77. Temperature Contour of. Power Series Nose Cone at Mach 11

Figure 78. Temperature Contour of. Power Series Nose Cone at Mach 12
a) LD-Haack Series Nose Cone: Moderate Temperature with Symmetrical Distribution
Temperature Concentration at the Tip: LD-Haack Series Nose Cone exhibits a moderate temperature concentration at the tip. This suggests that the aerodynamic heating due to compression of the airflow is present but not extreme. The moderate temperature indicates a balanced shape that does not excessively concentrate heat at the tip.
Area of Temperature Distribution: The temperature distribution around LD-Haack Series Nose Cone is symmetrical, forming a moderate temperature zone around the nose cone. This symmetry suggests that the aerodynamic heating is evenly distributed around the nose cone, reducing localized thermal stress and heating.
Implications for Drag and Heating: The moderate temperature concentration and symmetrical distribution suggest that LD-Haack Series Nose Cone has a stable aerodynamic profile with moderate thermal loads. The balanced heating reduces thermal stresses, contributing to steady flow characteristics. However, the moderate temperature still indicates some pressure drag due to the heating effects, but less than what would occur in shapes with higher concentrations.
b) Parabolic Nose Cone: Slightly Lower Temperature with Asymmetrical Distribution
Temperature Concentration at the Tip: Parabolic Nose Cone has a slightly lower temperature at the tip compared to LD-Haack Series Nose Cone. This suggests that the nose cone is more blunt, allowing for a weaker shock wave that dissipates energy more effectively, resulting in reduced aerodynamic heating at the tip.
Area of Temperature Distribution: The temperature distribution is slightly asymmetrical with a moderate temperature zone extending into a longer tail. The asymmetry indicates that the airflow around the nose cone spreads the heating over a larger area, further reducing localized temperatures.
Implications for Drag and Heating: The lower tip temperature and slightly asymmetrical distribution reduce thermal stresses and help manage aerodynamic heating more effectively. This contributes to minimizing both pressure drag and heating effects. The longer tail of the temperature zone suggests that Parabolic Nose Cone manages heat dissipation efficiently, aligning with its lower drag performance observed in CFD results.
c) Power Series Nose Cone: Highest Temperature with Symmetrical, Wider and Longer Distribution
Temperature Concentration at the Tip: Power Series Nose Cone shows the highest temperature concentration at the tip. This indicates intense aerodynamic heating, likely due to a sharp, streamlined shape that generates a strong shock wave and compresses the air rapidly, leading to high temperatures.
Area of Temperature Distribution: The temperature zone for Power Series Nose Cone is symmetrical but wider and longer compared to LD-Haack Series Nose Cone and Parabolic Nose Cone. This means that not only is the temperature higher, but it also affects a larger surface area around the nose cone.
Implications for Drag and Heating: The higher temperatures and wider temperature zone suggest that Power Series Nose Cone suffers from significant aerodynamic heating, leading to increased thermal loads. The intense heating contributes to higher skin friction drag and can cause material degradation or structural issues. The wide and long temperature zone indicates that the heating effect extends further along the surface, which can increase total drag due to both skin friction and pressure effects.
D. Plots
Figure 79. Coefficient of Drag vs Mach Number Plot
In the CFD analysis of the three rocket nose cones at various Mach numbers, several trends were observed in their aerodynamic performance. Each nose cone's drag coefficient and drag force were examined to understand their behavior in hypersonic conditions, revealing how their shapes influence aerodynamic efficiency. Here is a detailed and refined explanation of the observed trends and the underlying reasons for each nose cone's performance characteristics.
LD-Haack Series Nose Cone:
LD-Haack Series Nose Cone exhibits a decreasing drag coefficient as the Mach number increases, starting from 0.03632 at Mach 5 and reducing to 0.031989 at Mach 12. The drag coefficient is a measure of the aerodynamic resistance experienced by a body in a fluid, and a lower value indicates a more streamlined shape that minimizes air resistance.The reduction in the drag coefficient with increasing Mach number suggests that LD-Haack Series Nose Cone's design effectively manages the high-speed airflow. As the speed increases, the airflow around the nose cone becomes more stable and attached to its surface, reducing the boundary layer separation and associated turbulence. This results in lower aerodynamic drag, as the nose cone's shape allows for smoother airflow over its surface, reducing the formation of vortices and wake regions. The decreasing drag coefficient indicates that the shape of LD-Haack Series Nose Cone is optimized for hypersonic conditions, where minimizing drag is critical to improving aerodynamic efficiency.
Parabolic Nose Cone:
Parabolic Nose Cone follows a similar trend to LD-Haack Series Nose Cone, with its drag coefficient decreasing from 0.035754 at Mach 5 and reducing to 0.030527 at Mach 12, indicating a comparable aerodynamic efficiency.
The decreasing drag coefficient with increasing Mach number suggests that Parabolic Nose Cone also possesses a streamlined shape that promotes attached flow and minimizes drag at hypersonic speeds. The design of Parabolic Nose Cone likely incorporates features that reduce turbulence, such as a gradual taper or pointed profile, which allows the airflow to remain attached to the surface longer, thereby reducing the drag force created by flow separation. As the Mach number increases, the nose cone's shape effectively manages the compressible flow effects, resulting in a reduction in the drag coefficient.
Power Series Nose Cone presents a different aerodynamic profile. It has a higher drag coefficient than LD-Haack Series Nose Cone and Parabolic Nose Cone, starting at 0.060304 at Mach 5 and decreasing to 0.054766 at Mach 12. This indicates that Power Series Nose Cone is less aerodynamically efficient, especially at lower Mach numbers.The higher drag coefficient for Power Series Nose Cone suggests a design that is less optimized for smooth airflow, resulting in increased turbulence and flow separation. The shape of Power Series Nose Cone might include features that cause earlier or more significant detachment of the boundary layer, such as a blunter nose or steeper angles. This causes the formation of larger wake regions and vortices behind the nose cone, which increases aerodynamic drag. The slight decrease in the drag coefficient as Mach number increases may indicate that, while Power Series Nose Cone is less efficient overall, some degree of flow stabilization occurs at higher speeds, possibly due to changes in shockwave structure or boundary layer behavior.
Figure 80. Drag Force vs Mach Number Plot
Despite the decreasing drag coefficient, the drag force experienced by LD-Haack Series Nose Cone increases significantly, from 14,964.01 N at Mach 5 to 76489.38 N at Mach 12.The increase in drag force is primarily due to the significant rise in dynamic pressure at higher Mach numbers. Drag force is directly proportional to dynamic pressure, which is a function of the fluid density and the square of the velocity. As the velocity of the nose cone increases, dynamic pressure increases quadratically, leading to a corresponding increase in drag force. Thus, even though LD-Haack Series Nose Cone becomes more aerodynamically efficient (as indicated by the lower drag coefficient), the overall drag force increases due to the higher speeds encountered.
The drag force for Parabolic Nose Cone increases from 14,602.88 N at Mach 5 to 73,634.46 N at Mach 12.
The rise in drag force, despite the decreasing drag coefficient, can again be attributed to the increase in dynamic pressure at higher velocities. The higher speed leads to a greater kinetic energy of the airflow, and since drag force is proportional to the square of the velocity, even a small reduction in drag coefficient cannot completely offset the increase in dynamic pressure. Therefore, the drag force continues to increase, highlighting the balance between improved aerodynamic efficiency and the inherent effects of higher speeds.
Power Series Nose Cone experiences the highest drag forces among the three designs, starting at 24,939.36 N at Mach 5 and increasing sharply to 131077.3 N at Mach 12.The substantial increase in drag force for Power Series Nose Cone is a result of its higher drag coefficient coupled with the increasing dynamic pressure at higher Mach numbers. Because Power Series Nose Cone generates more aerodynamic resistance due to its shape, it experiences significantly higher drag forces compared to LD-Haack Series Nose Cone and Parabolic Nose Cone. As the speed increases, the less streamlined shape exacerbates the effects of compressibility and shockwave interactions, leading to a marked increase in drag force. This highlights the importance of aerodynamic design in managing the trade-offs between drag coefficient and speed, especially at hypersonic velocities where small changes in design can result in significant performance differences.
Table 3. Comparison of drag characteristics of nose cones
|
Mach Number |
Drag characteristics
|
||||||||||
|
Drag force (N) |
Coefficient of drag |
||||||||||
|
Haack Series Nose Cone |
Parabolic Nose Cone |
Power Series Nose Cone |
Haack Series Nose Cone |
Parabolic Nose Cone |
Power Series Nose Cone |
||||||
|
Simulation (SST k omega) |
|||||||||||
|
5 |
14964.01
|
14,602.88
|
24939.36
|
0.03632
|
0.035754
|
0.060304
|
|||||
|
6 |
20972.48
|
20,422.58
|
35115.22
|
0.035199
|
0.03452
|
0.058966
|
|||||
|
7 |
27690.96
|
26,661.51
|
46973.35 |
0.034364
|
0.033361 |
0.057918
|
|||||
|
8 |
35456.55
|
34,406.41
|
60278.13
|
0.033731
|
0.032935
|
0.057039
|
|||||
|
9 |
44665.51
|
43718.29
|
75613.54
|
0.033137
|
0.032295
|
0.056382
|
|||||
|
10 |
54506.66
|
51,834.60
|
92443.92
|
0.032691
|
0.031729
|
0.055724
|
|||||
|
11 |
64529.11
|
61,882.51
|
110665.7
|
0.032301
|
0.031281
|
0.055203
|
|||||
|
12 |
76489.38
|
73,634.46
|
131077.3
|
0.031989
|
0.030527
|
0.054766
|
|||||
Conclusion
This CFD research paper analyzed the aerodynamic performance of three different rocket nose cone designs at hypersonic speeds ranging from Mach 5 to Mach 12. The results demonstrate clear differences in aerodynamic efficiency, as measured by the drag force and drag coefficient, among the three designs. The Parabolic Nose Cone exhibits the most favorable aerodynamic characteristics, with the lowest drag force and drag coefficient across the Mach numbers analyzed. This outcome suggests that its streamlined shape effectively manages airflow by minimizing boundary layer separation and reducing turbulence, which is critical in lowering drag at hypersonic velocities. Consequently, the Parabolic Nose Cone experiences the least aerodynamic resistance, making it the most suitable for high-speed applications where minimizing drag is essential for enhancing vehicle performance and fuel efficiency. The LD-Haack Series Nose Cone shows a slightly higher drag force and drag coefficient than the Parabolic Nose Cone, indicating that while it is still efficient, it is not as optimized as the parabolic design in managing airflow and reducing drag. Its aerodynamic performance is still favorable, but it experiences greater resistance than the Parabolic Nose Cone, particularly at higher Mach numbers. In contrast, the Power Series Nose Cone has the highest drag force and drag coefficient among the three designs, suggesting it is less optimized for hypersonic conditions. The higher drag is attributed to a shape that potentially causes earlier flow separation and greater turbulence, resulting in increased aerodynamic resistance. Although the Power Series Nose Cone shows a slight decrease in drag coefficient as the Mach number increases, it remains significantly less efficient compared to both the Parabolic Nose Cone and the LD-Haack Series Nose Cone, leading to substantially higher drag forces throughout the speed range. These findings highlight the critical impact of nose cone geometry on aerodynamic performance, especially at hypersonic speeds where the effects of compressibility, shockwave formation, and flow separation are more pronounced. The Parabolic Nose Cone is the most effective in minimizing both drag force and drag coefficient, followed by the LD-Haack Series Nose Cone, while the Power Series Nose Cone exhibits the highest aerodynamic resistance. Overall, this study emphasizes the importance of carefully designing and optimizing nose cone shapes for hypersonic flight. Future research could explore further refinements in nose cone geometries and the use of advanced materials to enhance performance, reduce drag, and improve the overall efficiency of hypersonic vehicles. These insights are valuable for the design of rockets and high-speed projectiles, contributing to advancements in aerospace technology and its applications in both commercial and defense sectors.
References
[1] A. Narayan, N. Subramanian, and R. Kumar. \"Hypersonic Flow Past Nose Cones of Different Geometries: A Comparative Study,\" October 2017. [2] Qaumi, T. S. \"Aerodynamic Optimization of the Von Karman Nose Cone for a Supersonic Sounding Rocket,\" April 2021. [3] Anderson, J. D. “Computational Fluid Dynamics: The Basics with Applications”. 6th Edition, 2017. [4] Van Milligan, A. \"Drag of Nose Cones.\" ‘Peak of Flight Newsletter’, Issue 346, Apogee Components Inc., August 27, 2013. [5] Narayan, A., Narayanan, N., and Kumar, R. \"Hypersonic Flow Past Nose Cones of Different Geometries: A Comparative Study,\" 2017. [6] Kumar, R. et al. \"Design and CFD Analysis of Hypersonic Nose Cones,\" 2017. [7] Narayan, A., Narayanan, N., and Kumar, R. \"Hypersonic Flow Past Parabolic and Elliptic Nose Cone Configurations,\" 2018. [8] Kim, S., and Al-Obaidi, A. \"Investigation of the Effect of Nose Shape and Geometry at Supersonic Speeds for Missile Performance Optimization,\" 2018. [9] Musharraf, M., and Srinivas, D. \"Performance Evaluation of Hypersonic Flow Past Blunt Bodies with Aerospikes Using Numerical Techniques,\" 2019. [10] “Computational Fluid Dynamics in Hypersonic Aerothermodynamics”, Journal of Aerospace Engineering, Vol. 32, No. 4, 2019. [11] Parziale, N. J., et al. \"Hypersonic Aerothermodynamics of a Reentry Vehicle.\" ,Journal of Spacecraft and Rockets, Vol. 50, No. 4, 2013. [12] Singh, S. K., et al. \"CFD Analysis of Hypersonic Flow Over a Rocket Nose Cone.\" ,Journal of Aerospace Engineering, Vol. 30, No. 4, 2017. [13] Liu, J., et al. \"Numerical Investigation of Hypersonic Flow Over a Blunted Cone.\" ,AIAA Journal, Vol. 57, No. 10, 2019. [14] Wang, X., et al. \"Hypersonic Flow Simulation Over a Rocket Nose Cone Using DSMC and NS Solvers.\" ,Journal of Fluids Engineering, Vol. 142, No. 10, 2020. [15] Anderson, J. D., Jr., Crouch, E. C., and Smith, G. E. \"Hypersonic Flow Simulations Using SIMPLE Algorithm with Pressure-Based Solver and Constant Fluid Properties,\" 2010
Copyright
Copyright © 2024 Jayesh Anil Tiwari . This is an open access article distributed under the Creative Commons Attribution License, which permits unrestricted use, distribution, and reproduction in any medium, provided the original work is properly cited.

Download Paper
Paper Id : IJRASET64487
Publish Date : 2024-10-07
ISSN : 2321-9653
Publisher Name : IJRASET
DOI Link : Click Here
 Submit Paper Online

