Ijraset Journal For Research in Applied Science and Engineering Technology
- Home / Ijraset
- On This Page
- Abstract
- Introduction
- Conclusion
- References
- Copyright
Impact and Trends of Climate Change Analysis of Streamflow at Various Gauging Stations in the Jhelum River, Jammu & Kashmir
Authors: Dr. Bashir Ahmad Pandit
DOI Link: https://doi.org/10.22214/ijraset.2024.58335
Certificate: View Certificate
Abstract
The planet Earth\'s water resources are involved in the biggest matter movement in the Earth\'s system, the hydrological cycle, which is infinitely repeated. Given that water is the fundamental component of the planet\'s life support system, it is critical to comprehend how current and anticipated climate change is affecting water availability and supplies. Stream flow trend analysis is crucial for flood forecasting and hydrologic drought assessment-related research, in addition to the study of water resource management. This study examined the long-term variations in stream flow at several gauging stations in the Jhelum River of Jammu and Kashmir . The Modified Mann-Kendall Test was used to analyze trends (MMKT). Sen\'s Slope Estimator (SSE) was employed in order to quantify trend. Trend analysis was performed using long-term time series data of the monthly and annual maximum stream flows at 10 gauging stations. The streamflow annual timeseries was not visible. any discernible upward or downward trends at any gauging point. Nonetheless, it was discovered that every noteworthy trend discovered at several gauging sites over the course of several seasons was declining in character. Throughout July, six gauging sites showed tendencies of declining streamflow. However, in addition to helping with regional hydrologic studies, this kind of river water flow research would also be helpful for studying the occurrence of floods and hydrologic droughts.
Introduction
I. INTRODUCTION
A global natural hazard, drought has detrimental effects on the environment, economy, and society. The two most worrisome hydrological severe events in the globe are droughts (low flow) and floods (high flow). Drought, on the other hand, is one of the most frequent natural disasters that negatively affects water resource and agricultural operations in a variety of ways. However, flood disasters are receiving more attention from researchers than droughts. Variations in rainfall and precipitation are one of the key factors influencing how climate change will impact the entire planet. Rising air temperatures and erratic precipitation are expected to cause a little shift in the climate pattern that will affect mountainous river systems. The hydrological cycle can be disrupted by climate change, which can have a substantial effect on water supplies. Water and climate are closely related to one another on Earth. Both the climate and water have an impact on one another. The water system changes in response to any alteration in the climate system and vice versa. One important stage of the hydrological cycle is stream flow. The water cycle can be accelerated by climate change, and the temporal and spatial distribution patterns of the local water resources can be changed. The hydrological cycle can be disrupted by climate change, which can have a substantial effect on water supplies. Water and climate are closely related to one another on Earth. Both the climate and water have an impact on one another. The water system changes in response to any alteration in the climate system and vice versa.
One important stage of the hydrological cycle is stream flow. The water cycle can be accelerated by climate change, and the temporal and spatial distribution patterns of the local water resources can be changed.
Changes in a river basin's hydrological regime are another effect of climate change. These modifications differ depending on the months or seasons rather than being evenly spaced out throughout the year. For example, a rise in winter temperatures may coincide with earlier snowmelts, delaying spring runoff until later in the winter. This reduces runoff during the summer months much more. Therefore, it's critical to determine the temporal fluctuations of streamflow trends in order to assess how climate change is affecting a river basin's hydrology. Finding patterns in lengthy time series of stream flow data in the Jhelum River at various segments is of scientific interest and practical significance in light of the recent floods in the Jhleum River of J&K. Planning for future water resources, flood forecasts, and flood protection systems also depend on it.
II. METHODOLOGY
A. Study Area

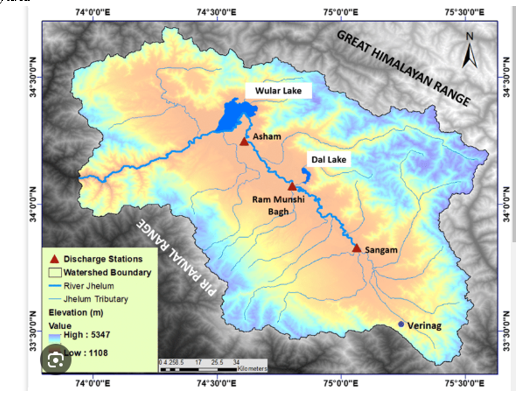
The Jhelum River study region is located between 33° 21′ 48′′ N and 34° 15′ 20′′ N latitude and between 74° 30′ 37′′ E and 75° 32′ 31′′ E longitude. The area of the Jhelum river defined watershed is 5802 km^. The main city in the valley, Srinagar, is growing quickly both spatially and temporally. It is situated on both banks of the Jhelum River. The Jhelum River is almost 725 km long, of which 117 km are in India and the remaining portion is in Pakistan. The Verinag spring, which is located at the Pir-Panjal in the southeast of the Kashmir valley, is the source of the Jhelum River. Before entering Pakistan, it passes by the Wular Lake and Srinagar, the capital of Jammu & Kashmir. The study area's map is displayed in Figure.
Rainfall in Srinagar is 710 mm per year. 103 days a year on average have more than 0 mm of rain, or 8.6 days a month with some amount of rain, sleet, snow, etc. March is the wettest month in Srinagar because of the city experiences more precipitation in March than during the monsoon season. March has an average rainfall of 115.6 mm, whilst July and August have averages of 60 mm and 70 mm, respectively. The research region has well-developed drainage. The catchment's drainage network is seen in the fig
B. Data Used
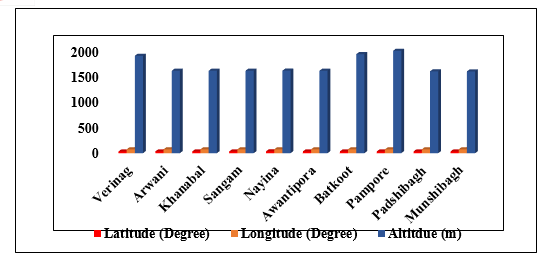
Records of daily stream flow for ten gauging stations spread throughout the river Jehlum were gathered from the Central Water Commission and the Irrigation and Flood Control Department in Kashmir. A total of 40 years were spent gathering the data (1980–2020). Verinag, Arwani, Khanabal, Sangam, Nayina, Awantipora, Batkoot, Pampore, Padshibagh, and Munshibagh are the gauging stations that were chosen for the study. provides the chosen gauging stations' geographic locations and heights. A time series of the maximum streamflow at each station, both annually and monthly, was obtained by analyzing the daily streamflow data. Because there were no floods in December, January, or February, the winter season was not employed for study. The analysis is done using the following seasons: autumn (September, October, and November), summer (June, July, and August), and spring (March, April, and May). In the autumnal season, only September was researched because October and November are not flood-prone months.

Using statistical techniques, a trend is used to identify changes in a random variable's value over time. Statistical tests, either parametric or non-parametric, are used to evaluate the significance of trends. The pattern The time series of the regional annual, monthly, and seasonal streamflow over river Jhelum were analyzed. These procedures basically consist of.
i Using the Modified Mann-Kendall test to detect trends;
ii. Using the Sen Slope estimator to estimate trend values.
- Modified Mann Kendall Test (MMKT)
A non-parametric statistical technique for trend analysis of time series data is the Mann-Kendall test. The World Meteorological Organization (WMO) has suggested using this method to evaluate the monotonic trend in hydro-meteorological time-series because of its ease of use and wider applicability .
A nonparametric statistical test called the Modified Mann-Kendall Test (MMKT) can be used to evaluate the significance of trends in the hydrological time series . In the Mann-Kendall test, the independent and randomly ordered nature of the data is the hypothesis. On the other hand, the presence of positive autocorrelation in the data raises the likelihood of identifying patterns when none are present. The well-known issue that the data may occasionally be auto-correlated is frequently disregarded by this test. For auto-correlated data, a theoretical connection was developed to compute the variance of the Mann-Kendall test statistics . Equation 1 provides the empirical formula for determining the variance of S in this instance of auto-correlated data:


Z ?Zα/2 signifies that the time series data show a significant trend. A positive (negative) S value means a significant upwards (downward) trend, α is the significance level. Because varying α corresponding to varying Zα/2, Climate Change Impact and Trends Analysis of Streamflow at Different Gauging Stations in Jhelum River Jammu and Kashmir suggests that the definition of significant trend in statistic changes. In this study, the significant level is set at 0.05, making Zα/2=1.96. Therefore, when the time series data produces Z?1.96, there is a significant upward or downward trend
2. Sen’s Slope Estimator (SSE)
Trend slopes in this study were computed using the (SSE). Sen developed the Sen's slope in 1968 as a tool for determining genuine trend slopes. The main benefits of the SSE over the general slope estimating approach are its ease of calculation, analytical estimations of confidence intervals, and robustness to outliers. These factors have led to its widespread adoption. With this method, the total slope is estimated by taking the median of the slopes calculated for each pair of time points. Sen's method works by taking all data pairs and applying them to calculate the slope of the line, as indicated by the following equation:

III. RESULTS AND DISCUSSION
Ten distinct stream gauges established at Jhelum River, Kashmir, had their trend analysis of streamflow reviewed for the years 1980–2020. Maximum streamflow time series spanning three months, including annual, monthly, and seasonal variations, were analyzed.
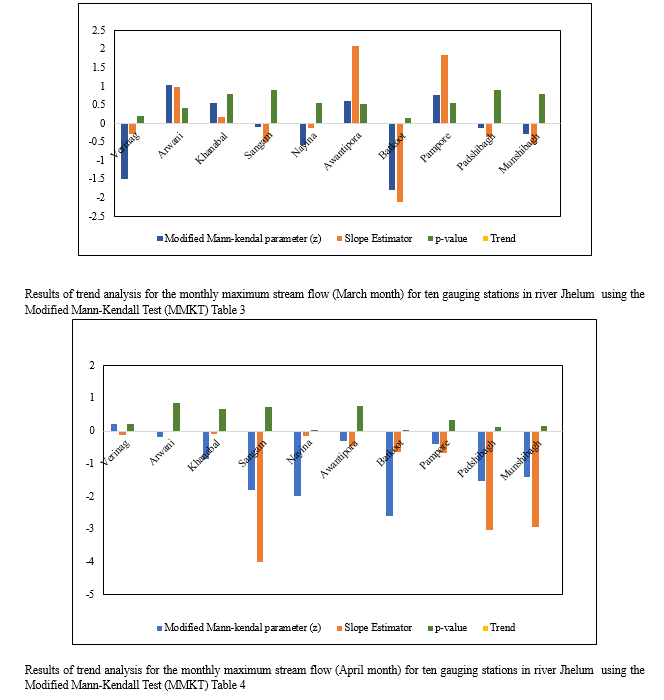
Table 2 presents the findings of a trend study about the yearly maximum stream flow at several gauge stations within the Jhelum river basin. Z α/2 value of 1.96 was used to determine if there was a trend in the data, with a significance level of α=0.05 being selected as the criterion. It was found that, of the 10 gauging stations, six displayed negative trends in maximum-annual stream flow, while four shown upward trends. At the 0.05 probability level, all of these trends were negligible, nevertheless. Sen Slope Estimate values were highest at the Awantipora gauge station, 2.086 cumecs/year, and lowest at Khanabal (0.176 cumecs/year), Arwani (0.991 cumecs/year), and Pampore (1.841 cumecs/year). The Batkoot gauge station, which has an SSE of -2.111 cumecs/year, displayed the highest declining trend.
Nonetheless, it was noted that, at the 0.05 probability level of significance, the maximum stream flow data at 10 Jhelum River gauging stations did not show any discernible pattern. However, Table 2's discussion of the probability level, Sen's slope, and the positive and negative values of the MK test value (z) provide information about the trend at particular probability levels.
Results of trend analysis for the yearly maximum stream flow for ten river Jhelum gauging stations using the Modified Mann-Kendall Test (MMKT) Table 2


Conclusion
This study used the Modified Mann-Kendall test to assess the trends in the maximum stream flow data collected from ten gauging stations in the Jhelum River. Sen Slope Estimate was also used to compute the trend slopes. The maximum annual stream flow study led to the conclusion that most of the patterns shown by several gauging stations at seasonal and annual timescales were not statistically significant. At any gauging site, the annual timeseries of streamflow did not exhibit any discernible rising or falling trends. Significant patterns, however, were discovered to be declining in character at many gauging stations across various seasons. Throughout July, six gauging sites showed tendencies of declining streamflow. We can therefore draw the conclusion that, even though the trend was not made clear in the long-term stream flow statistics, the stream flow data undoubtedly showed seasonal trends of various intensities.
References
[1] Ray K, Bhan SC, Bandyopadhyaay BK. The catastrophe over J & K in 2014 - A meteorical observational analysis. Current Science. 2015; 109(3):580-591. [2] 18. Indian Network for Climate Change Assessment (INCCA), November, Climate Change and India: A 4x4 Assessment. A Sectorial and Regional Analysis for 2030, New Delhi, MoEF, GoI; 2010. [3] 19. Duhan D, Pandey A. Statistical analysis of long term spatial and temporal trends of precipitation during 1901–2002 at Madhya Pradesh, India. Atmos. Res. 2013;122:136–149. [4] Shahid S, Hadi PS, Xiaojun W, Ahmed SS, Anil M, bin IT (2017) Impacts and adaptation to climate change in Malaysian real estate. Int J Clim Chang Strateg Manag 9:87–103. [5] Pasquini AI, Depetris PJ. Discharge trends and flow dynamics of South American rivers draining the southern Atlantic seaboard: An overview. J. Hydrol. 007;333:385–399. [6] Climate Change: Impacts, Adaptation and Vulnerability, Working Group II contribution to the IPCC 5th Assessment Report, Intergovernmental Panel on Climate Change, Geneva a Satellite Based Rapid assessment on Floods in Jammu & Kashmir- September, 2014. (NRSC, Dept. of Ecology, Environment and Remote Sensing Government of Jammu and Kashmir Srinagar.); 2014. [7] IPCC (2014) Climate change 2014: impacts, adaptation, and vulnerability —part B: regional aspects—contribution of Working Group II to the Fifth Assessment Report of the Intergovernmental Panel on Climate Change. Cambridge University Press, Cambridge. [8] Hamed KH, Rao AR (1998) A modified Mann-Kendall trend test for autocorrelated data. J Hydrol 204:182–196. [9] Haan CT. Statistical Methods in Hydrology, The Iowa State Univ. Press, Ames; 1977. 26. Mann H B (1945) Non-parametric Test Against Trend. Econometrika, Vol. 13, pp. 245-259. [10] Kendall M G (1975) Rank Correlation Methods. Charles Griffin. London. [11] Kendall MG (1948) Rank correlation methods. 29. Sen PK. Estimates of the regression coefficient based on Kendall’s tau. J. Am. Stat. Assoc. 1968; 63:1379–13810. Nijssen B, O’Donnell GM, Hamlet AF, Lettenmaier DP. Hydrologic sensitivity of global rivers to climate change. Clim. Change. 2001;50:143– 175. [12] Labat D, Goddéris Y, Probst JL, Guyot JL. Evidence for global runoff increase related to climate warming. Adv. Water Res. 2004;27:631–642. [13] Ramanathan V, Chung C, Kim D, Bettge T, Buja L, Kiehl JT, et al. Atmospheric brown clouds: impacts on South Asian climate and hydrological cycle. Proc. Nat. Acad. Sci. USA. 2005;102:5326– 5333. [14] Lettenmaier DP, Wood EF, Wallis JR. Hydroclimatological trends in the continental United States 1948–1988. Journal of Climate. 1994;7:586– 607. [15] Pandey Y, Mishra AK, Sarangi A, Singh DK, Sahoo RN, Sarkar S. Trend analysis of rainfall and runoff in the Jhelum basin of Kashmir Valley. Indian Journal of Agricultural Sciences. 2018; 88(2):320-5. [16] Chug S, Farroq MA. Satellite based rapid assessment on floods in J & KSeptember, 2015. Deptt. of Ecol., Env, and RS, Govt of J & K. 201 [17] Bashir Ahmad Pandit, Trend analysis of temperature and rainfall intensity in Kashmir valley, International Journal for Research in Applied Sciences & Engineering Technology, 2023,11,XI
Copyright
Copyright © 2024 Dr. Bashir Ahmad Pandit. This is an open access article distributed under the Creative Commons Attribution License, which permits unrestricted use, distribution, and reproduction in any medium, provided the original work is properly cited.

Download Paper
Paper Id : IJRASET58335
Publish Date : 2024-02-07
ISSN : 2321-9653
Publisher Name : IJRASET
DOI Link : Click Here
 Submit Paper Online

