Ijraset Journal For Research in Applied Science and Engineering Technology
- Home / Ijraset
- On This Page
- Abstract
- Introduction
- Conclusion
- References
- Copyright
Reviewing the Impact of Engineering Measures on Soil Erosion in Jammu and Kashmir Anantnag Watershed
Authors: Dr. Bashir Ahmad Pandit
DOI Link: https://doi.org/10.22214/ijraset.2024.64564
Certificate: View Certificate
Abstract
Planners now find that stopping soil loss in India\'s watersheds must be their top priority. Currently, a wide range of mathematical models are used worldwide to predict soil erosion. The Revised Universal Soil Loss Equation (RUSLE), which is frequently used to predict average soil loss, is one such model. Recently, there has been an increased emphasis on applying USLE/RUSLE in conjunction with Geographic Information System (GIS) technology, enabling grid-based analysis for predicting soil erosion and aiding management methods. This study assesses the efficacy of flood control and erosion management programs launched in 1914. Four different maps representing the possible erosion threats were created for four different time periods, and a comparison study was carried out to assess the changes that occurred. The implementation of various strategies such as terracing, afforestation, and rehabilitation in the watershed led to a noteworthy prediction of decreased soil loss in the watershed. In the temperate region of Jammu and Kashmir and sparsely vegetated areas, the rate of anticipated soil loss decreased from 632 to 378 metric tons per hectare per year between 1990 and 2020, indicating the efficacy of soil conservation measures in mitigating potential soil loss.
Introduction
I. INTRODUCTION
Natural resources and agricultural output are seriously threatened by water erosion, which causes soil erosion. Crop yields, ecosystems, hydrological systems, soil health, and ecosystem services are all negatively impacted by erosion. Numerous elements, such as wind, precipitation, related runoff processes, soil erosion susceptibility, land cover, and management features, all have an impact on soil erosion. On erodible fields around the world, the effects have resulted in an estimated average annual soil loss of 12 to 15 tons per hectare.
Around the world, a variety of engineering strategies and soil conservation tactics are employed to stop water erosion and rebuild degraded areas. Degraded soils can undergo significant erosion when they are exposed to high rainfall and are degraded due to overgrazing, deforestation, improper land use, etc. Terracing and other engineering techniques are used all over the world to manage water erosion on sloping terrain. Water flow velocity is slowed and water retention is increased by terraces built with a variety of construction techniques. Furthermore, the contouring method is applied for similar objectives in China and other countries of Europe. as the implementation of check dams, are employed to manage gully erosion. With these structures, it is essential to reduce the water’s flow rate and hold sediment. These engineering measures aid in preventing water erosion while also enhancing water quality in the watershed. To combat water erosion and prevent ecosystem deterioration, the riverbanks are protected so that gully erosion damages do not increase.
Monitoring soil erosion is an important part of soil conservation strategy. Even in experimental plots, calculating soil losses is costly and time-consuming. Understanding these erosion mechanisms and identifying locations prone to soil loss can greatly improve land management. Empirical water erosion prediction algorithms have been created to analyze high-eroding regions and anticipate those with little data. The most commonly used experimental model for estimating soil loss is the Revised Universal Soil Loss Equation (RUSLE). The RUSLE model, suitable for watershed conservation, is versatile, time- and cost-efficient, and useful for calculating soil loss in places with limited data. RUSLE estimates long-term yearly soil loss by taking into account the interactions between land use and cover, topography, soil type, and precipitation. Soil loss is calculated using the RUSLE model, which includes the multiplication of six parameters: The RUSLE model calculates soil loss by multiplying six parameters: erosivity (R), soil erodibility (K), slope length (L), slope steepness (S), cover management (C), and support practice (P).
These parameter values are derived from field and laboratory studies. Factors C and P are linked to soil conservation and land usage. In contrast, the R, K, and LS components are linked to the research area's ecological characteristics. In contrast, factors R, K, and LS are associated with the research area's ecological characteristics.
The cover management factor (C factor) indicates the most manageable conditions and is a characteristic that land planners may easily change to lower soil loss rates. C factor values vary from 0 to 1 and are calculated using the weighted average of soil loss rates (SLR). The most important impact on the C factor is due to changes in land use, specifically deforestation caused by agricultural land expansion.
Additionally, in other management-related applications, the P factor is considered. The P factor refers to mitigation methods that alter drainage patterns, flow concentration, flow velocity, and hydraulic forces to diminish water flow's erosive capacity. Soil and water conservation strategies have been shown to effectively limit soil erosion worldwide. Soil erosion can occur even on steep slopes.
II. METHODOLOGY
A. Study Area
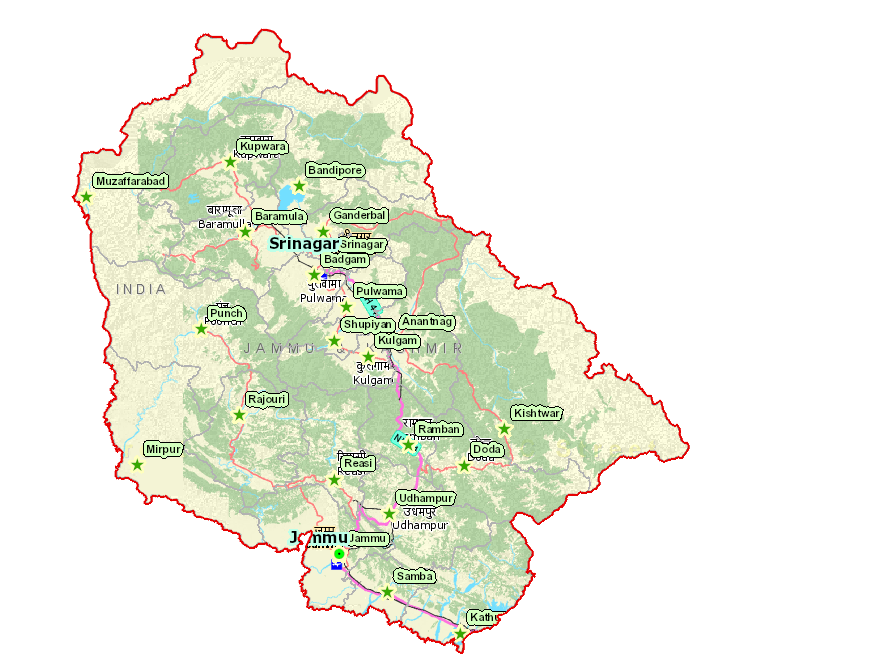
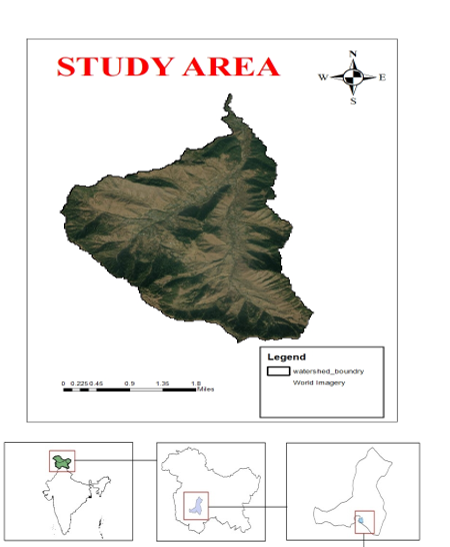
Jammu and Kashmir is located between 32°17' and 36°58' north latitude and 73°26' to 83°30' east longitude. It is located in the very north of the country. It is bordered on the north by China, on the east by Tibet, on the south by Himachal Pradesh and Punjab, and on the west by Pakistan. Geographically, the state is divided into four zones: the rugged and semi-mountainous plain known as the Kandi belt, hills including the Siwalik ranges, mountains of the Kashmir valley and Pir Pangal range, and the Tibetan tracts of Ladakh and Kargil. This state has numerous lakes, rivers, rivulets, and glacier zones. The significant rivers in this state are the Indus, Chenab, and Sutlej (Jhelum). The state's climate varies dramatically due to its location and topography.
The state of Jammu and Kashmir has three distinct climatic regions: the cold arid desert areas of Ladakh, the temperate Kashmir Valley, and the humid subtropical region of Jammu. The average annual rainfall in the cold desert zone (Ladakh region) ranges between 100 and 300 mm due to western disturbance. The annual rainfall in temperate regions (Kashmir valley and Pir Panjal) ranges from 600 to 900 mm, with snowfall. Leh is the coldest, whereas Jammu is the hottest. The mean monthly temperature is lowest in January and highest in July, with the exception of Jammu, where the greatest temperature occurs in June. The average monthly temperature in January ranges from -17°C at Drass to 14°C at Jammu. From January 15 until March 15, the temperature is extremely frigid.
III. METHODS
Estimating Soil Losses
The combined RUSLE approach was employed in this work to predict the sediment flux rates (ton ha−1 year−1).
The rainfall erosivity factor (MJ mm ha−1 h −1 y −1) is represented by the symbol R;
the soil erodibility factor (t ha h ha−1 MJ−1 mm−1) is represented by K;
the slope length factor is denoted by L;
the slope steepness factor is represented by S;
the cover management factor is indicated by C; and
the support practice factor is denoted by P.
The application of RUSLE technology necessitates the use of many digital databases in both raster and vector forms. These datasets provide Corine 2006 land use data along with digital elevation models (1:25,000), topographical maps (1:25,000), soil maps (1:25,000), forest maps (1:15,000), and afforestation maps (1:25,000).
Multiplying the maximum rainfall intensity for 30 minutes (I30) by the product (EI30) of the total rainfall energy (E) yields the R factor, also referred to as the factor of rainfall erosivity [26,. The R factor for this investigation was taken straight from the study region.
The impact of elevation classes on the current precipitation levels must be taken into account because there aren't enough meteorology stations in the study region for kriging. To create the spatial R surface, the study area's Digital Elevation Model (DEM) was used. Equation (2) was modified to take into consideration the equalization of rainfall levels dependent on the elevation within the watershed area:

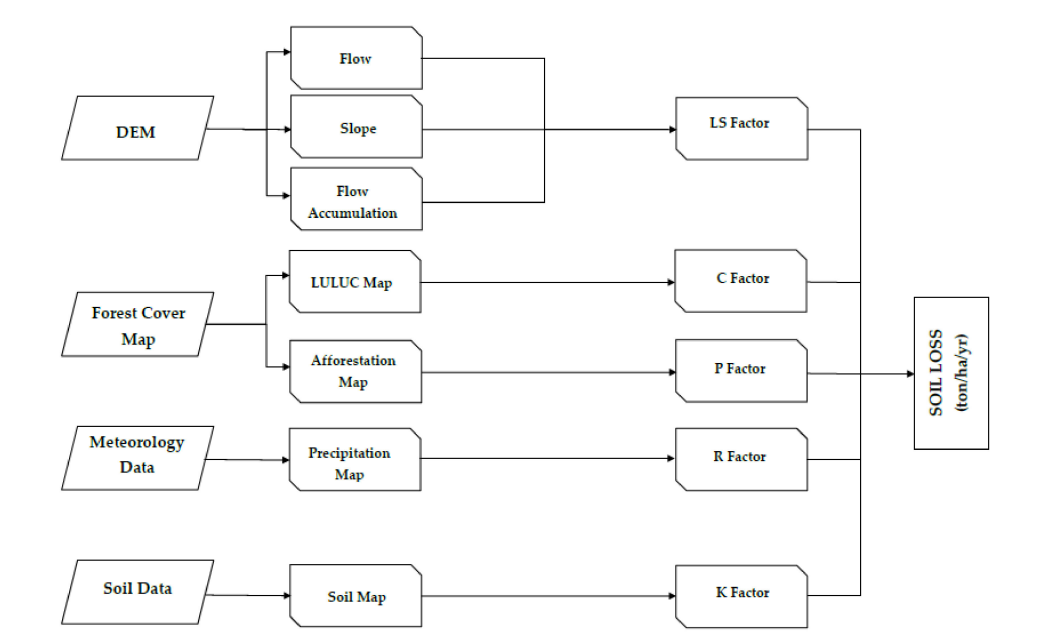
A schematic showing how the RUSLE model is used to estimate soil loss in the study region.
The variables Ry, Py, and Pr denote the corrected R factor value, average annual precipitation (mm), and average annual precipitation (mm) of the unknown unit, known as the known reference station.
The study made use of a 1:25,000 scale K factor map from the Erosion Database, which showed how resistant the soil was to erosion. Equation (3) was used to digitize K factors for soil unit measurements, and 23,000 profile data points ranging from 0 to 30 cm were used in the mapping and computation process. The equation was used and revised throughout the digitization of soil units. This was accomplished by linking the vector layers that contained soil class, erosion, and texture combination polygons, thus dividing various K classes.
Additionally, the outcomes were contrasted with the soil groups' K factor values.

The RUSLE soil erosion sensitivity is expressed by K (ton ha−1 ha MJ−1 h mm−1),
Where,
DG represents the geometrical average diameters of the primary soil components (mm),
OM stands for organic matter, and
C indicates the percentage of clay.
The most important factor influencing the danger of soil erosion is topography. Equation (4), the ArcMap 10.6.1 Hydraulic Accumulation tool, and the DEM of the watershed were utilized to determine the LS factor, which takes slope length and steepness into account. The benefit of Hydraulic Accumulation is that it takes into account both the slope's features and the region that contributes to it, enabling a more thorough evaluation of the complex terrain.

Where,
LS stands for the RUSLE topographical factor,
X for surface flow condensation number,
n for cell size where calculations are done, and
θ for slope steepness (o).
The kind and coverage of vegetation determine the cover management factor, which is represented by the C factor. Generally speaking, vegetation greatly influences erosion by reducing the kinetic energy of raindrops before they reach the soil surface. The C factor has a significant influence on the rise or fall in soil loss within a short time span, according to other factors. The following five subfactors make up the C factor, which goes from zero (a well-protected land cover) to one (barren areas): canopy cover (CC), surface cover (SC), surface roughness (SR), soil moisture (SM), and prior land use (PLU). As a result, C factor values for settlement areas are high whereas they are low for forest and grassland usage. Land use in 1970 was identified by this investigation.
However, the 1980 remote sensing mapping of Factor C was not analyzed since there were insufficient satellite photos. High spatial accuracy and pixel resolutions of the stand information were obtained by creating forest maps using aerial photographs and field measurements, and then verifying their accuracy with ground reference points spaced 500 meters apart. Seven categories were used to categorize the land use in the study area: water, sandy area, rocky area, woodland, grassland, and farmland. It was also divided into three sections based on the forest cover. Determining the C factor can be made simpler by consulting research that offer values for comparable land cover or studies carried out in the same location or region.
___________________________________________________________________________
Land Use Type/Land Cover CLUT/LC) C Factor Value____
Factor (0-45% ground cover) 0.23
Factor (21-49% ground cover) 0.3
Factor (60-100% ground cover) 0.09
Grass land 0.6
Agriculture 0.8
Water 7.5
Sandy Area 0.3
Rocky Area 7
Settlement 4
Slope improvement (terraces) and gully improvement (threshold and reverse dams, etc.) measures were carried out for the P factor as part of the watershed improvement project. To reduce slope erosion, 5234 hectares of land were covered by a total of 6453 km of terraces. The P factor (RUSLE-P = 1), which was determined using engineering measures, was set to 1. The 2020 P factor was computed using the application of Wenner's Method (Equation (5)).

S stands for the percentage steepness of the slope in this context.
Runoff carries nutrients and soil particles down a sloped surface, causing erosion. Raindrop impact, sheet erosion, rill erosion, and gully erosion are the main causes of slope erosion. For preventing slope erosion, terracing, mulching, cover crops, and contour plowing are common erosion management methods. Gully erosion is the process of concentrated water flow in a well-defined channel creating deep excavations in the soil.
Headcut erosion and bank erosion are two processes that lead to gully erosion. Restoring vegetation, installing rock check dams, grading and filling, creating diversion channels, gabions, and riprap are the most popular erosion control techniques for gully erosion.
The aforementioned equation has been utilized widely in several RUSLE research. Terracing, tillage, and other conservation techniques are exceedingly hard to depict on a land use map at the size of a big watershed. Under these circumstances, figuring out the P factor can be accomplished with the help of empirical formulae. Wenner's approach assumes that topographical features and inclination angle are related to the P factor.
IV. RESULTS
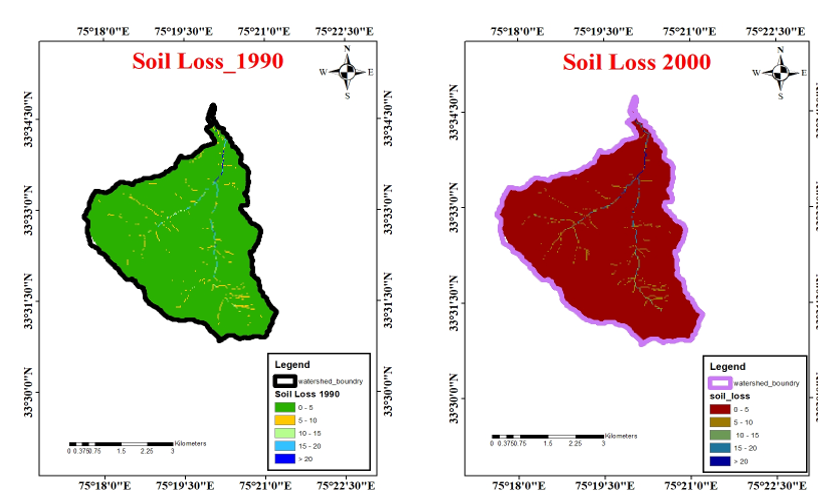
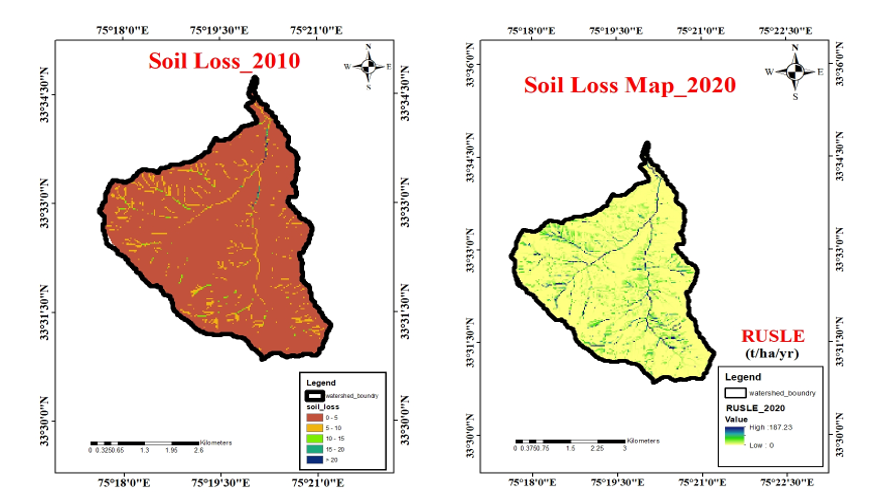
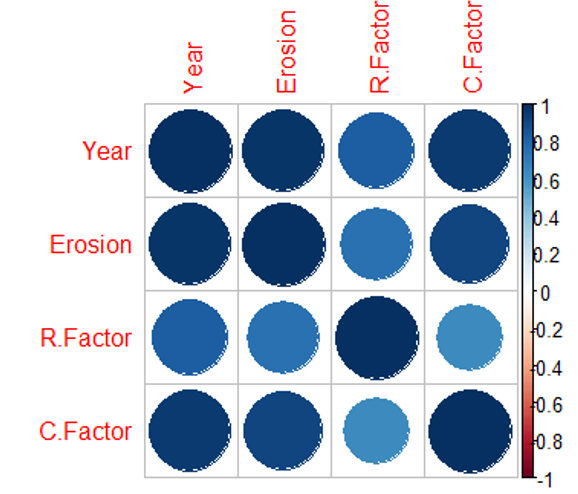
RS/GIS was used to estimate the annual soil losses over the research site based on the RUSLE model. After being transformed into 10 × 10 grids, all parameters were multiplied. Next, the anticipated soil loss from the study area's spatial distribution was discovered. In light of the fact that C and P factors would fluctuate while LS, R, and K factors would not alter when engineering measures were implemented, R and K factors were computed independently.
The watershed's DEM was used to compute the RUSLE-R factor layer. At the research site, the RUSLE-R factor had a mean value of 745.02 MJ ha−1 mm h−1 year−1, ranging from 683.5 to 919.42 MJ ha−1 mm h−1 year−1. Equation (4) was utilized to compute the LS factor, taking into consideration the interplay between topography and flow accumulation, using the DEM of the investigated region. The LS factor had a mean value of 53.72 and ranged in ranges from 0 to 520.21. Brown forest soils make up the majority of the research region (62%), and their K factor values ranged from 0.08 to 0.06 t ha h ha−1 MJ−1 mm−1, with a mean value of 0.04 t ha h ha−1 MJ−1 mm−1, depending on soil texture and depth (horizons).
Conclusion
Under Goal 15 of the Sustainable Development Goals of the United Nations, soil erosion is a global environmental problem that is becoming increasingly important given the world\'s expanding and changing population. Because the Revised Universal Soil Loss Equation (RUSLE) uses physical subfactors to describe various vegetation features in order to generate Soil Loss Ratios (SLR), it offers an interactive and dynamic model for evaluating vegetation-erosion interactions. In order to determine the relevant elements and calculate erosion losses in tiny valleys, RUSLE and GIS have become increasingly popular. This study highlights the importance of elements C and P in the fight against soil erosion, with the goal of supporting the sustainable use of land resources and stabilizing, stopping, and reversing land deterioration. The Watershed\'s land use and land cover (LUT/LC) have altered as a result of soil conservation efforts (P factor). According to the RUSLE model, the changes led to a significant 63% reduction in the watershed region\'s potential for soil erosion during a 40-year period. Over a 40-year period, the potential loss of soil would have increased by 452% if the engineering precautions had not been put in place.
References
[1] Biggelaar, C.D.; Lal, R.; Eswaran, H.; Breneman, V.E.; Reich, P.F. Land quality, agricultural productivity, and food security: Biophysical processes and economic choices at local, regional, and global levels. In Crop Yield Losses to Soil Erosion at Regional and Global Scales: Evidence from Plot-Level and GIS Data; Wiebe, K., Ed.; Edward Elgar Publishing Ltd.: Cheltenham, UK, 2003; pp. 262–279. [2] Erpul, G.; ?Ince, K.; Demirhan, A.; Küçümen, A.; Akda ?g, M.A.; Demirta¸s, I.; Sar?han, B.; Çetin, E.; ¸Sahin, S. Water Erosion Provincial Statistics—Soil Erosion Control Strategies (Sustainable Land/Soil Management Practices and Approaches), 1st ed.; General Directorate of Combating with Desertification and Erosion: Ankara, Turkey, 2020. [3] Avc?, B.C.; Kesgin, E.; Atam, M.; Tan, R.I. Spatial-Temporal Response of Sediment Loads to Climate Change and Soil Conservation Practices in the Northern Aegean Watershed, Türkiye. Water 2023, 15, 2461. [CrossRef] [4] Fang, H. Impacts of land use and soil conservation measures on runoff and soil loss from two contrasted soils in the black soil region, northeastern China. Hydrol. Process. 2023, 37, 14886. [CrossRef]] [5] Huang, B.; Liu, Z. Soil and Water Conservation Effects of Contour Reverse Slope Terraces on Red Clay Sloping Farmland against Short and Heavy Rainfall. Geofluids 2023, 2023, 9479632. [CrossRef] [6] Saggau, P.; Kuhwald, M.; Duttmann, R. Effects of contour farming and tillage practices on soil erosion processes in a hummocky watershed. A model-based case study highlighting the role of tramline tracks. Catena 2023, 228, 107126. [CrossRef] [7] Ebabu, K.; Tsunekawa, A.; Haregeweyn, N.; Tsubo, M.; Adgo, E.; Fenta, A.A.; Meshesha, D.T.; Berihun, M.L.; Sultan, D.; Vanmaercke, M.; et al. Global analysis of cover management and support practice factors that control soil erosion and conservation. Int. Soil Water Conserv. Res. 2022, 10, 161–176. [CrossRef] [8] Jia, L.; Zhao, W.; Zhai, R.; An, Y.; Pereira, P. Quantifying the effects of contour tillage in controlling water erosion in China: A meta-analysis. Catena 2020, 195, 104829. [CrossRef] [9] Tang, J.; Liu, G.; Xie, Y.; Wu, Y.; Wang, D.; Gao, Y.; Meng, L. Effect of topographic variations and tillage methods on gully erosion in the black soil region: A case-study from Northeast China. Land Degrad. Dev. 2022, 33, 3786–3800. [CrossRef] [10] Shah, P.; Dahal, K. Problems associated with implementation of bioengineering in hill road construction in Nepal. J. Eng. Appl. Sci. 2023, 70, 30. [CrossRef] [11] Lira-Caballero, V.G.; Martínez-Menez, M.R.; Romero-Manzanares, A.; García-Moya, E.; Ríos-Berber, J.D.; Rubio-Granados, E. Morphometry of gullies and bioengineering for sediment retention in the Mixteca Region of Oaxaca, Mexico. Ecohydrol. Hydrobiol. 2020, 20, 289–300. [CrossRef] [12] Kettenhuber, P.L.W.; dos Santos Sousa, R.; Dewes, J.J.; Rauch, H.P.; Sutili, F.J.; Hörbinger, S. Performance assessment of a soil and water bioengineering work on the basis of the flora development and its associated ecosystem processes. Ecol. Eng. 2023, 186, 106840. [CrossRef] Sustainability 2023, 15, 12001 14 of 16 [13] Shan, Y.; Zhong, Q.; Chen, S.; Wang, L.; Chen, X.; Mei, S.; Yang, M. Experimental study on predicting head-cut migration rate of check dams. J. Hydrol. 2023, 624, 129882. [CrossRef] [14] Zeng, Y.; Meng, X.; Wang, B.; Li, M.; Chen, D.; Ran, L.; Fang, N.; Ni, L.; Shi, Z. Effects of soil and water conservation measures on sediment delivery processes in a hilly and gully watershed. J. Hydrol. 2023, 616, 128804. [CrossRef] [15] Olivier, G.; Van De Wiel, M.J.; De Clercq, W.P. Intersecting views of gully erosion in South Africa. Earth Surf. Process. Landforms 2023, 48, 119–142. [CrossRef] [16] Chiang, Y.; Li, J.; Chen, S. Effects of Vegetation Root on Erosion Degree Under Different Arrangements of River Banks. In Proceedings of the EGU General Assembly 2023, Vienna, Austria, 23–28 April 2023. [17] Mohammed, S.; Alsafadi, K.; Talukdar, S.; Kiwan, S.; Hennawi, S.; Alshihabi, O.; Sharaf, M.; Harsanyie, E. Estimation of soil erosion risk in southern part of Syria by using RUSLE integrating geo informatics approach. Remote Sens. Appl. Soc. Environ. 2020, 20, 100375. [CrossRef] [18] Wischmeier, W.H.; Smith, D.D. Predicting Rainfall Erosion Losses: A Guide to Conservation Planning (No. 537), 1st ed.; USA Department of Agriculture: Washington, DC, USA, 1978. [19] Renard, K.G.; Foster, G.R.; Weesies, D.K.M.; Yoder, D.C. Predicting Soil Erosion by Water: A Guide to Conservation Planning with the Revised Universal Soil Loss Equation (RUSLE); USDA: Washington, DC, USA, 1997. [20] Zerihun, M.; Mohammedyasin, M.S.; Sewnet, D.; Adem, A.A.; Lakew, M. Assessment of soil erosion using RUSLE, GIS and remote sensing in NW Ethiopia. Geoderma Reg. 2018, 12, 83–90. [CrossRef] [21] Ozcan, A.U.; Erpul, G.; Basaran, M.; Erdogan, H.E. Use of USLE/GIS technology integrated with geostatistics to assess soil erosion risk in different land uses of Indagi Mountain Pass—Çankiri, Turkey. Environ. Geol. 2008, 53, 1731–1741. [CrossRef] [22] Renard, K.G.; Foster, G.R.; Weesies, G.A.; Porter, J.P. Revised universal soil loss equation (Rusle). J. Soil Water Conserv. 1991, 46, 30–33. [CrossRef] [23] Panagos, P.; Borrelli, P.; Meusburger, K.; Alewell, C.; Lugato, E.; Montanarella, L. Estimating the soil erosion cover-management factor at the European scale. Land Use Policy 2015, 48, 38–50. [CrossRef] [24] Mukharamova, S.; Saveliev, A.; Ivanov, M.; Gafurov, A.; Yermolaev, O. Estimating the soil erosion cover-management factor at the european part of Russia. ISPRS Int. J. Geo-Inf. 2021, 10, 645. [CrossRef] [25] Tu, A.; Xie, S.; Yu, Z.; Li, Y.; Nie, X. Long-term effect of soil and water conservation measures on runoff, sediment and their relationship in an orchard on sloping red soil of southern China. PLoS ONE 2018, 13, 1–19. [CrossRef] [26] Panagos, P.; Borrelli, P.; Meusburger, K.; van der Zanden, E.H.; Poesen, J.; Alewell, C. Modelling the effect of support practices (P-factor) on the reduction of soil erosion by water at European scale. Environ. Sci. Policy 2015, 51, 23–34. [CrossRef] [27] Schmidt, S.; Alewell, C.; Meusburger, K. Mapping spatio-temporal dynamics of the cover and management factor (C-factor) for grasslands in Switzerland. Remote Sens. Environ. 2018, 211, 89–104. [CrossRef] [28] Benavidez, R.A.H. Understanding the Effect of Changing Land Use on Floods and Soil Erosion in the Cagayan De Oro Catchment. Ph.D. Thesis, Victoria University of Wellington, Wellington, New Zealand, 2018. [29] Özcan, A.U.; Ayta¸s, ?I. Effects of soil erosion on doline lake degradation within karst landscapes: Bakkal Lake, Turkey. Environ. Monit. Assess. 2020, 192, 140. [CrossRef] [30] Staff, S.S. Soil Taxonomy: A Basic System of Soil Classification for Making and Interpreting Soil Surveys, 2nd ed.; USDA: Washington, DC, USA, 1999. [31] Chen, D.; Wei, W.; Chen, L. Effects of terracing practices on water erosion control in China: A meta-analysis. Earth Sci. Rev. 2017, 173, 109–121. [CrossRef [32] Dr.B.A.Pandit: Estimating Soil Erosion and the Effect of Changing Land Use and Land Cover in the Bringi Catchment’s Devalgam Watershed Using RS and GIS, International Journal for Research in Applied Science & Engineering Technology (IJRASET) ISSN: 2321-9653; IC Value: 45.98; SJ Impact Factor: 7.538 Volume 12 Issue I Jan 2024-
Copyright
Copyright © 2024 Dr. Bashir Ahmad Pandit. This is an open access article distributed under the Creative Commons Attribution License, which permits unrestricted use, distribution, and reproduction in any medium, provided the original work is properly cited.

Download Paper
Paper Id : IJRASET64564
Publish Date : 2024-10-13
ISSN : 2321-9653
Publisher Name : IJRASET
DOI Link : Click Here
 Submit Paper Online

