Ijraset Journal For Research in Applied Science and Engineering Technology
- Home / Ijraset
- On This Page
- Abstract
- Introduction
- Conclusion
- References
- Copyright
Indoor Air Quality Monitoring System
Authors: P Sree Sudha , Durgalla Shravya Sri, Gadivemula Ragha Vaishnavi, Kunta Nikhitha Reddy, Malladi Mahathi
DOI Link: https://doi.org/10.22214/ijraset.2024.64704
Certificate: View Certificate
Abstract
The awareness of the risks associated with contaminated indoor air quality is often lacking among individuals. This study employs a prototyping method, utilizing an Arduino Uno integrated with various sensors to monitor air quality. A sound buzzer alerts users when the sensor readings indicate hazardous conditions. Additionally, a Wi-Fi module connects the Arduino Uno to the internet, facilitating data uploads to the IoT platform ThingSpeak.
Introduction
I. INTRODUCTION
In an age characterized by rapid data transmission, the Internet of Things (IoT) has emerged as a significant technological trend. Air, an invisible gaseous substance, plays a crucial role in human health; an individual typically inhales approximately 14,000 liters of air daily. The presence of pollutants such as CO, CO2, and NO2 in the air can adversely impact health, with the Air Quality Indicator (AQI) serving as a critical measure of air quality based on these pollutants [1]-[3]. This paper presents an IoT-based air pollution monitoring system utilizing Arduino technology. As air quality deteriorates, monitoring is essential for a sustainable future.
Clean air is vital for human health, as polluted air can have detrimental effects on the body. The human respiratory system lacks the ability to selectively filter out harmful substances, leading to the inhalation of not only oxygen (O2) but also dust, formaldehyde, pesticides, fungi, and other hazardous particles found indoors. Indoor environments can be more polluted than outdoor spaces due to restricted air circulation and various pollution sources, including building conditions, materials, and human activities. Factors such as humidity, heat, gases, and chemical products contribute to indoor air pollution [1]. Such pollutants can result in health issues ranging from temporary discomfort to permanent damage, including headaches, skin irritations, respiratory disorders, and asthma [2]-[3]. A monitoring system for indoor air quality is therefore necessary to mitigate these effects. This research proposes a system utilizing Arduino and MQ135 sensors to detect indoor air quality, paired with an Android application to enhance user awareness of air pollution levels. The indoor air quality monitoring system is constructed using Arduino and MQ135 sensors. The Arduino serves as a programmable electronic module that processes input data from the sensors, which are connected to a Wi-Fi module for internet access, allowing for data storage on an IoT platform. The advancement of information and communication technology has given rise to modern devices that provide essential environmental information. IoT continues to evolve, integrating devices that support daily human activities more efficiently [4]. As reported, 127 new IoT devices connect to the internet every second, with experts estimating that 31 billion devices will be active by 2020 [5]. This research aims to develop an IoT device for comprehensive air quality monitoring, which is further integrated with an Android application. Air pollution represents a significant challenge to global health. The World Health Organization (WHO) reports that around 90% of the global population breathes polluted air, contributing to approximately 7 million deaths annually [1]. While substantial research has concentrated on outdoor air pollution and its health implications [2]-[3], indoor air pollution poses comparable risks, as individuals spend nearly 90% of their time indoors in environments such as offices, schools, homes, and shopping malls [4]-[5]. The U.S. Environmental Protection Agency identifies poor indoor air quality as one of the top five environmental threats to public health, with indoor pollutant concentrations potentially exceeding outdoor levels by a factor of 100 [6]. Indoor air quality (IAQ) is influenced by various factors, including temperature, relative humidity, CO, CO2, formaldehyde (HCHO), total volatile organic compounds (TVOC), and particulate matter (PM2.5, PM10) [7]-[8]. Inadequate IAQ can lead to serious health issues and symptoms known as "sick building syndrome" (SBS) [8]-[9], adversely affecting both health and productivity [10]. Therefore, a real-time indoor air quality monitoring system (IAQMS) is essential to collect data from diverse locations and provide universal access to IAQ information. Historically, IAQ assessment required sampling air into a bag, which was then analyzed in a laboratory setting. Early air quality detectors were often large and cumbersome, hindering real-time, on-site detection. However, advances in sensor and electronic technologies have led to the development of portable IAQ data collectors, known as dataloggers, which can be strategically placed for field measurement, with data subsequently analyzed using SD cards or USB communication. The advent of wireless sensor networks (WSN) and IoT technologies has significantly enhanced data collection and transmission capabilities.
With internet access, monitored parameters can be readily accessed via web platforms or mobile applications. Unlike traditional methods such as air bags or dataloggers, IoT-based indoor air quality monitoring systems facilitate the observation of spatially variable phenomena, such as IAQ in buildings. Given the multifaceted nature of environmental parameters, it is critical to monitor multiple factors for effective IAQ assessment. Recent advancements have shown significant progress in sensor technology dedicated to IAQ monitoring over the past decade, allowing for a diverse range of sensors to be employed in indoor environmental monitoring systems.
II. LITERATURE REVIEWS
There has been a significant amount of literature focused on the field of indoor air quality monitoring systems (IAQMS), and this section will review key contributions in this area. Table 1 summarizes various studies on IAQMS in recent years, categorized by four factors: monitoring parameters, network type, system architecture, and the presence of an enclosure or shell for the system.
Regarding monitoring parameters, different studies monitor different indoor air quality variables. Temperature and humidity are among the most common parameters, as they directly affect thermal comfort in indoor spaces, influencing both physiological and psychological states. Although CO2 is not a direct pollutant, it is the second most frequently measured parameter in indoor environments such as offices and classrooms. Low CO2 levels can cause fatigue and headaches by inhibiting the respiratory system, while higher concentrations can lead to more severe symptoms like vomiting and dizziness. Few studies focus on CO2 monitoring in offices, laboratories, and living rooms. Total volatile organic compounds (TVOC) pollution in indoor environments is examined using wireless sensor networks (WSN) for monitoring in factories and residential buildings, respectively, as elevated TVOC levels can irritate the skin, throat, and respiratory system. Ozone (O3) is another critical gas, indispensable to the atmosphere but a cause of respiratory ailments. Firdhous et al. propose an O3 monitoring system based on IoT in an office setting. Additionally, some studies focus on pollutants like CO and NO2, which are related to specific application environments. Notably, particulate matter (PM) and formaldehyde (HCHO) are recognized as particularly harmful to human health, drawing considerable attention in the literature .
In terms of network infrastructure, wireless networks are increasingly favored for IAQMS data transmission due to their flexibility. Only two studies use wired connections to gather sensor data. However, wireless network performance can vary significantly, especially in indoor environments with structural barriers. For instance, Bluetooth, used in a certain study, has a limited transmission range of 8-10 meters, which restricts its application in larger spaces. Zigbee, as applied in demonstrated a packet loss rate (PLR) exceeding 50% when transmitting through multiple concrete walls, with a maximum transmission distance of 64 meters in a library setting. LoRa, a long-range, low-power wireless technology, offers more robust performance. In a certain study LoRa’s coverage and transmission capabilities were examined in a 16-story building, demonstrating a packet delivery rate (PDR) of over 95%, even with multiple wall barriers on the same floor, and a communication distance of up to 30 meters. LoRa’s ability to transmit stably across five floors makes it a promising option for large, complex building systems. Besides LoRa, WiFi and 3G/4G networks are predominantly used for transmitting data from IAQ devices to local servers or cloud platforms.
TABLE 1. A summary of related literature on IAQMS.
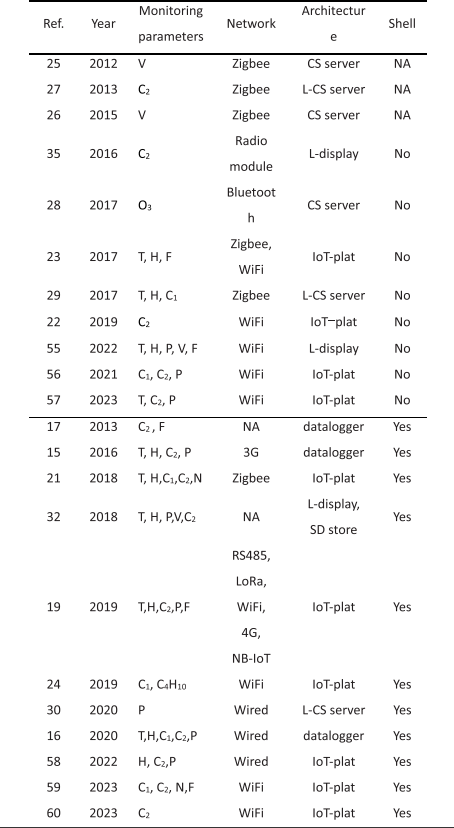
*T: temperature, H: humidity, C?: CO, C2: CO2, V: TVOC, F: formaldehyde, N: NOx, P: particulate matter; IoT-plat: IoT platform, L-CS: Local CS, L- display: Local display.
The system architecture of IAQMS plays a crucial role in determining the system’s flexibility and scalability. Early systems relied on dataloggers for data collection, requiring researchers to manually retrieve the data on-site. These devices displayed data in simple digital or graphical forms. Subsequently, client-server (CS) architectures were introduced, offering a visual interface but often requiring software downloads, limiting mobile device access. The advent of IoT platforms has further advanced system architecture, allowing for greater flexibility in accessing monitoring data via both computers and mobile devices. These platforms can easily integrate additional features, such as predictive algorithms for indoor air quality, enabling more comprehensive data utilization.
When it comes to enclosures, most IAQ devices discussed in the literature, such as those in certain studies do not include a protective shell. However, other studies do feature devices with an enclosure. Although there is no direct research on how the presence or absence of a shell affects air quality measurements, it is known that the microenvironment within the shell can alter after prolonged operation of the power and sensor modules, potentially impacting the readings. This effect will be explored further in the next section through experimental analysis of IAQ devices with and without a shell.
Existing IoT-based systems are often examined from the perspective of power consumption, RF design, and security. For instance, Yang et al. proposed using unmanned aerial vehicles (UAVs) as mobile power beacons to supply energy to IoT nodes, optimizing UAV transmission power and trajectory to maximize the system’s overall energy efficiency. Similarly, Liu et al. applied non-orthogonal multiple access (NOMA) technology to achieve energy-saving mobile edge computing (MEC) within IoT networks, addressing the challenge of balancing energy efficiency and data transmission delays. Gupta et al. reviewed the challenges related to RF designs in IoT systems and highlighted future research directions, particularly focusing on energy efficiency and latency. Zafari et al. explored the localization of users and devices in IoT systems, analyzing the advantages and limitations of existing systems in terms of energy consumption, scalability, and tracking accuracy . Tewari et al. investigated security challenges in IoT systems, comparing these with traditional networks and identifying open security issues that need further exploration.
Despite substantial progress in the field, several challenges remain. Firstly, many studies focus on monitoring only one or a few indoor air quality parameters, necessitating the use of multiple sensors to capture a broad range of data, which increases both costs and complexity. Secondly, many systems still require manual data collection, which is labor-intensive and fails to provide real-time monitoring. Finally, most research focuses on data collection feasibility without addressing the effects of different operational conditions or the influence of device design on measurement accuracy.
III. PROPOSED SYSTEM AND REQUIREMENTS
A. Hardware Design
This section presents the functional description of the project, wherein the entire system is subdivided into multiple functional blocks. A detailed explanation of each block is provided for clarity. Block and circuit diagrams will be discussed in the subsequent chapter. The project’s architecture integrates an Arduino microcontroller, various sensors such as DHT11 (temperature and humidity sensor), dust sensor, and gas sensors (MQ2, MQ7, MQ135), along with an LCD display and Wi-Fi module. The primary role of the microcontroller is to gather sensor data and assess air quality. Each block is elaborated upon as follows.
1) DHT11 (Temperature and Humidity Sensor)
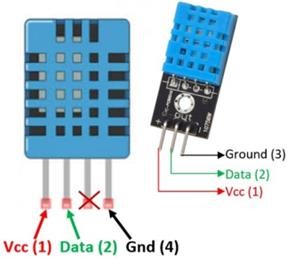
Fig.1 Pin diagram of DHT11
The DHT11 sensor is employed for real-time temperature and humidity monitoring, functioning via single-wire serial communication. Initially, the Arduino sends a start signal to the DHT module, which responds with temperature and humidity data. The Arduino processes this data, displaying it on a 16x2 LCD screen. The DHT11 sensor module integrates both humidity and temperature measurement functionalities, delivering a precise and reliable digital output. The sensor employs resistive humidity and NTC-type temperature measurement components, with an 8-bit microcontroller for high-precision, stable output. Detailed specifications of the DHT11 sensor will be provided in subsequent sections.
The communication process begins with the Arduino sending a start signal, followed by a response from the sensor. Data transmission occurs in a 40-bit format, split into humidity and temperature components. Proper pull-up resistor selection is crucial when positioning the DHT sensor over distances greater than 20 meters. For this project, the sensor is connected to the Arduino with a 5k pull-up resistor, and the LCD is connected in 4-bit mode.
2) MQ135 (Gas Sensor)
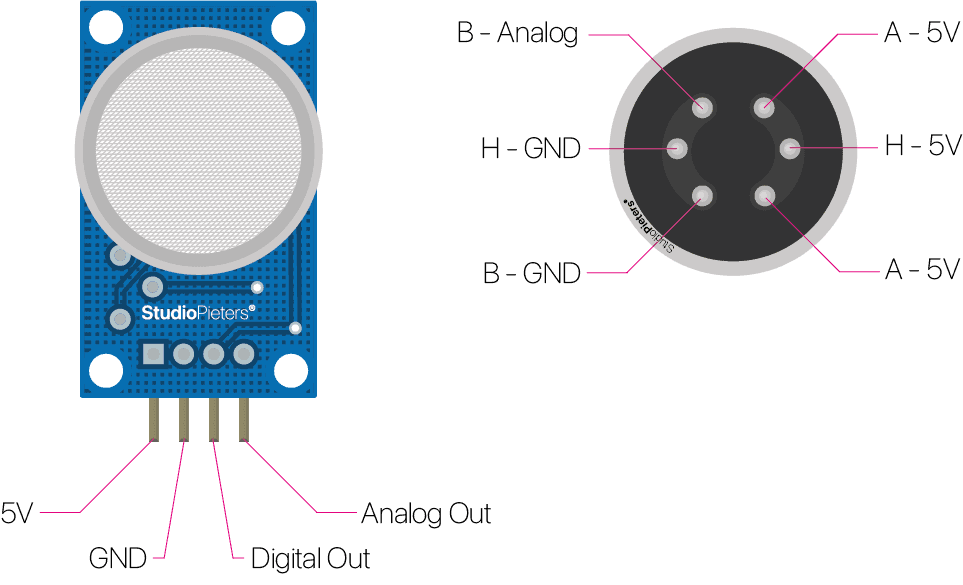
Fig.2 Pin diagram of MQ135
The MQ135 sensor is a crucial component for detecting and monitoring harmful gases such as ammonia, sulfur dioxide, and carbon monoxide. It is widely employed in air quality monitoring systems due to its high sensitivity and low power consumption. This sensor, based on metal oxide semiconductor (MOS) technology, provides both analog and digital outputs for a wide range of gases. Calibration of the sensor's sensitivity is possible through an adjustable potentiometer, allowing fine-tuning based on the specific environmental requirements.
With its wide detection scope, the MQ135 sensor is suitable for applications requiring continuous air quality assessment. Its specifications include a 5V operating voltage and preheating time of 20 seconds. The sensor's durability, long life, and cost-effectiveness make it a popular choice for gas detection in various settings.
3) MQ7 (Carbon Monoxide Sensor)
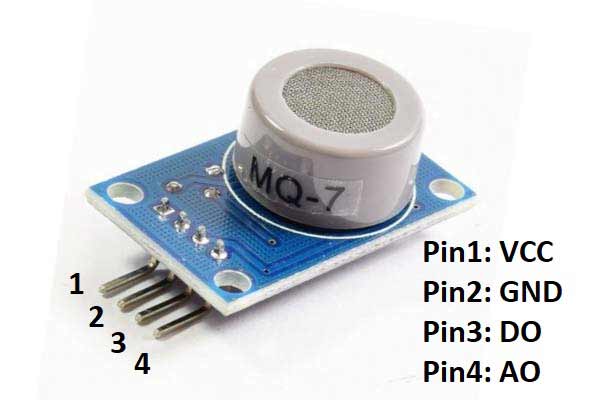
Fig.3 Pin diagram of MQ7
The MQ7 sensor is designed specifically to detect carbon monoxide (CO) concentrations ranging from 20 to 2000 parts per million (ppm). Its sensitive material, tin dioxide (SnO2), exhibits low conductivity in clean air but shows increased conductivity in the presence of CO, enabling precise detection. The sensor operates at both high and low temperatures to optimize its sensitivity to carbon monoxide while filtering out other gases.
The analog output of the MQ7 sensor can be easily interfaced with the Arduino, making it suitable for a variety of applications. Its fast response time and high sensitivity to CO ensure reliable operation in air quality monitoring systems, especially in scenarios where rapid detection of CO is essential.
4) MQ2 (Gas Sensor)
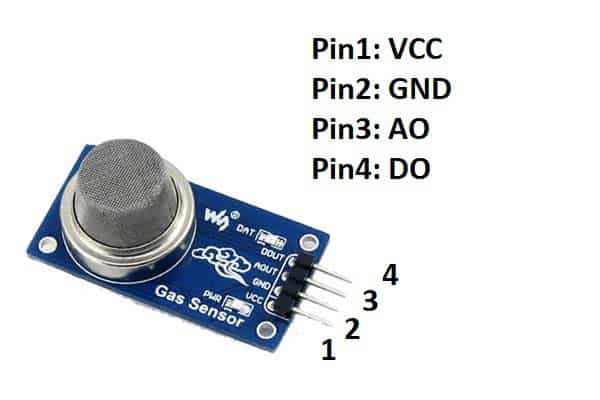
fig.4 Pin diagram of MQ2
The MQ2 sensor is a versatile gas sensor that detects multiple gases such as methane, propane, and butane. It operates using a small built-in heater combined with an electrochemical sensor, producing an analog output proportional to the concentration of gases in the environment. The sensor is sensitive to a wide range of gases and is typically used in gas leakage detection systems.
A notable feature of the MQ2 sensor is its low sensitivity to background "noise" gases, reducing the likelihood of false alarms. Its structural design, based on a sintered bulk semiconductor, ensures high reliability and a fast response time. Proper calibration of the sensor, based on the intended application and environment, is necessary to achieve optimal results.
5) Basic Measurement Circuit for MQ Sensors
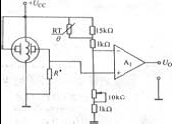
Fig.5 Basic Measurement Circuit diagram
The MQ sensors are typically used in conjunction with a simple measurement circuit that converts changes in sensor conductivity to a corresponding output signal. The sensitivity of the sensors to various gases can be adjusted through load resistors. Environmental factors such as temperature and humidity can influence sensor readings, and these effects must be accounted for during circuit design.
Initial stabilization time is required for the MQ sensors after extended storage, with maximum sensitivity achieved after a brief warm-up period. Over time, sensor sensitivity decreases slightly, but the overall lifespan of the sensors can exceed eight to ten years with proper maintenance and calibration.
6) GP2Y1014AU0F (Dust Sensor)
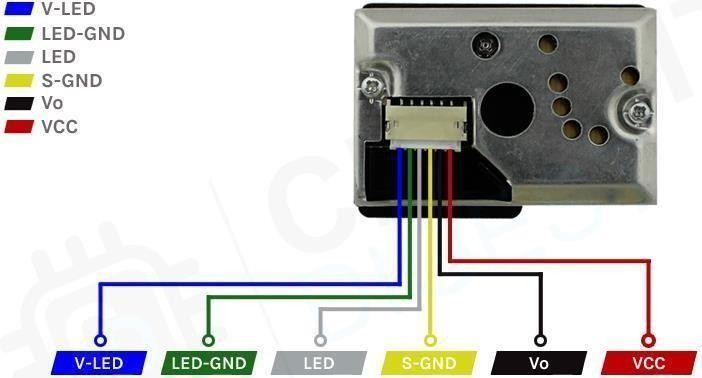
Fig.6 Dust sensor
Pins:
- V-LED: Connected to 5V via a 150? resistor.
- LED-GND: Connects to ground.
- LED: Controls LED on/off; connect to any digital pin of the Arduino.
- S-GND: Connect to ground.
- V out: Analog output connected to Arduino’s analog pin.
- VCC: Power pin (5V/3.3V).
Working:
The dust sensor utilizes an LED and photodiode pair for detecting particulate matter (PM). When dust or smoke particles pass through, the reflected light is captured by the photodiode, and the output is provided as an analog signal, proportional to PM concentration.
A 150? resistor and a 220uF capacitor are required to drive the LED pulse with a 10ms pulse width. Sampling should occur after 0.28ms of LED pulse.
B. LCD Interfacing
LCDs are essential for displaying alphanumeric data or special symbols.
Pin configuration
- D0-D7: 8-bit data bus lines connected to Arduino’s digital ports.
- (Register Select): Differentiates between data/command. RS=0 for command, RS=1 for data.
- R/W (Read/Write): R/W=0 for writing data to the LCD, connected to ground.
- Enable (E): Used for latching the information from data pins.
- VEE: Adjusts contrast.
- VSS/VCC: Provide +5V and ground, respectively.
LCD supports an 8-bit or 4-bit mode and must be triggered by a high-to-low pulse on the Enable pin.
C. Arduino Uno
- Microcontroller: ATmega328.
- Operating voltage: 5V with input voltage ranging from 7-12V.
- Digital I/O Pins: 14 (6 can be used for PWM).
- Analog Inputs: 6 analog input pins.
- Clock Speed: 16 MHz.
- Can be powered via USB or external supply (VIN, DC power jack).
- Supports communication protocols like UART (serial), I2C, SPI, and PWM output.
- The board can be programmed using Arduino IDE.???????
???????D. WiFi Module (ESP8266)
- Allows wireless communication over Wi-Fi.
- Pins required:
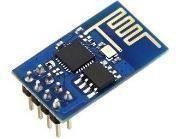
Fig.7 Wi-fi Module
- VCC (5V), GND, RX, TX (connected to Arduino for serial communication).
- It can be used to connect to a Wi-Fi network, either as a server or client.
- Protocol support: TCP, UDP, FTP.
- IP address can be assigned dynamically (DHCP) or statically.
???????E. ThingSpeak
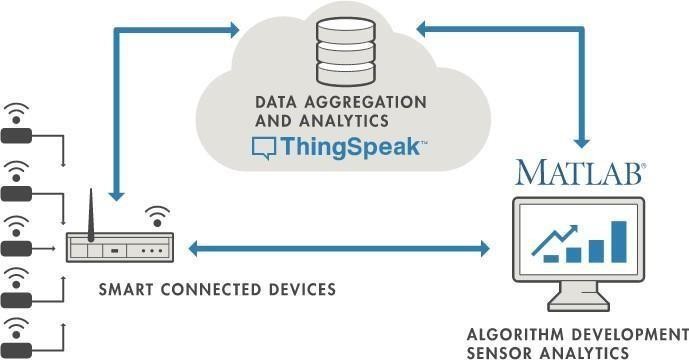
ThingSpeak is an open-source platform used for collecting, analyzing, and visualizing data from IoT devices. It's compatible with the ESP8266 module for transmitting sensor data to the cloud, making it useful for real-time monitoring applications like air quality assessment.
These components together allow you to develop a system capable of monitoring air quality by reading particulate matter (PM) levels from the dust sensor, displaying the data on an LCD, and sending it wirelessly to the cloud via the WiFi module.
IV. SYSTEM DESING AND ARCHITECTURE
This paper aims to design and implement an Arduino-based air quality monitoring system that can be installed in specific locations to assess air quality. The goal is to overcome the limitations of previously developed systems by introducing enhancements, such as real-time monitoring through an Android mobile application accessible to the public. The system leverages the capability of an Arduino microcontroller integrated with various sensors that can measure the concentration of different air pollutants and environmental factors such as carbon monoxide (CO), carbon dioxide (CO?), particulate matter (PM), humidity, temperature, and pressure. One of the core features of this project is its ability to provide precise measurements of multiple air quality indicators using individual sensors, each specifically designed to monitor a particular substance or condition in the atmosphere. For instance, sensors for CO and CO? measure the concentration of these gases, while a particulate matter sensor detects airborne particles that contribute to pollution. Other sensors are used to monitor environmental conditions such as humidity, temperature, and atmospheric pressure, all of which are key factors that can influence air quality.
The system operates using Internet of Things (IoT) technology, which connects the hardware components to the internet for real-time data transmission. By employing the principles of the OSI (Open Systems Interconnection) model, the IoT framework allows for seamless integration of smart devices with the server, enabling continuous and reliable communication between the sensors and the centralized data repository. This connection ensures that the system is capable of transmitting real-time data, allowing users to monitor air quality continuously through a mobile application.
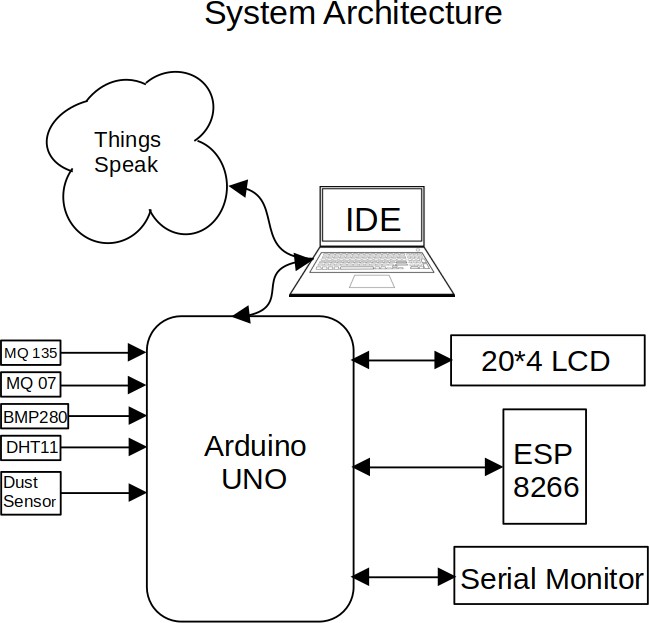
Fig.8 Pin diagram of System Architecture
These sensors are directly connected to the Arduino Uno microcontroller, which serves as the central processing unit. The Arduino is responsible for collecting data from each sensor and processing it for transmission. To enable wireless communication, the system uses the ESP8266 Wi-Fi module, which allows the Arduino to transmit real-time data to a remote server. This data is then stored and processed, enabling users to access it through the Android mobile application. The app provides a user-friendly interface where individuals can monitor the air quality in their locality and receive alerts in case pollutant levels exceed safe thresholds.
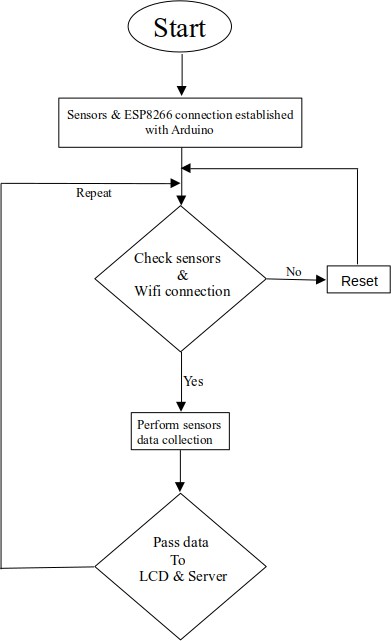
Fig.9. Flowchart for the system
The design of the system is based on a multi-layered architecture, with the sensors forming the data collection layer, the Arduino and ESP8266 comprising the data processing and communication layer, and the server and mobile application forming the data access and user interface layer. The system’s architecture, design, and operational flow are depicted in Figures 1, 2, and 3. These diagrams illustrate how the sensors are integrated with the Arduino, how data flows from the sensors to the server, and how the mobile app retrieves and displays the information to users in real time.
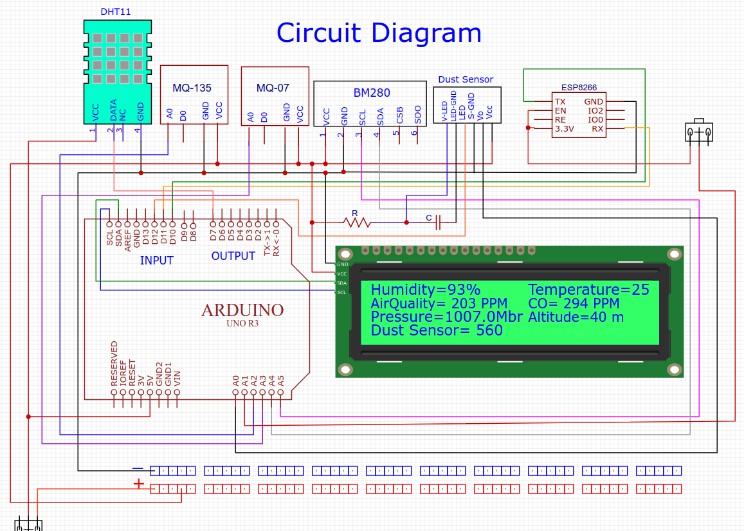
Fig.10 Circuit for the whole system
This proposed air quality monitoring system not only improves on previous models by adding additional sensors and real-time data access but also addresses the need for public accessibility through the Android application. With this system, users can easily stay informed about air quality levels in their vicinity and take necessary precautions if pollution levels rise.
V. RESULTS
The following graphs illustrate the concentrations of various gases in the air, which were analyzed and collected using the ThingSpeak cloud platform. The data was gathered from a typical indoor environment under normal conditions, providing insights into the air quality. These measurements reveal minimal detection of harmful gases, indicating a relatively low presence of pollutants in the sampled environment. The system utilized for data collection is capable of continuous monitoring and analysis, ensuring real-time updates. These results serve as a baseline for further studies in varying environmental conditions.
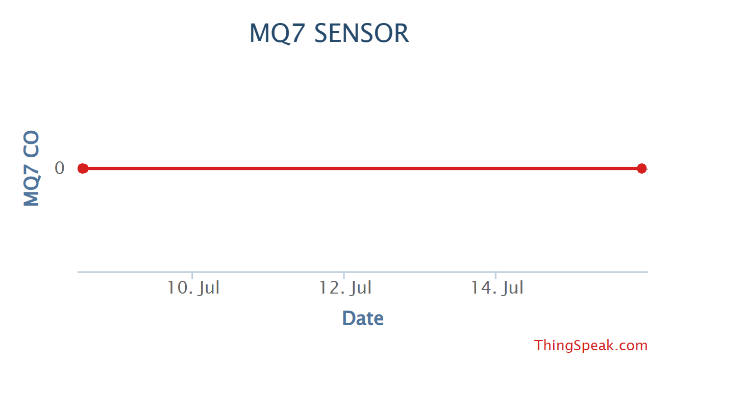
fig.11 Amount of Carbon monoxide detected
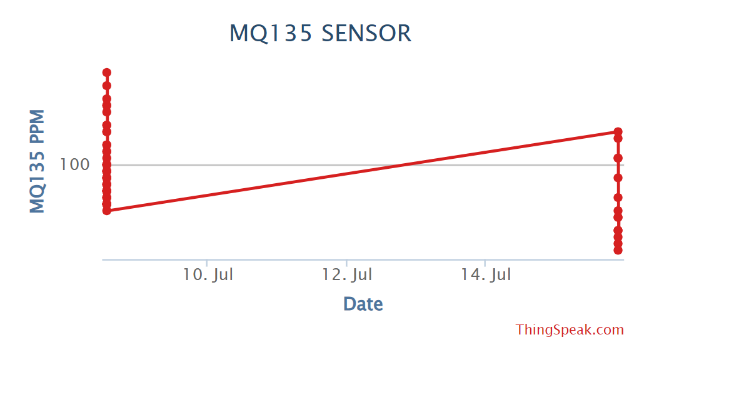
fig.12 Amount of Carbon dioxide detected
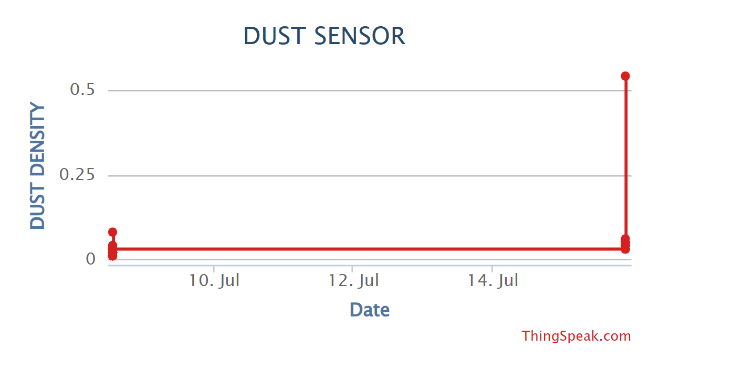
fig.13 Amount of Dust particles detected
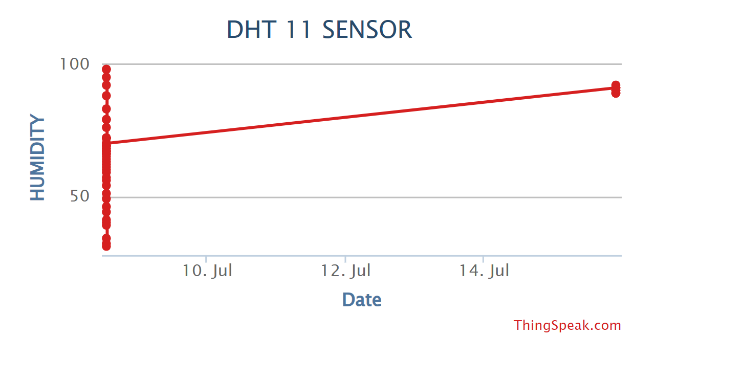
fig.14 Amount of Humidity detected
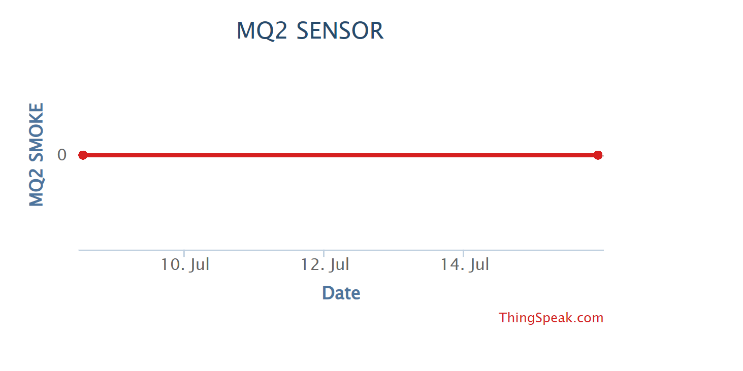
fig.15 Amount of Smoke detected
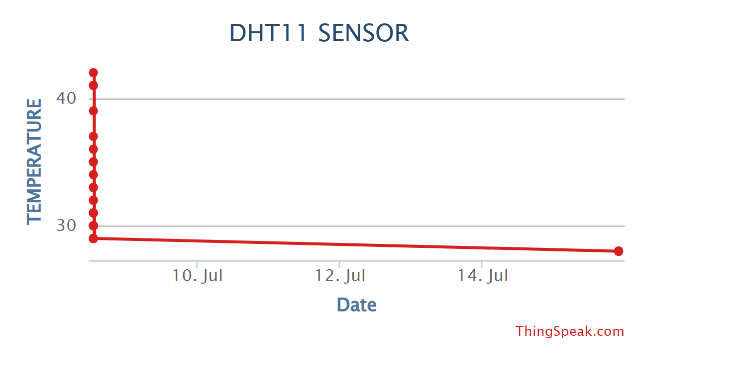 ???????
fig.16 Amount of temperature detected
Conclusion
This air quality monitoring system represents a significant advancement in the field of environmental health surveillance. It not only facilitates real-time data collection but also offers valuable predictive insights into pollution trends, allowing for proactive responses. By evolving into a more compact and versatile device, this system could be widely applicable across various environments, aiding in the global effort to improve air quality. Future enhancements, such as incorporating AI and further refining its predictive capabilities, hold the potential to greatly benefit both environmental management and public health. Continued research and development will ensure that this technology becomes an indispensable tool in the fight against air pollution, ultimately contributing to a healthier planet and a sustainable ecosystem
References
[1] WHO. 2018. How Air Pollution is Destroying Our Health. [Online]. [2] B. Ostro, J. V. Spadaro, S. Gumy, P. Mudu, Y. Awe, F. Forastiere, and A. Peters, ‘‘Assessing the recent estimates of the global burden of disease for ambient air pollution: Methodological changes and implications for low- and middle-income countries,’’ Environ. Res., vol. 166, pp. 713–725, Oct. 2018. [3] WHO. 2018. Ambient (Outdoor) Air Pollution. [Online]. [4] N. E. Klepeis, W. C. Nelson, W. R. Ott, J. P. Robinson, A. M. Tsang, P. Switzer, J. V. Behar, S. C. Hern, and W. H. Engelmann, ‘‘The national human activity pattern survey (NHAPS): A resource for assessing exposure to environmental pollutants,’’ J. Exposure Sci. Environ. Epidemiol., vol. 11, no. 3, pp. 231–252, Jul. 2001 [5] S. C. Lee, S. Lam, and H. Kin Fai, ‘‘Characterization of VOCs, ozone, and PM10 emissions from office equipment in an environmental chamber,’’ Building Environ., vol. 36, no. 7, pp. 837–842, Aug. 2001. [6] J. M. Seguel, R. Merrill, and D. Seguel, ‘‘Indoor air quality,’’ Amer. J. Lifestyle Med., vol. 11, no. 4, pp. 284–2895, Jun. 2016. [7] L. Yang, W. Li, M. Ghandehari, and G. Fortino, ‘‘People-centric cognitive Internet of Things for the quantitative analysis of environmental exposure,’’ IEEE Internet Things J., vol. 5, no. 4, pp. 2353–2366, Aug. 2018. [8] L. Lei, W. Chen, Y. Xue, and W. Liu, ‘‘A comprehensive evaluation method for indoor air quality of buildings based on rough sets and a wavelet neural network,’’ Building Environ., vol. 162, Sep. 2019, Art. no. 106296. [9] J. Saini, M. Dutta, and G. Marques, ‘‘A comprehensive review on indoor air quality monitoring systems for enhanced public health,’’ Sustain. Environ. Res., vol. 30, no. 1, Jan. 2020. [10] S.-O. Baek, Y.-S. Kim, and R. Perry, ‘‘Indoor air quality in homes, offices and restaurants in Korean urban areas—Indoor/outdoor relationships,’’ Atmos. Environ., vol. 31, no. 4, pp. 529–544, Feb. 1997.
Copyright
Copyright © 2024 P Sree Sudha , Durgalla Shravya Sri, Gadivemula Ragha Vaishnavi, Kunta Nikhitha Reddy, Malladi Mahathi. This is an open access article distributed under the Creative Commons Attribution License, which permits unrestricted use, distribution, and reproduction in any medium, provided the original work is properly cited.

Download Paper
Paper Id : IJRASET64704
Publish Date : 2024-10-20
ISSN : 2321-9653
Publisher Name : IJRASET
DOI Link : Click Here
 Submit Paper Online

