Ijraset Journal For Research in Applied Science and Engineering Technology
- Home / Ijraset
- On This Page
- Abstract
- Introduction
- Conclusion
- References
- Copyright
Integrating Twitter Sentiment with ML Models for Enhanced Stock Forecasting
Authors: Divyansh Koolwal, Shrey Bajiya, Radhika Dadhich
DOI Link: https://doi.org/10.22214/ijraset.2024.64561
Certificate: View Certificate
Abstract
This research investigates the integration of Twitter sentiment analysis with machine learning models, specifically Long Short-Term Memory (LSTM), Facebook Prophet, and Neural Prophet, to enhance the accuracy of stock market predictions. While these models are accurate in capturing long-term trends and seasonality, they often fail when exploring the short-term volatility in stock prices. By using real-time social media sentiments, we aim to improve short-term prediction accuracy. Sentiment data from Twitter, extracted and classified using NLP techniques, was integrated with the models to predict stock prices for Apple Inc. (AAPL), Paramount Global (PARA), and BP plc (BP) over the period 2016-2024. The study compares the performance of the models using Root Mean Squared Error (RMSE) and Mean Absolute Error (MAE). Results show that Neural Prophet stood the best in terms of its accuracy and efficiency in stock predictions when compared to LSTM and Facebook Prophet, reducing RMSE by 25% and MAE by 20%. While the integration of sentiment analysis improved prediction accuracy, limitations remain in predicting the scale of sudden market changes. The findings highlight the potential of sentiment analysis in stock prediction but also call for further model enhancements to fully address short-term market volatility.
Introduction
I. INTRODUCTION
A. Background Information
In the realm of stock market prediction, various machine learning models such as Long Short-Term Memory (LSTM), NeuralProphet, and Facebook's Prophet have shown promise. LSTM, a form of recurrent neural network (RNN), has gained popularity because of its capacity to capture long-term dependencies, whilst NeuralProphet and Prophet have shown competency in handling time series with seasonality and trend-based components.
B. Worthiness of Research
Despite their individual merits, these models exhibit a common limitation: they struggle to capture short-term fluctuations inherent in the highly volatile stock market, often leading to suboptimal performance in short-term predictions. Studies by scholars such as [Zhang et al., 2021][1] and [Boruah et al., 2022][2] repeatedly emphasise this disparity. Many improvements have been made to these models over time, such as including external elements like trading volumes and news events, but their usefulness in terms of short-term forecast accuracy remains a difficulty. While previous research has focused on measuring the accuracy of these models, we wanted to investigate how adding sentimental analysis to complement each of these models can improve their accuracy, particularly in the short term, generating new knowledge in the field of financial markets and machine learning.
C. AIM
Given the real-time nature of social media, sentiments expressed on platforms like Twitter (X) serve as a critical indicator of how a stock may perform in the short run. Social media sentiment provides immediate insight into public attitudes toward a company's decisions, news affecting the company, and sudden political, economic, or societal shifts, which are often reflected in social media conversations before they appear in traditional market data. These sentiments, which are valuable but underutilised, might have a substantial impact on stock performance in forthcoming trading sessions. As a result, the purpose of this study is to combine Twitter (X) sentiment analysis with LSTM, NeuralProphet, and Facebook Prophet models, and then compare their accuracy. Top of FormBottom of Form
II. METHODOLOGY
We first developed a Twitter sentiment analysis model using a conventional approach that involves extracting relevant tweets for specific stock tickers and applying Natural Language Processing (NLP) techniques to classify the sentiments into positive, negative, or neutral. For this, we used Python libraries such as Tweepy for data extraction and TextBlob and VADER for sentiment analysis. The sentiment scores were then quantified to integrate them as external features into our prediction models. To ensure a robust model, we sought mentorship from PhD professors and experts at our institution, refining the integration process with their guidance.
For our study, we examined stock data from Apple Inc. (AAPL), Paramount Global (PARA), and BP plc (BP) accessible from Yahoo Finance, encompassing the period January 2016 through July 2024. These firms were chosen to represent a wide range of industries, such as technology, entertainment, and energy. We assessed the accuracy of each prediction model using both visual and quantitative analysis. For visual inspection, we developed graphs to examine the predicted patterns. Quantitative analysis was conducted using the Root Mean Squared Error (RMSE) and Mean Absolute Error (MAE) formulas:
- RMSE
RMSE=1ni=1n?yi-yi2
Where yi are the observed values, yi
 are the predicted values, and n is the number of observations.
- MAE
MAE=1ni=1n?yi-yi
Where yi are the observed values, yi
 ? are the predicted values, and n is the number of observations.
We integrated these formulas into our code, using Python libraries such as Keras for LSTM, neuralprophet for NeuralProphet, and fbprophet for Prophet. The models were developed in Jupyter notebooks with GPU support for faster computation.
III. CURRENT STOCK PRICE ANALYSIS
A. AAPL(Apple)
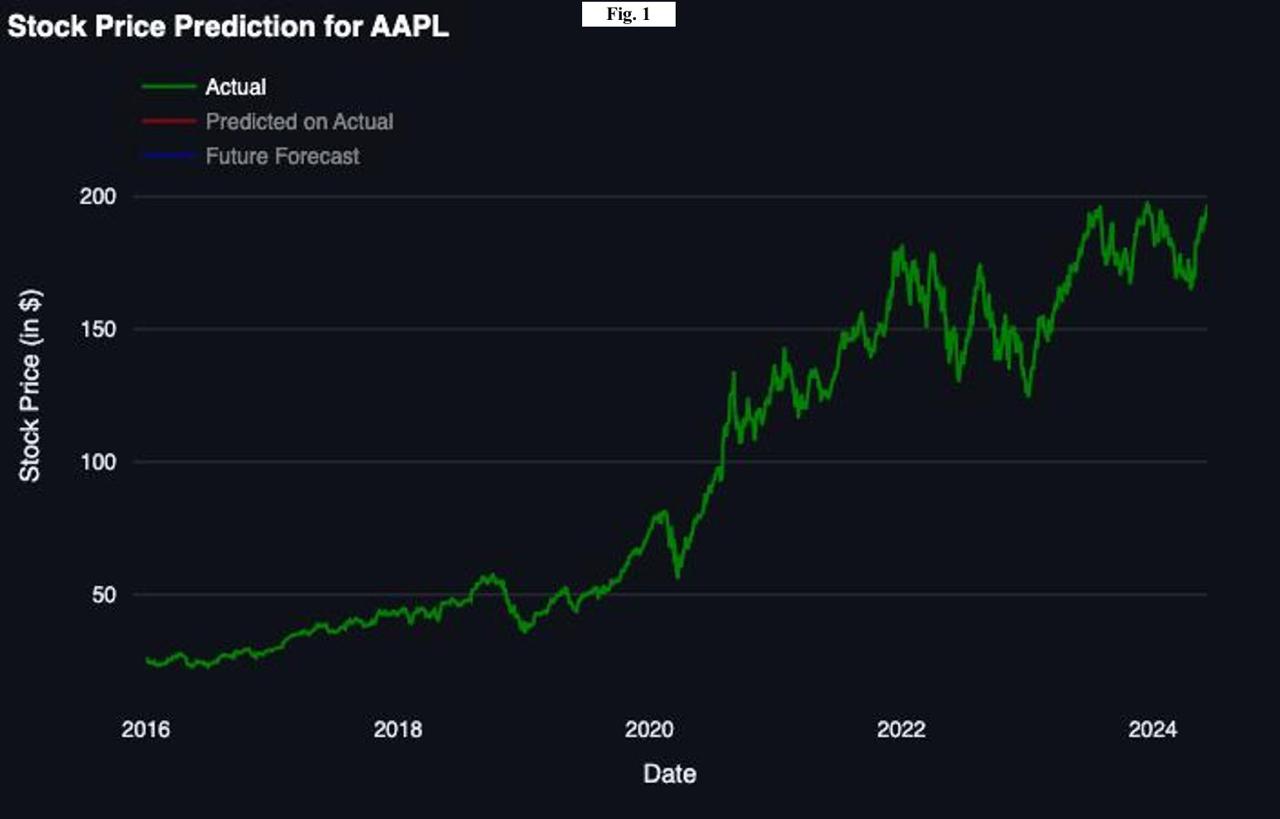 Figure 1
Figure 1 represents the price of Apple Inc. also referred to as AAPL from 2016 to mid-2024. The overall trend of the stock price can be said to be upwards, with occasional fluctuations. From 2016 to 2019, the stock price grew steadily which can be attributed to product launches, excellent earning reports or macroeconomic factors.
Entering 2020, the stock price experiences increased significantly when compared to the earlier years. This was likely an effect of the COVID-19 pandemic. Despite an initial dip in early 2020, the stock quickly recovered from it and accelerated sharply as demand for electronics grew significantly during the pandemic. This period also saw an unexpected rise in investor participation, fuelled by stimulus checks and low interest rates, which contributed to the rapid increase in stock prices.
From late 2020 to 2022, the stock price continued its upward trajectory but with more fluctuations. These fluctuations could be linked to broader market conditions, supply chain challenges, inflation concerns, and the overall economic recovery post-pandemic. The price changes during this period also reflect investor reactions to Apple's quarterly earnings, product announcements, and strategic shifts, such as advancements in AI, increased focus on services, and possible new product lines.
From 2022 onwards, the graph has shown stabilization and slight increases. This period likely shows the mature phase of growth where Apple has established itself in the market where its new innovations will continue to affect the stock value.
B. BP (British Petroleum)
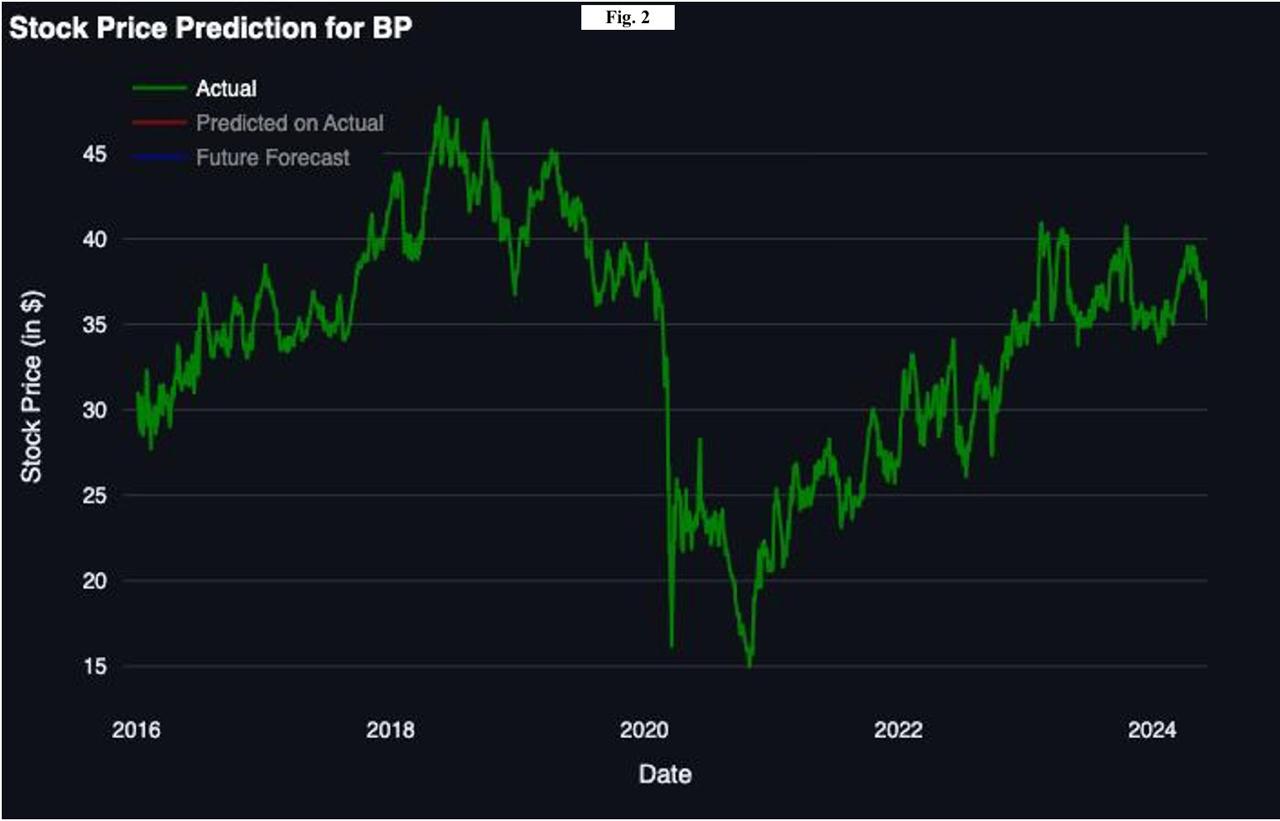 Figure 2
Figure 2 represents the stock price of British Petroleum, also referred to as BP, from 2016 to mid-2024. The stock experienced fluctuations from 2019 to early 2020, where the stock price varied within the range of $15 to $45. This reflects the volatile nature of the oil prices, which in turn affects the stock price of oil companies.
As the pandemic hit in 2020, economies across the globe crashed, leading to a steep decline in oil prices which caused BP’s stock price to an all-time low of $15. Post-COVID, the stock prices recovered as the global economy gradually started reopening, hence increasing the oil demand. Moreover, the increase in stock prices can also be partly attributed to its increased focus on renewable energy which likely attracted heavy investments.
C. PARA(Paramount)
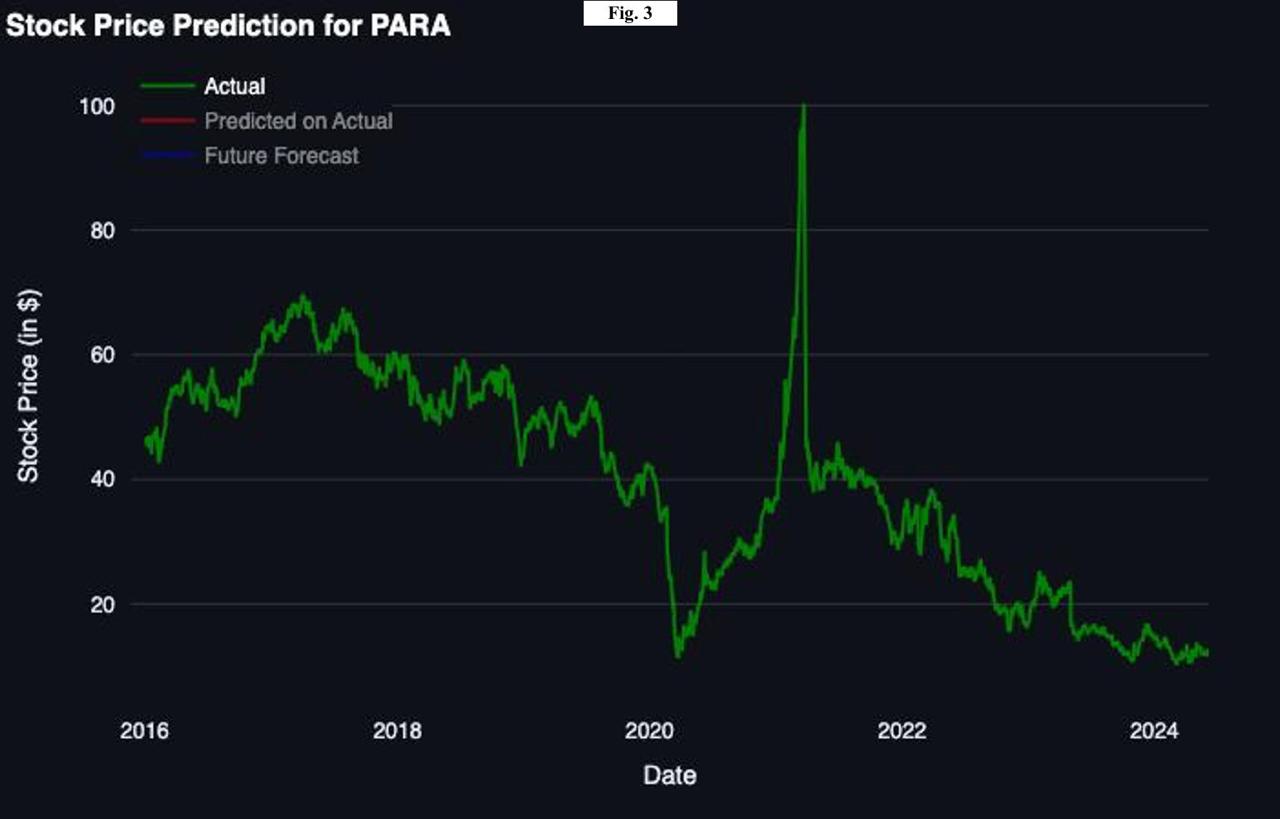 Figure 3
Figure 3 shows the historical trend line for the stock price of Paramount Global (PARA) from 2016 to mid-2024. The price has been stable for some periods such as 2016-2019, but it has also fluctuated dramatically like in the year 2021.
The fluctuations in price levels over time reflect the dynamic nature of the media and entertainment industry. The prices were constantly growing from 2016 to mid-2017 ranging from $40 to $60. The increase in the prices was a signal of increasing viewership trends towards online content and shifts in content production. Then, in the beginning of the year 2018, the company’s stock prices faced a slow descent with minor fluctuations. The rapid increase in the stock price in early 2021 where the maximum price reached $100 can be the reason for speculation in the trading activities, mainly by retail investors. Adding to it, the reason for the rapid increase could also be the ‘meme stock’ phenomenon which is a condition of rapid increase in the stock prices due to short-term influences from social media platforms. It can also be referred to as a ‘hype’.
As a result of the short-term hype, after it was over, the stock price experienced a steep decline to nearly $40 before the start of 2022. This price drop had a positive correlation with social media’s creation of the speculative bubble. The post-peak period for Paramount revealed the challenges within the media industry like low cable subscriptions, increasing competition for streaming services and the decline in advertising revenue. From 2022 to 2024, Paramount has been facing a constant decline in the stock price, ranging from $25 to less than $10. Overall, the graph shows the fluctuations and the uncertainty in Paramount's stock price which can be said to be influenced by market speculations and industry changes. The challenges faced by media companies to adapt to the digital shift of content can be clearly seen through the struggles of Paramount.
IV. INTRODUCTION TO LSTM
The Long Short-Term Memory model (LSTM) is an alternative to Recurrent Neural Networks (RNNs) which was made to abolish the existing limitation of analysing long-term dependencies in sequential data. Moreover, another major problem with RNNs was their capability to identify and use important information over a long period which often led to the “vanishing gradient” problem during the training phase. LSTM on the other hand was capable of maintaining information over long periods effectively, through its unique architecture which consists of memory cells and gating mechanisms. Hence, it solved the “vanishing gradient” problem.
σ(x)=11+e-x (1)
(1)
tanh (x)=ex-e-xex+e-x (2)
(2)
The Eq.1 represents how the gate allows information to pass selectively. The equation is referred to as a sigmoid function. The decision-making for the flow of information consists of a sigmoid neural network layer and a pair of mathematical information. The response from the sigmoid layer of the model is a real number which lies between 0 and 1 which represents the weight through which the corresponding information passes. Furthermore, the LSTM neural network also consists of a tanh activation function containing layers which are used to update the state of neurons, as illustrated by Eq. 2
ft=σ(Wf⋅[ht-1,xt]+bf (3)
(3)
The forgetting gate of the LSTM neural network determines the information needed to be discarded, which reads ht-1 and xt
 , returns the neuron state Ct-1
 a value between 0 and 1. Forgetting probability calculation is represented by Eq. 3
In Eq. 3, ht-1 represents the output of the previous neuron and xt
 is the input of the current neuron. The sigmoid function is represented by σ
 .
.
The input gate is responsible for deciding the amount of new information which is added to the neuron state. First, the input layer which contains the sigmoid activation function determines which information needs to be added. Then, the tanh layer generates vectors ct (an update which is made to the state of the neuron) as shown by Eq. 4
Ct=ft⋅(Ct-1+it )⋅ct (4)
(4)
Where the calculation methods of it and ct
 are shown in Eq. 5 and Eq. 6
it=σWi⋅[ht-1 , xt]+bi (5)
(5)
ct=tanh (Wc⋅[ht-1 , xt]+bc ]) (6)
(6)
The output gate controls the number of current neutral unit state and the number of controlling units which are filtered, shown in Eqs. 7 and 8
ot=σ(Wo⋅ht-1 , xt+bo)  (7)
(7)
ht=Ot⋅tanh(ct) (8)
(8)
B. Application of LSTM in Stock Prediction
In the context of stock prediction, LSTM models take advantage of their unique ability to capture temporal dependencies and patterns in sequential data, making them well-suited for financial time series forecasting. Specifically, the LSTM model processes historical stock price data such as from the S&P 500 index, by sequentially feeding in daily transaction data. Moreover, by constantly updating the state of cells, LSTM can learn complex patterns and trends within the stock market data. During training, the model learns to recognize and predict the impact of various factors which include past prices and trading volumes on future stock prices. When the LSTM model is applied to stock prediction, it forecasts while simultaneously considering the long-term dependencies and short-term fluctuations in the data. This approach ensures that the model uses longer-term economic cycles and considers irregularity with recent market trends. However, it accuracy in short-term still tends to fall behind, because of the unpredictable nature of market conditions and their volatility. The integration of Twitter sentiment analysis solves this to a certain extent.
B. Application of LSTM In Stock Prediction
1) AAPL
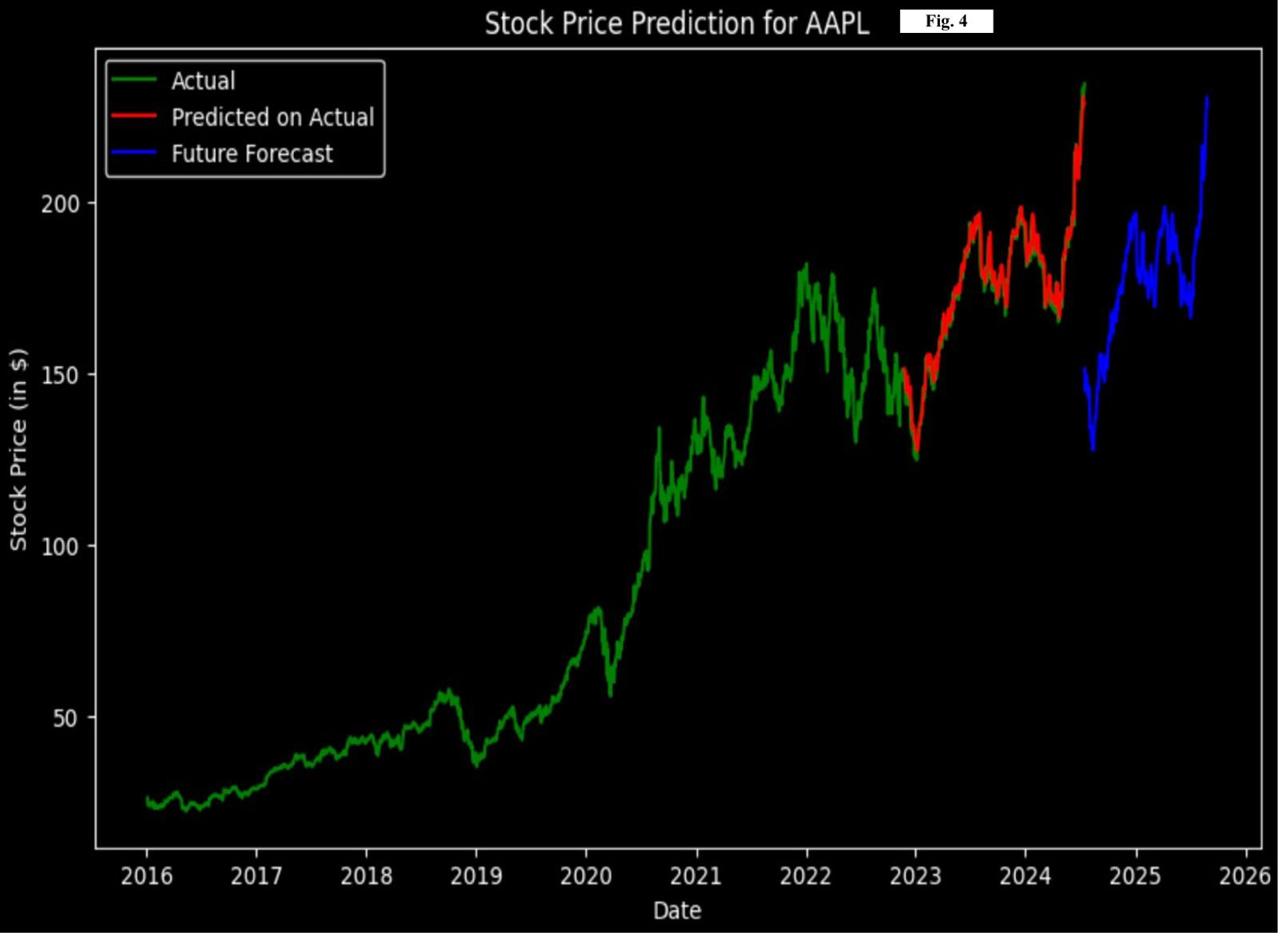 Figure 4
The relatively low RMSE value of 4.3 suggests that the model effectively minimizes the error magnitude, capturing the general trend of Apple's stock prices with a high degree of accuracy. The RMSE's sensitivity to larger errors implies that the model performs well not only in following the overall trend but also in reducing significant deviations.
The MAE value of 4.61 indicates that the model's predictions are, on average, about 4.61 dollars away from the actual stock prices. While this value is slightly higher than the RMSE, it still reflects a relatively accurate prediction capability, with the model maintaining a consistent error margin. Analysing the graph, we see that the predicted values (red line) closely follow the actual stock prices (green line). However, the blue line which predicts future prices is extremely inaccurate. It starts from the wrong point itself, showcasing a limitation in the model. While the MAE and RMSE are extremely good, that is because they are only calculated on the basis of the green and red lines, not for the blue line. This conveys that the model is efficient and effective in capturing big sets of data of previous year stock prices and trends but not in predicting future predictions.
In conclusion, the LSTM model integrated with sentimental analysis, demonstrates strong predictive accuracy for Apple stock prices, as depicted by the low RMSE and moderate MAE. However, to enhance its long-term forecasting and reduce larger errors, further improvements to its ability to make future predictions and possibly the usage of additional data features or advanced modelling methods are essential.
2) PARA
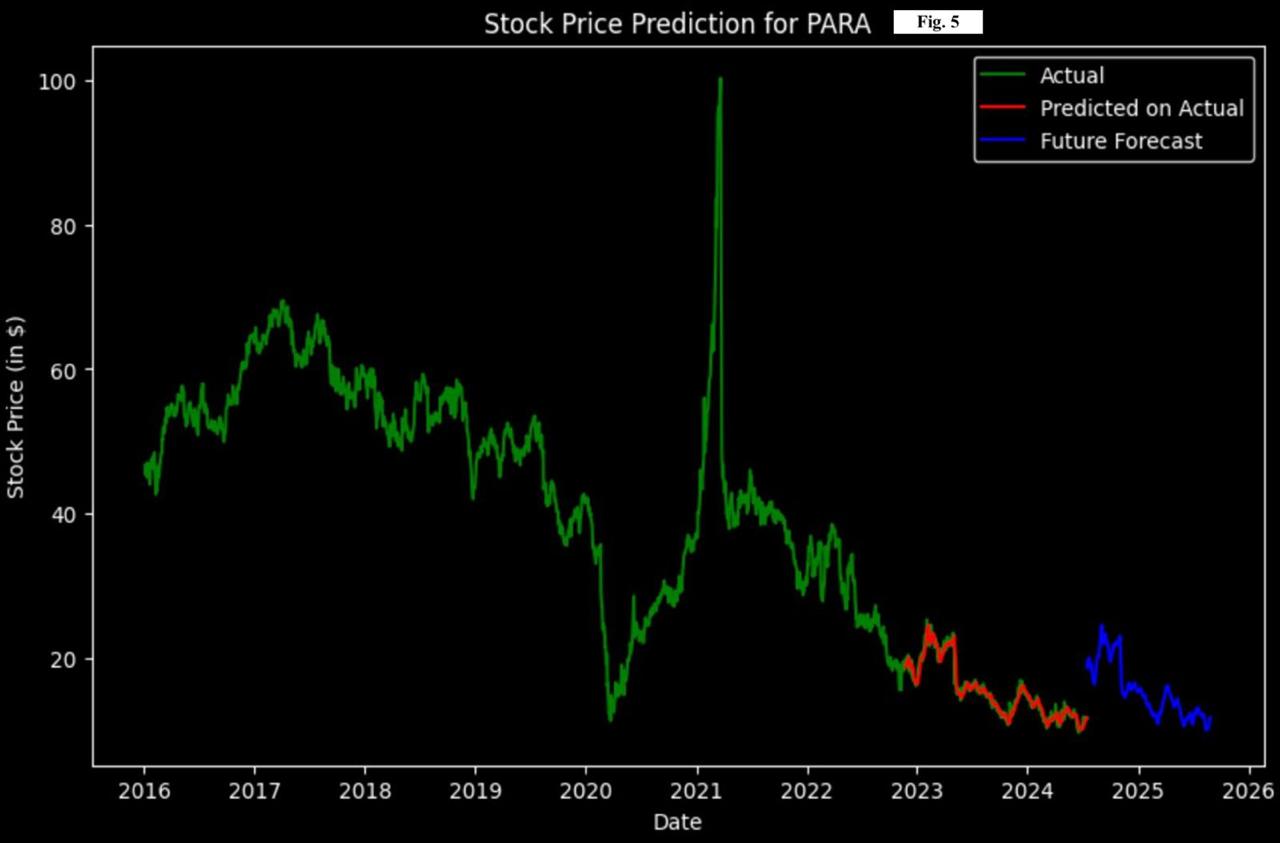 Figure 5
The RMSE value of 6.36 indicates that the predictions, on average, deviate from the actual prices by approximately $6.36. This relatively higher RMSE indicates the presence of large errors in the model's predictions, particularly given the fluctuating nature of PARA's stock prices. The RMSE is sensitive to larger errors due to its squared component, which amplifies the impact of substantial deviations.
This metric reflects that while the model can capture the overall trend, it struggles with larger fluctuations in the stock price. The MAE value of 3.98, on the other hand, signifies that the average absolute error between the predicted and actual values is around 3.98 dollars. The MAE provides a more straightforward interpretation of the average error magnitude without emphasizing larger errors disproportionately. This indicates that while the model’s predictions are generally within a 4-dollar range of the actual values, consistent deviations still exist, implying that the sentimental analysis has integrated and benefitted the model well.
The future forecast (blue line) suggests that the model projects continued downward trends, albeit with some oscillations. The presence of notable spikes and drops in the actual stock prices, particularly around 2021, challenges the model's ability to accurately capture such rapid movements, contributing to the higher RMSE.
3) BP
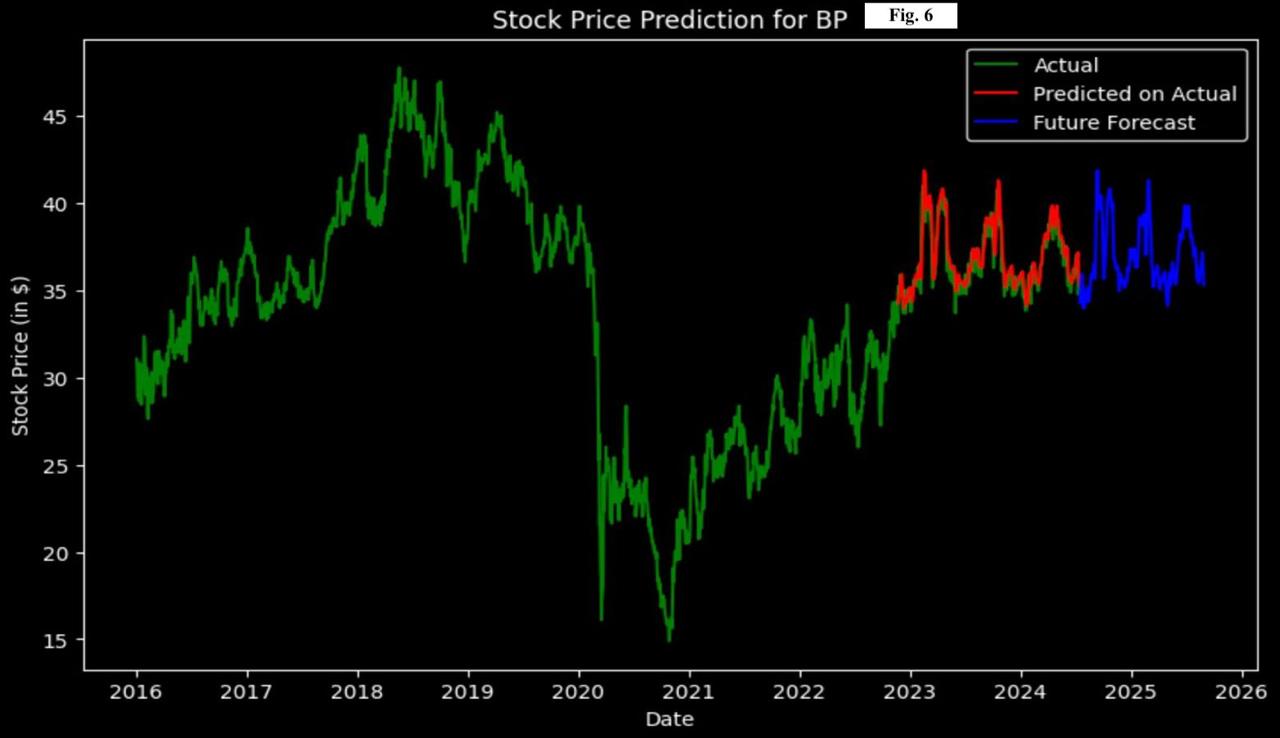 Figure 6
The RMSE value of 5.3 indicates that, on average, the predicted stock prices deviate from the actual prices by approximately $5.3. This value suggests that while the model captures the general trend of BP’s stock prices, it struggles with some significant deviations, particularly in periods of higher volatility. However, comparing it with the usage of LSTM without sentimental analysis, we see even bigger discrepancies. Hence, the sentimental analysis has benefitted the model.
The MAE value of 4.02, representing the average absolute error between the predicted and actual values, suggests that the model’s predictions are, on average, about 4.02 dollars away from the actual stock prices. While this value is lower than the RMSE, it still shows a significant margin of error, revealing the inaccuracies of the model.
The graphical analysis reveals the model’s capability in tracking the general trend of BP’s stock prices but also highlights areas where the prediction is not accurate. The relatively higher RMSE and MAE values suggest that the model needs further improvement to better handle sudden market changes and reduce error margins.
In conclusion, the LSTM model showcases the ability to predict BP stock prices, as reflected in RMSE and MAE. However, the analysis shows significant disparities and prediction inaccuracies, especially during non-consistent periods. To improve its forecasting capabilities, further enhancements in the model, such as using additional data features or incorporating advanced modelling techniques, are necessary. This analysis indicates that while the model is useful for studying general trends, improvements are necessary in order to gain short-term insights accurately.
V. INTRODUCTION TO FACEBOOK PROPHET
Facebook Prophet was developed by Taylor and Letham while working at Facebook. Facebook Prophet uses a time-series data framework which fits predictive and existing linear and non-linear models into seasonal, weekly, and daily periods, also adjusting for holiday effects.[3] This allows the model to divide previous trends into piecewise trend lines instead of processing the data in a linear manner. This allows the model to maintain a high level of precision and accuracy. Moreover, the model can fill in missing data points, non-predictive shifts in historical trends and outliers when calculating future stock prices.
Facebook Prophet uses a combination of 3 components to predict future stock prices. This includes historical trends, seasonal patterns and holiday effects. As a result, it is able to evaluate historical performance of a stock which is adjusted for sudden periods of change which makes the future predictions more accurate and error-free as it includes the possibility of non-expected changes in the stock price. It uses a generalized additive model (GAM) to create a flexible combination of these factors which best suits the scenario.
Yt = A(t)+s(t)+h(t)+εt,
y t = g(t)+s(t)+h(t)+εn
Where:
- A(t): linear trend
- s(t): seasonal patterns
- h(t): holiday effects
- εn: white noise error
A. Prediction Algorithm
1) Historical Trends
The first layer of the Facebook Prophet prediction model includes using previous years’ trend lines to form a time series that the model can understand and develop an algorithm on. Moreover, it can use the inflection point (knots) of the graph to analyse and predict non-linear trend lines, especially in the case of stock market prediction where trend lines extreme fluctuations in a non-linear manner.
2) Seasonal Patterns
The second layer of the Facebook Prophet prediction procedure includes the usage of historic seasonal patterns which trigger fluctuations in the stock price. Moreover, it also provides users with the functionality to adjust how much this factor affects the prediction.
These patterns can be daily, weekly, monthly or yearly depending on data frequency. This is done through the use of seasonality modes - additive or multiplicative. This allows the model to provide accurate results within the context of the special characteristics of the seasonal data.
3) Holiday Adjustment
The third layer of the prediction procedure adjusts the prediction on the basis of holidays, festivals, etc. It’s a general trend for companies operating in the consumer staples and consumer discretionary sector to experience a surge in demand during these periods.
This positively affects the stock price, leading to a surge which in turn affects the time-series data, thus impacting the predictions made by the model.
Hence, considering this factor in its prediction process, FB Prophet can factor in these unusual fluctuations around certain time periods and minimize its impact on future predictions. As many holidays are not fixed to a certain date, it accounts for the fluctuations here and considers it in the broader category of seasonal patterns.
B. Future Predictions By Facebook Prophet
1) AAPL
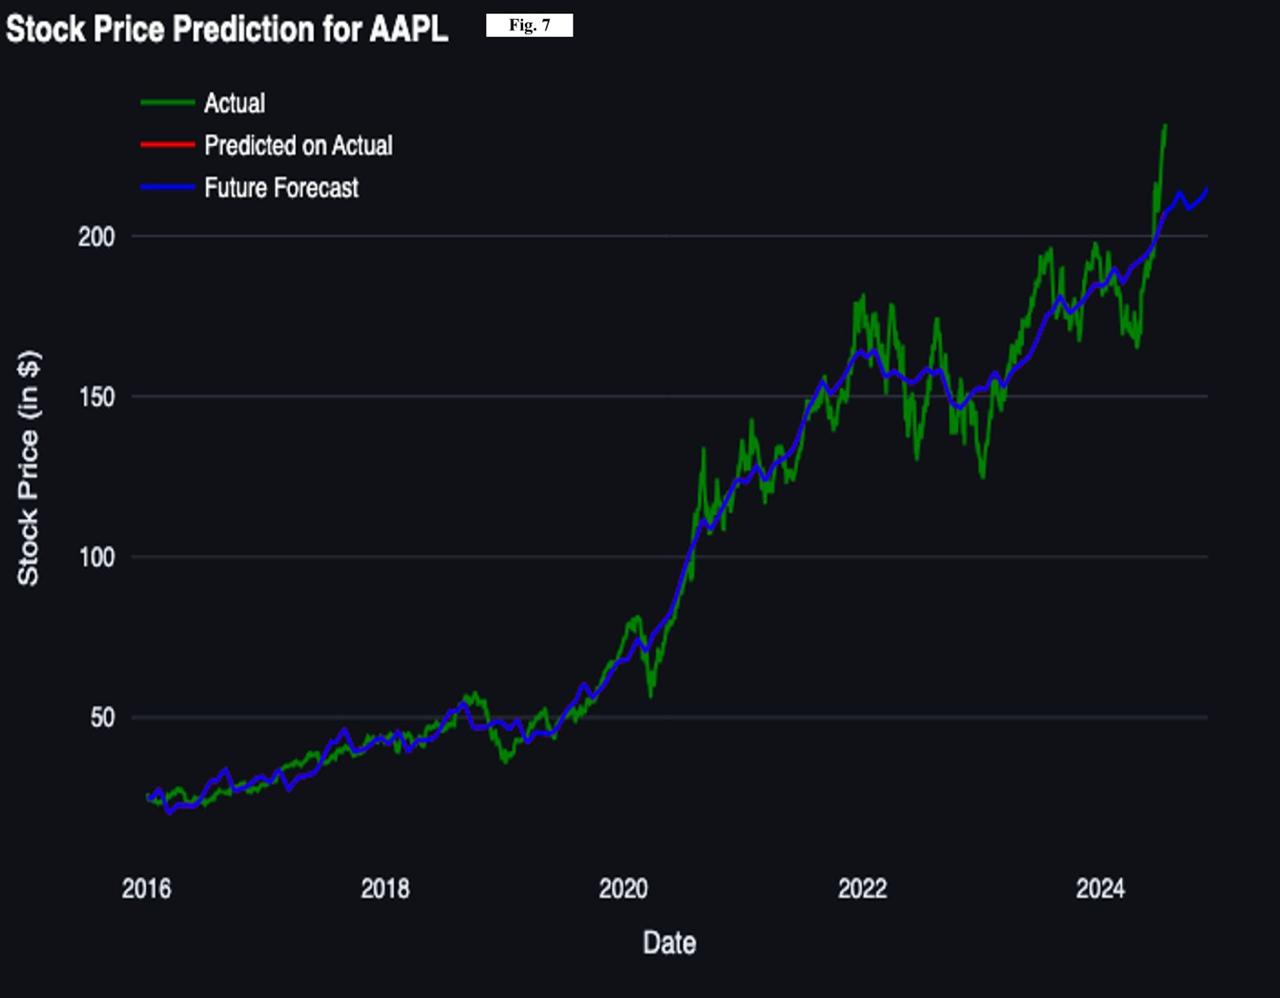 Figure 7
The stock price prediction for AAPL using Facebook Prophet integrated with Twitter sentimental analysis is visualized in the above graph. The green line represents the actual stock prices, the red line indicates the predicted values on the actual data, and the blue line shows the future forecast.
The RMSE value of 8.31 suggests that, on average, the predicted values deviate from the actual values by approximately $8.31. This measure gives more weightage to larger errors, making it highly sensitive to outliers.
The MAE value of 6.61 indicates that the average value of the errors is $6.61. Hence the uncertainty in the value is ±6.61. Unlike RMSE, MAE provides a linear measure of average error, offering a better understanding of prediction accuracy.
The model closely follows the actual stock prices, with minor errors in between. The residual analysis shows that the residuals are randomly distributed in the graph, and the ACF analysis reveals no significant autocorrelation, suggesting that the model fits well for the analysis of AAPL stock price. The error distribution is almost constant throughout the values, with no significant dissymmetry observed. However, the RMSE value is significantly higher for Facebook Prophet compared to the LSTM model. This hints that the integration of sentimental analysis with LSTM was better in predicting trends compared to the integration of Facebook Prophet with sentimental analysis, where it is only accurate in predicting the long-term trend (as visible in the above graph as well).
Overall, Facebook Prophet demonstrates an mediocre performance in predicting AAPL stock prices, as proved by its high RMSE and MAE values.
2) BP
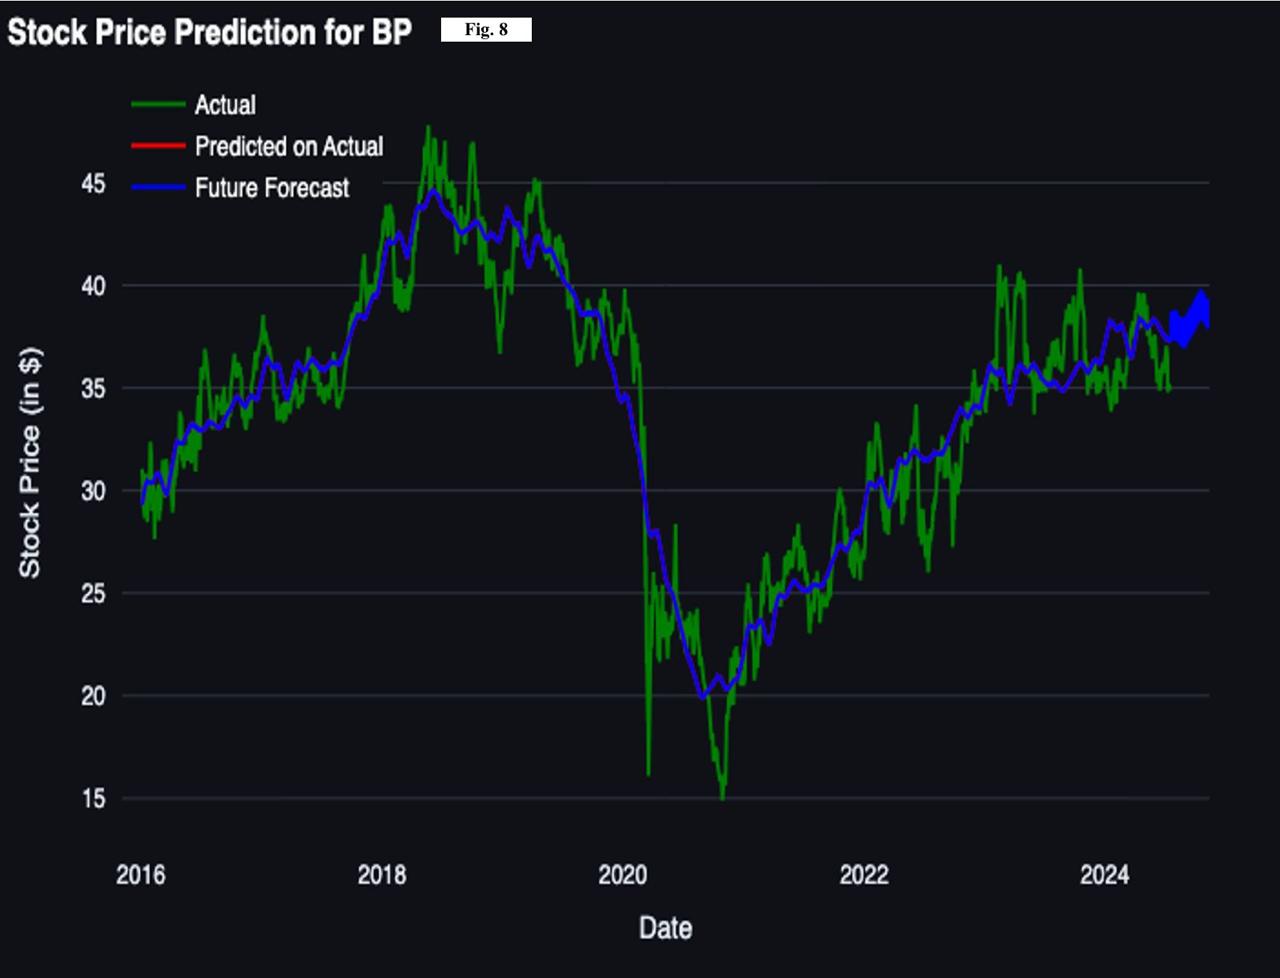 Figure 8
The analysis of the graph above suggests that the model is only able to predict the stock price of BP with limited accuracy. While the sentimental analysis allowed the ability to accurately predict the timing of the drastic fall in 2020, its magnitude is significantly understated. This indicates that the sentiment analysis likely assigned insufficient weight to the severity seen in Twitter posts regarding Covid-19’s impact, leading to an underestimation of the event's impact. As a result, the model placed relatively less emphasis on the magnitude of the drop, contributing to a high RMSE of 7.32, as the metric is significantly influenced by larger errors. Furthermore, the model does not get better as time progresses as we see that the model is not able to predict the trends accurately especially after 2020 where significant differences can be seen. This leads to an extremely high MAE of 6.12. Moreover, at the last, it’s as if the model lags: showing jig-saw patterns in future predictions. Initially thought to be a technical fault, we tested the model and made necessary improvements more than 15 times and the results remained the same. Thus, it is fair to conclude that the model is unable to predict historical and future price trends accurately enough. This calls for an improvement in the model, showcasing its inability to predict such fluctuations and attracts caution when utilizing such models to invest.
3) PARA
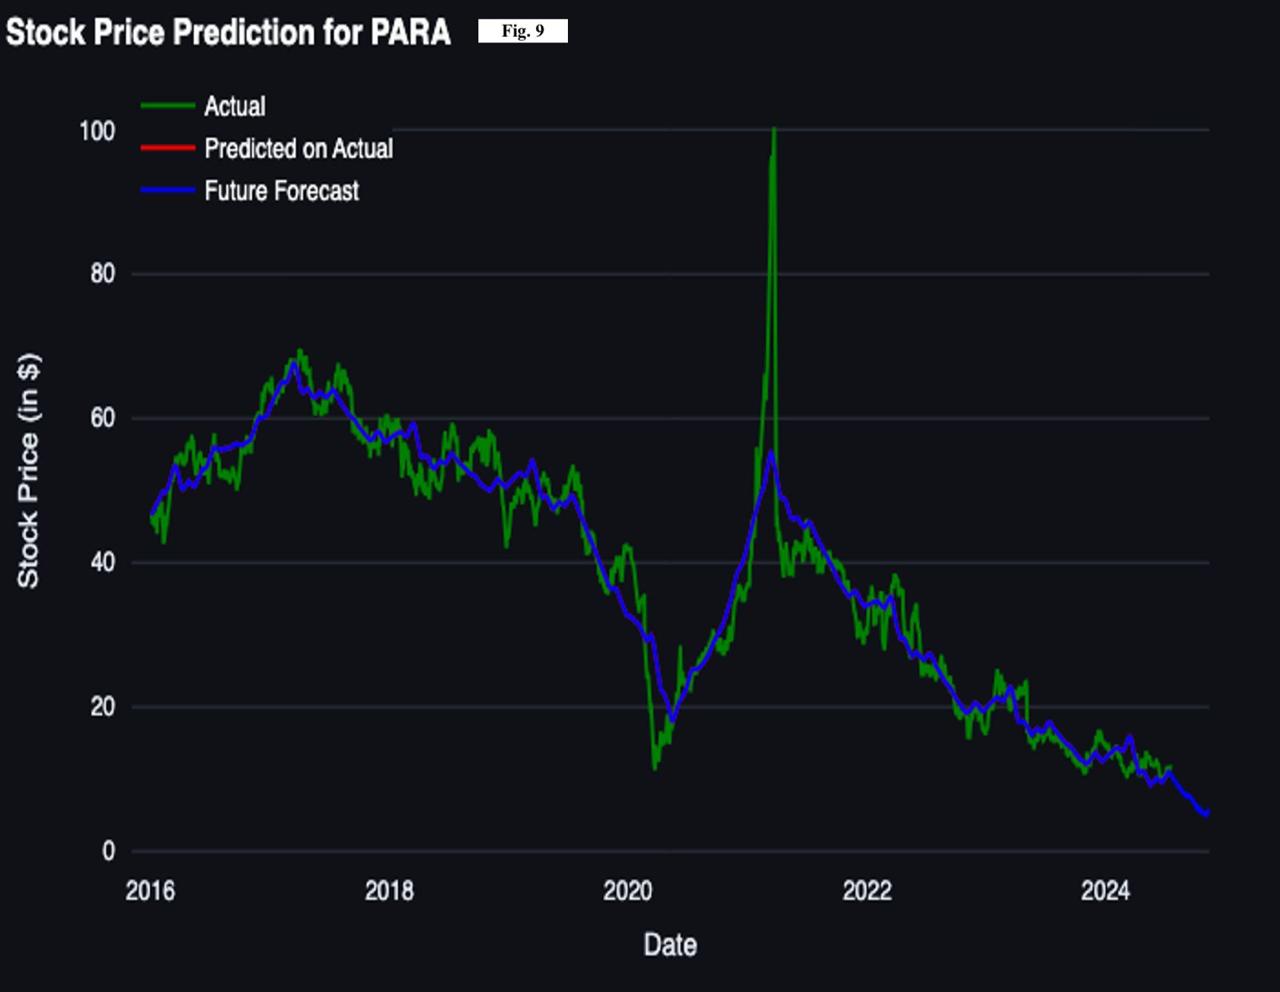 Figure 9
The graph above shows the stock prices along with the stock price predictions for PARA over time. There is a noticeable spike in the year 2021 and while its presence is predicted accurately by the model, its magnitude is severely understated. On the other hand, the RMSE value of 6.73 indicates that on average the predicted prices have an uncertainty of $6.73, which is lower than in APPLE’s case. This is because while the model does understate the price a few times, other than that it predicts the trend pretty accurately especially after 2022, this leads to a MAE of 4.98. The future prediction shows a downward trend in the future prices which the model predicts accurately.
To sum it up, while the model shows high performance in capturing general trends, it fails to account for sudden spikes in the market, possibly due to not fitting well with the integration of sentiment analysis. This results in underestimating the impact of abrupt market changes.
VI. INTRODUCTION TO NEURAL PROPHET
Neural Prophet is a prediction framework which is backed up by PyTorch and is the updated version of Facebook’s Prophet version. It uses a combination of time series models and the deep learning techniques to solve problems in predecessor models. This is done through the use of techniques like auto-regression and covariate modules.
The design of Neural Prophet enables clear understanding and incorporation of different components such as trends, seasonality and major events to further enhance the output of the model. This makes the model accessible for novice as well as experienced individuals. Pytorch further enables the model by keeping it updated with latest technologies and frameworks of deep learning
Existing models like ARIMA and Exponential Smoothing have been surpassed in terms of accuracy and technology by the Neural Prophet. The model provides high accuracy which ranges from 55% to 92%, depending upon the stock ticker which is being analysed. The hybrid approach of the model which includes user-friendliness as well as performance gives a leverage to Neural Prophet over other modules in the market, making it the perfect tool for investors to rely on and study the market effectively
A. Components Of Neural Prophet
1) Trend Component
The trend component for Neural Prophet takes account of the long-term progression of the time series. It can be described as a piecewise linear or logistic growth function:
T(t)=C1+e-k(t-t0) : for linear trend
T(t)=k(t-to)+b : for logistics growth trend
where:
• k is the growth rate.
• t0 is the change point in time.
• b is the offset parameter.
• C is the carrying capacity for logistic growth.
2) Seasonality Component
The seasonality component in the model underscores the periodic effects such as daily, weekly, or yearly cycles. It is typically modelled using Fourier series:
S(t)=n=1Nancos2πntP+bnsin2πntP
where:
• P is the duration of the seasonality
• N is the number of Fourier terms
• an and bn
 are the coefficients of the Fourier series.
3) Holidays Component
The holidays component models the effects of known repeating events such as holidays. It can be represented as:
H(t)=k=1Kδk⋅1t∈Hk
where:
• Hk is the set of dates for the k
 -th holiday.
• δk is the effect of the k
 -th holiday.
• 1t∈Hk is an indicator function.
4) Neural Network Component
The neural network component captures the non-linear and complex relationships in the data. A typical neural network component can be represented as:
Nt=fθ(Xt)
where:
• fθ is a neural network function parameterized by weights θ
 .
.
• Xt represents additional features or covariates at time .
This combined model leverages the strengths of both traditional time series decomposition methods and modern neural network approaches, providing a powerful tool for time series forecasting.
B. Application Of Neural Prophet In Stock Prediction
Neural Prophet integrates auto-regression and covariate modules that can be configured as classical linear regression or neural networks. This hybrid approach ensures both scalability and interpretability. The inclusion of local context through these modules addresses Prophet's limitations in near-term forecasting. Moreover, the integration with sentimental analysis only makes it stronger, expanding on it’s current base. Empirical results demonstrate that Neural Prophet outperforms Prophet on diverse real-world datasets, improving forecast accuracy by 55 to 92 percent. These features make Neural Prophet particularly effective for dynamic and complex financial time series like stock prices. In our analysis we have set the model to an epoch of 40.
C. Stock Predition Graphs By Neural Prophet
1) AAPL
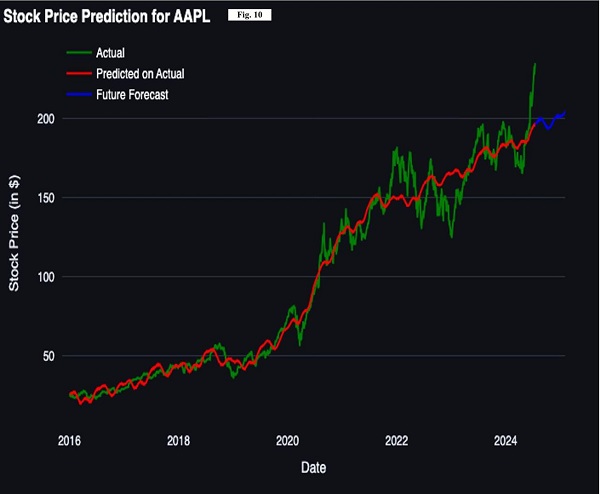
Figure 10
The figure above shows the stock price prediction for AAPL, with the red line representing historical predictions and the blue line indicating future forecasts using the Neural Prophet model. The red line closely tracks the actual stock prices (green line). Notably, during 2020, the red line matches the sharp rise in actual prices from around $50 to over $100, reflecting the model's accuracy in predicting significant market changes.
The blue line, indicating the future forecast shows AAPL's stock price stabilizing and then increasing. The predictions show a steady upward trend, which shows a positive future for AAPL’s stock price. As the graph for prediction of the actual graph aligns well with the actual graph, it can be deduced that the future forecast will therefore be highly accurate.
With an RMSE of 7.73 and MAE of 6.23, the model predicts the graph accurately. However, while the model performed accurately up until 2021, it struggled to maintain its predictive accuracy afterwards, which can be seen by the more frequent fluctuations. But, the integration of sentiment analysis has, both in theory and practically, improved the model's performance to a certain extent, which were even bigger before the integration.
2) BP
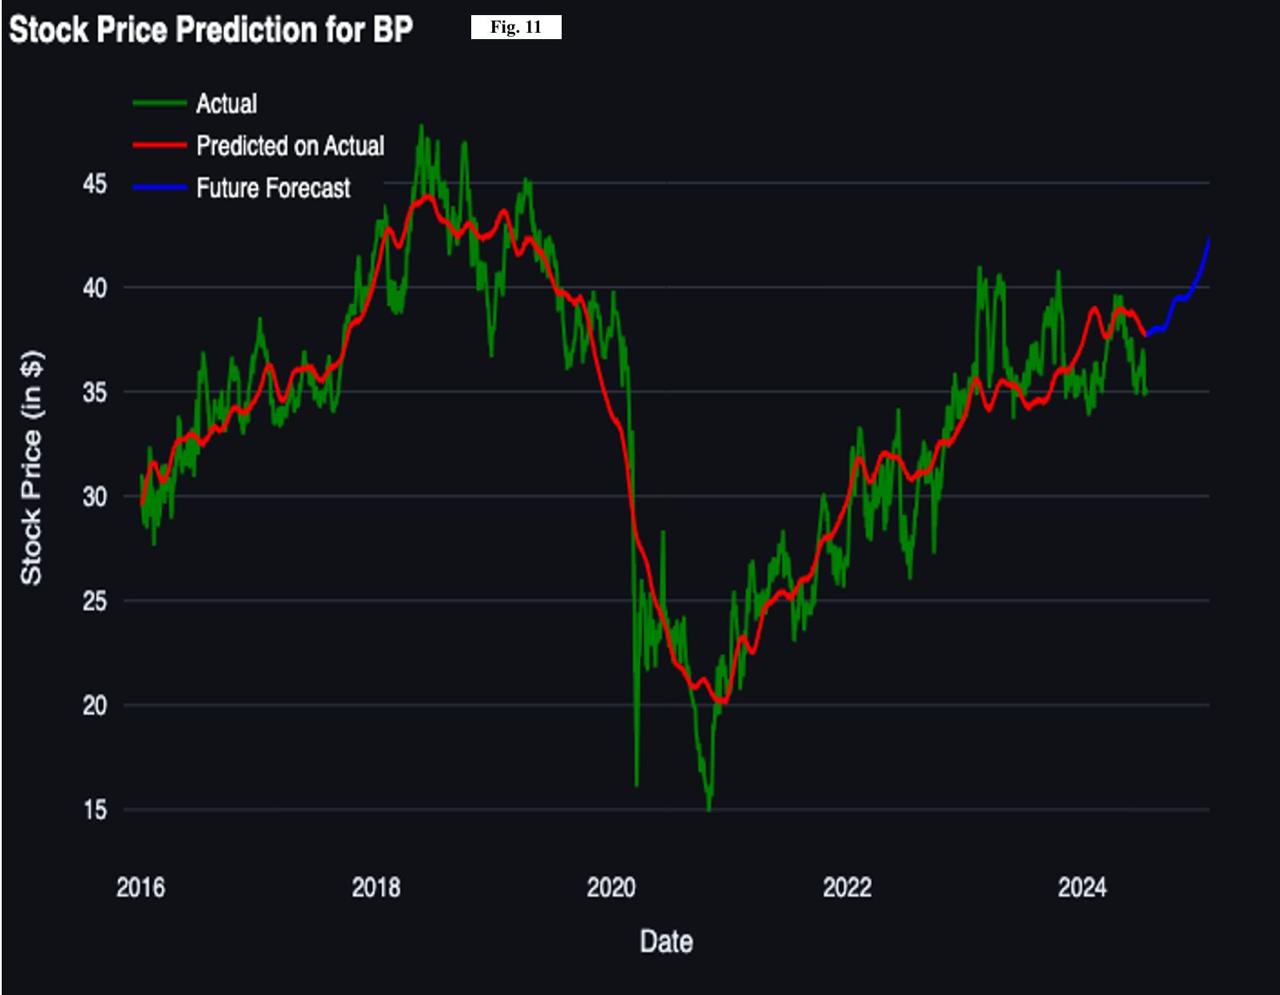 Figure 11
In the above graph, the red line depicts the predictions made by the model based on historical data and the green line depicts the actual movement of the stock price from 2016 to 2024.
In this period we can see that the predictions have a mediocre degree of accuracy as it tries to align with the actual price graph throughout the years. This is especially visible in the year 2020, when there was a steep downward slope of the graph, from $40 all the way to $20 and the model was unable to predict its magnitude. The future prediction of the model suggests a rise in the price of the stock by approximately $6 which is an increase of 16%. This prediction shows a positive future for BP’s stock. Moreover, despite not being highly accurate in short run prediction, the integration of sentimental analysis, as seen in the case of AAPL, has again improved the model’s performance to a certain extent. Lastly, the RMSE figure of 6.87 and MAE of 6.11 indicate the model's ability to predict stock prices a little more accurately than Facebook Prophet’s. (its predecessor)
3) PARA
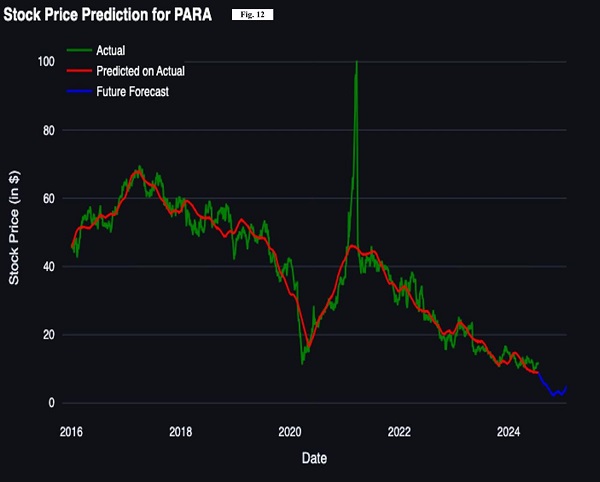
Figure 12
In the above graph of PARA(Paramount),the red line represents predictions based on historical data. While the model is fairly accurate in predicting the decline in 2020 on the basis of both timing and magnitude, the surge in 2021 is extremely understated. The deviation of almost 2x or $50 dollars is extremely gigantic. At this moment, the red line smooths over this volatility, indicating the model's limitations in capturing abrupt market changes.
The blue line, indicating future forecasts, shows a modest downward trend from early 2024. The model's future predictions imply cautious optimism. Moreover, the model's inability to fully capture abrupt fluctuations as shown by the 2020-2021 spike again suggests limitations in predicting unforeseen market events or rapid changes.
The RMSE of 6.28 is due to the biggest understatement of the significant 2021 surge. As it penalizes larger errors heavily, the RMSE figure is also high. On the other hand, the MAE figure is lower at 4.71 which supports the fact that otherwise, the graph is a little more accurate in predicting trends, especially in the long-term. However, this is lower than Facebook Prophet which showcases higher inaccuracy. Moreover, comparing it with LSTM, which does not predict pre-2023, we cannot make a comparison but because it has a better future prediction than LSTM, Neural Prophet beats both LSTM and Facebook Prophet.
VII. LIMITATIONS
While Twitter sentiment analysis has shown promise in improving stock market prediction accuracy, it is not without limitations. One significant issue is that while sentiment analysis can often predict the timing of market changes, it struggles to determine the magnitude of these changes.
This was particularly evident during the COVID-19 pandemic when Twitter sentiment detected an impending shift due to widespread news coverage and social media posts, but it could not predict the full scale of the market crash. This limitation means that while sentiment analysis is useful for signalling when a market shift might occur, it may not provide a reliable estimate of how severe the change will be.
Another challenge arises from changes in Twitter's platform itself. Since Elon Musk's acquisition of Twitter, the introduction of fees for accessing the Twitter API has made it financially difficult for many researchers and developers to integrate real-time sentiment data. Additionally, rumours of a potential user subscription fee could lead to a reduced number of active users, which would decrease the available data for sentiment analysis, thereby reducing its effectiveness. Moreover, Twitter's plan to uncensor the platform may lead to a rise in hate speech and misinformation, potentially causing increased short-term fluctuations in the market and making predictions more volatile and less reliable.
Twitter’s platform itself causes a challenge, Since Elon Musk took over Twitter, a fee was applied on the use of Twitter API which has made it financially difficult for users and researchers to conduct experiments and researches on data from Twitter. Furthermore, rumours of a possible joining fees for all users on Twitter can reduce the number of active users which further decreases the dataset the available data for sentiment analysis. Lastly, Twitter’s plan to uncensor the platform can cause an increased number of hatespeech and misinformation, causing increased short term fluctuations in the market and making Twitter Sentiment analysis ineffective and misleading.
Conclusion
Twitter sentiment analysis has shown an overall improvement in the accuracy of predictions when applied to stock prediction models, RMSE and MAE being an indication of the same. However, despite of improvements in reduced errors, LSTM has shown occasional distortions in the generated graphs which makes it less reliable when compared to other models. Furthermore, Facebook prophet has resulted in higher RMSE and MAE values when compared to Neural Prophet. Neural Prophet, however, has surpassed from LSTM and Facebook Prophet in terms of reliability and low RMSE/MAE values. There was a reduction of 25% in RMSE and 20% reduction in MAE values in Neural Prophet, making it the most optimal and best-performing model in this study. Neural Prophet’s outstanding results were further confirmed by its stable and consistent output which were better than LSTM and Facebook Prophet when compared in terms of graph generation and quantitative measures. However, through the results obtained in this research has proved that none of these models, even with Twitter Sentiment integration are superior. There is a need for further improvement to achieve a better predictive model which can accurately predict both timing and the scale of market fluctuations. To conclude, Neural Prophet comes out to be the most reliable model when integrated with Twitter’s Sentiment analysis. However, its associated limitations indicate that in future alternative data sources may be needed for future stock prediction models to maintain accuracy and relevance to the real world.
References
[1] Berk, Michael. “Prophet vs. Neuralprophet.” Medium, Towards Data Science, 15 Dec. 2021, towardsdatascience.com/prophet-vs-neuralprophet-fc717ab7a9d8. Accessed 22 July 2024. [2] Biswal, Avijeet. “Stock Market Prediction Using Machine Learning in 2024.” Simplilearn.Com, Simplilearn, 12 July 2024, www.simplilearn.com/tutorials/machine-learning-tutorial/stock-price-prediction-using-machine-learning. Accessed 27 July 2024. [3] Choudhary, Ankit. “Generate Quick and Accurate Time Series Forecasts Using Facebook’s Prophet (with Python & R Codes).” Analytics Vidhya, 23 June 2022, www.analyticsvidhya.com/blog/2018/05/generate-accurate-forecasts-facebook-prophet-python-r/. Accessed 27 June 2024. [4] GeeksforGeeks. “Time Series Analysis Using Facebook Prophet.” GeeksforGeeks, 31 Jan. 2024, www.geeksforgeeks.org/time-series-analysis-using-facebook-prophet/. Accessed 27 July 2024. [5] GeeksforGeeks. “What Is LSTM - Long Short Term Memory?” GeeksforGeeks, 10 June 2024, www.geeksforgeeks.org/deep-learning-introduction-to-long-short-term-memory/. Accessed 27 July 2024. [6] Li, Katherine (Yi). “Machine Learning for Stock Price Prediction.” Neptune.Ai, 20 Mar. 2024, neptune.ai/blog/predicting-stock-prices-using-machine-learning. Accessed 27 July 2024. [7] “Mean Absolute Error.” Mean Absolute Error - an Overview | ScienceDirect Topics, 2024, www.sciencedirect.com/topics/engineering/mean-absolute-error. Accessed 27 July 2024. [8] “Overview of the Neuralprophet Model#.” Overview of the NeuralProphet Model - NeuralProphet 1.0.0rc8 Documentation, neuralprophet.com/science-behind/model-overview.html. Accessed 24 July 2024. [9] Samal, Chirag. “Time Series Tutorial Using NeuralProphet.” Medium, Analytics Vidhya, 25 Feb. 2022, medium.com/analytics-vidhya/time-series-tutorial-using-neuralprophet-e918a1b437ed. Accessed 20 July 2024. [10] “Root Mean Square Error.” Root Mean Square Error - an Overview | ScienceDirect Topics, 24 July 2024, www.sciencedirect.com/topics/engineering/root-mean-square-error. Accessed 17 July 2024. [11] Yates, Tristan. “4 Ways to Predict Market Performance.” Investopedia, 2024, www.investopedia.com/articles/07/mean_reversion_martingale.asp. Accessed 27 July 2024.
Copyright
Copyright © 2024 Divyansh Koolwal, Shrey Bajiya, Radhika Dadhich. This is an open access article distributed under the Creative Commons Attribution License, which permits unrestricted use, distribution, and reproduction in any medium, provided the original work is properly cited.

Download Paper
Paper Id : IJRASET64561
Publish Date : 2024-10-13
ISSN : 2321-9653
Publisher Name : IJRASET
DOI Link : Click Here
 Submit Paper Online

