Ijraset Journal For Research in Applied Science and Engineering Technology
- Home / Ijraset
- On This Page
- Abstract
- Introduction
- Conclusion
- References
- Copyright
Investigation into the Factors Impacting the Hardness of Water
Authors: Yashita Goel
DOI Link: https://doi.org/10.22214/ijraset.2024.64040
Certificate: View Certificate
Abstract
To what extent does temperature impact the hardness of 10 ml of regular beach water at a maintained pH?
Introduction
I. INTRODUCTION
‘Hard’ water is water with a high mineral content in the form of ions, especially metals such as calcium and magnesium. While hard water may not be extremely dangerous for human consumption, it can pose a problem in industrial or even home applications. The metal ions in hard water can precipitate out and cause problems in conducting or storing vessels like pipes and tanks. This process, termed “scaling” can cause inefficiencies such as reduced flow rates and pressure drop increases in chemical processes which would need to be combated by energy-intensive solutions, which would result in largely increased energy costs. This can have a drastic long-term impact on industries and the environment as a whole. Many solutions to limit water hardness exist such as RO (Reverse Osmosis) filtration. However, this process is also extremely cost and energy-intensive. However, RO systems are not extremely sustainable due to their large water demand, the requirement for a high-pressure system, and the impact of the hard water on the RO membrane itself. As such, RO systems are not the most optimal solution to this problem.
Therefore, this paper aims to research an alternative energy-efficient, long-term solution to the problem. This investigation aims to investigate the relationship between temperature and water hardness in order to determine if increasing the temperature is an efficient method of mitigating the impacts of hard water on industrial equipment.
II. AIMS
For the investigation to be deemed successful a few parameters must be met.
- A clear relationship must be determined between the temperature of the solution and the concentration of Ca2+ ions present.
- This relationship must be represented through a mathematical equation that depicts the trend observed.
- If the desired relationship is not observed, then an alternative solution must be proposed to the given problem.
III. PLANNING
The study was well planned through an action plan (see appendix). The plan involves activities such as labs, research, ordering materials and more set by date.
IV. BACKGROUND INFORMATION
By heating hard water solid deposits of CaCO3 (Calcium Carbonate) can form. These solid deposits are called “scale” and has the potential to raise the costs (monetary and energy) of heating water, clog pipes, reduce the life of equipment, and lower the efficiency of electric and water heaters. There are two main types of hard water: temporary hard water, and permanent hard water.
A. Temporary Hard Water
Temporary hard water mainly consists of calcium (Ca2+) and bicarbonate (HCO3-) ions. By heating temporary hard water Bicarbonate ions will decompose into water (H2O), carbonate ions (CO32- ), and carbon dioxide (CO2). The produced CO32- ion then reacts with other ions in the solution and this leads to the formation of insoluble compounds, for example, CaCO3 and MgCO3.
Increasing the temperature of temporary hard water, with its resultant decomposition of the bicarbonate ion, signifies a shift in the equilibrium equation (shown below). The high temperature causes the equilibrium to shift to the left, causing precipitation of the initial reactants.
CaCO3(s)+CO2(aq)+H2O(l)?Ca2+(aq)+2HCO-3(aq)
CaCO3(s)?Ca2+(aq)+CO32-(aq)
K(sp)=2.8×10⁻⁹
The precipitation of the initial reactants leads to white scaling observed in boiling containers along with mineral deposit buildups in water pipes. These can possibly lead to inefficiency and even explosion by overheating. Since CaCO3 is relatively insoluble (as shown by its solubility constant of 2.8 x 10⁻⁹), it is not completely dissolved back into the water and can be extracted through separation techniques such as filtration. As such, this type of hard water is deemed ‘temporary’ as the ions can be displaced in the water and extracted easily.
B. Permanent Hard Water
In contrast, permanent hard water is composed of anions in high concentrations for example the sulfate ion SO42-. It’s regarded as permanent as in contrast to temporary hard water, it can’t be softened as easily as boiling and precipitating out mineral ions. However, it is still possible to soften permanent hard water. Soap scum seen in bathtubs is also caused by permanent hard water. The Ca and Mg cations in Permanent hard water react with soap to form insoluble compounds which are then deposited on the edges of the tub. The reason why soap does not form well and lather in hard water is also due to the reaction between cations in hard water and the soap itself.
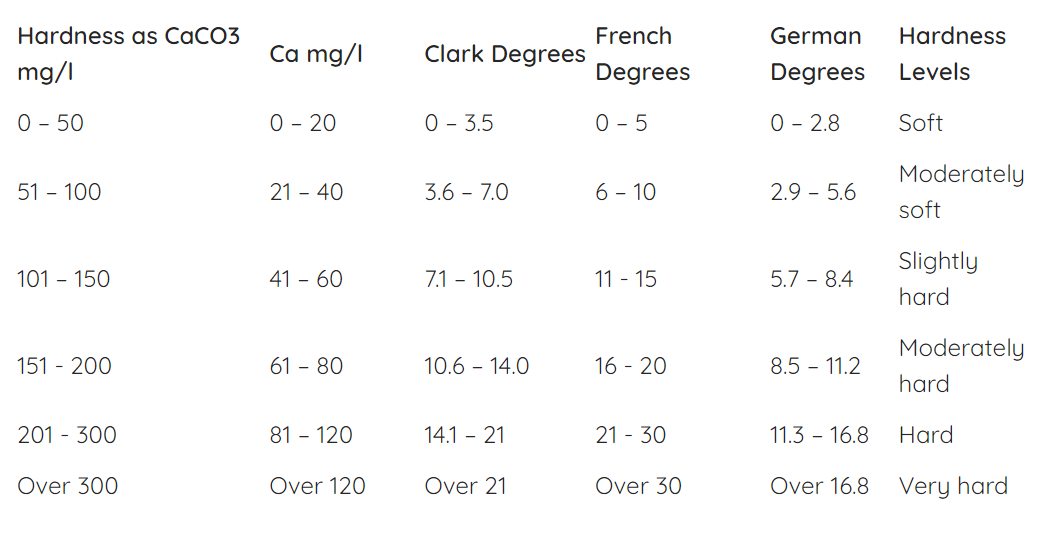
C. The Water Hardness Scale
D. Titration
Titration is a chemical procedure that aims to determine the concentration of a solution (called the analyte) by measuring an exact volume of the analyte and reacting it with the exact volume of another standard solution (the titrant). In titration, the point at which a suitable amount of titrant has been added to react exactly with the analyte is known as the endpoint or the equivalence point. This occurs when the moles of titrant and analyte are equal according to the balanced equation and are marked by a colour change. The equivalency point is the moment at which the reaction is concluded. The concentration of the analyte can be determined using the balanced chemical equation for the reaction, which takes into account the volume and concentration of the titrant at the equivalency point. In analytical chemistry, titration is a common method for figuring out how much acid, base, and other components are in a solution.
E. EDTA Titration/Complexometric Titration
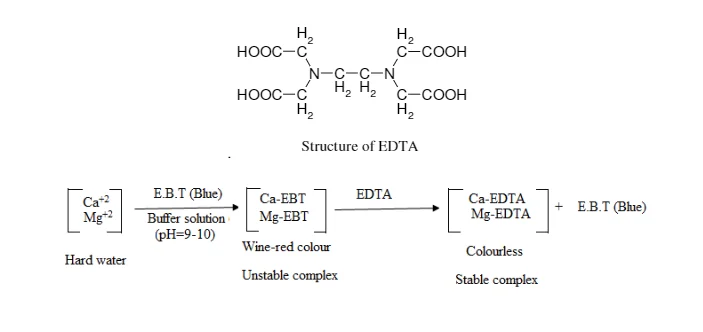
The quantitative analytical method known as complexometric titration forms stable complexes with a chelating agent, usually ethylenediaminetetraacetic acid (EDTA), to ascertain the concentration of metal ions in a solution. Until all of the metal ions have reacted, the complexing agent solution is gradually added to the sample solution containing the metal ions. The endpoint of the titration is indicated by an indicator, which often changes colour once all of the metal ions have formed complexes. The concentration of the metal ions in the sample solution can be precisely determined by measuring the volume and concentration of the complexing agent solution added and understanding the stoichiometry of the complex formation. In analytical chemistry, complexometric titration is widely used to measure the concentrations of different metal ions, offering important insights into the compositions of solutions and chemical reactions.
F. Wider Impact of the Study
As previously mentioned, the main impact of this study would be on industries. If the study confirms that increasing temperature can indeed reduce the Calcium Ion concentration, this method can be adapted to large-scale industries. By reducing the hardness of water and consequently mitigating scaling the lifespan of industrial equipment can be extended. Scaling can also increase energy consumption due to the reduced efficiency of heating systems. By mitigating the impacts of water hardness, energy can be saved on a large scale. This can also have additional benefits for the environment.
A further impact of this study would be the contribution towards developing less expensive and more energy-efficient methods for managing water hardness compared to traditional methods like Reverse osmosis treatment, which is costly, energy-intensive, and unsustainable in the long run. The study’s findings could lead to more sustainable water management practices in industries, contributing to the broader goal of environmental conservation and sustainability.
V. VARIABLES
Fig 1.1 Variable Table
|
|
Variable |
How is this variable being controlled/manipulated/measured? |
Why is it being controlled/ manipulated/measured? |
|
Measured Variable |
Water Hardness |
Water hardness will be measured in German degrees. German degrees are measured in the concentration of Mg2+ or Ca2+ ions (in ppm) relative to 10mg of CaCO3. |
German degrees are being used as they are an industrial form of measuring water hardness and the data collected in the form of German degrees will allow me to compare my readings to those of other secondary research. |
|
Independent Variable |
Temperature |
The temperature will be measured using a thermometer and maintained using a heating plate. |
As the temperature increases, consequently the Bicarbonate ions will decompose into water (H2O), carbonate ions (CO32-), and carbon dioxide (CO2). The higher the temperature, the more the reactants will decompose. |
|
Constant Variable |
Concentration of Mg2+ |
The concentration of Mg2+ Ions in the water sample will be controlled by precipitating all the ions in excess NaOH solution before conducting the titration and then filtering the precipitate white Mg(OH)2 out. |
If left in the solution, the Mg2+ ions will also react with the EDTA in the solution and increase the titre value. Precipitating the Mg2+ ions is necessary to ensure that they do not participate in the reaction. |
|
Buffer solution |
The buffer solution will be kept constant as NaOH of pH 10. 5ml will be used in every titration. |
NaOH will be used as it will maintain an optimal pH for the reaction. |
|
|
Concentration of EDTA |
The concentration of EDTA will be kept constant at 0.01mol/dm^3. The EDTA solution will be standardised in excess before performing the titration. |
The concentration of EDTA if fluctuating, will impact the calculations of the concentration of Ca2+ ions later in the investigation. To ensure reliability, it must be controlled. |
|
|
Concentration of Indicator |
The concentration of the indicator will be kept constant at 0.0001mol/dm^3 |
The concentration of the indicator must be controlled. If the concentration increases or decreases it will take more or less titrant to completely change the colour resulting in inaccurate readings. |
|
|
Water sample |
The water sample will be kept constant as seawater. It will be collected in excess and stored. |
Since seawater is being used, by collecting the sample on different days could change its composition due to natural phenomena. A change in the composition of the water will result in different readings obtained. |
VI. HYPOTHESIS
It can be predicted that as the temperature of the solution increases, the Ca2+ concentration will decrease with a relationship of negative correlation. This can also be seen through a decrease in the mean titre observed. This is because as the temperature increases the Bicarbonate ions (HCO3-), which make up the majority of water hardness, will decompose into water (H2O), carbonate ions (CO32- ), and carbon dioxide (CO2). The produced CO32- ion then reacts with other ions in the solution, this leads to the formation of insoluble compounds such as CaCO3 and MgCO3. This change will lead Ca2+ ions that were initially participating and contributing towards water hardness to become insoluble compounds and no longer contribute. These new compounds will not react with the EDTA titre used in the titration. This can also be seen in the reaction below:
CaCO3(s)+CO2(aq)+H2O(l)?Ca2+(aq)+2HCO3-(aq)
CaCO3(s)?Ca2+(aq)+CO32-(aq)
K(sp)=2.8×10⁻⁹
At higher temperatures, the equilibrium of this reaction shifts towards the left creating more insoluble products. CaCO3’s insolubility can be seen by the solubility constant.
VII. MATERIALS
Fig 2.1 Apparatus
|
Apparatus |
||
|
Name |
Capacity |
Units |
|
Heating Pad |
- |
1 |
|
Thermometer |
- |
1 |
|
Conical Flask |
250ml |
2 |
|
Filter paper |
- |
10 sheets |
|
Burette |
100ml |
1 |
|
stirrer |
- |
1 |
|
Beaker |
100ml |
3 |
|
Conical Flask |
750ml |
1 |
Fig 2.2 Chemicals
|
Chemical |
||
|
Name |
Concentration |
Amount |
|
EDTA |
0.01 mol/dm^3 |
500ml |
|
EDTA |
0.05 mol/dm^3 |
500ml |
|
NaOH |
0.1mol/dm^3 |
70ml |
|
Eriochrome black T (EBT) indicator |
0.01 mol/dm^3 |
30ml |
|
Hard Water |
- |
1L |
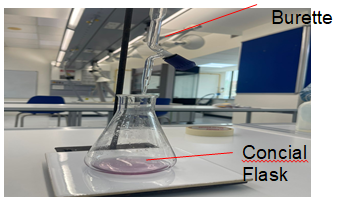
VIII. EXPERIMENTAL SETUP
IX. METHODOLOGY
A. Preparing Concentrations
1) Dissolving EDTA
- 1.4614g of EDTA powder is weighed on a weighing scale
- The EDTA powder is then added to a 250ml beaker along with distilled water.
- The beaker is placed on a magnetic stirrer and the stirrer is activated.
- NaOH pellets are then added to the beaker slowly while continuously checking the pH using pH paper until a pH of 8 is achieved. A pH of 8 is required to allow the solution to dissolve as EDTA is a nonpolar substance and cannot dissolve in water (which is polar).
- Once at a pH of 8, the powder must dissolve entirely to achieve a clear solution. Once this is observed it will be transferred into a 500ml volumetric flask and filled with water.
2) NaOH
- Calculate the amount of NaOH needed to achieve a pH of 10. Measure 0.04g of NaOH on a weighing scale
- Transfer to the beaker and dissolve in a minimal amount of water
- Once dissolved completely transfer to volumetric flask and fill with water.
B. Titration
- 10ml of hard water is added to a conical flask and then placed on a heating pad with a thermometer placed in the flask. The hard water is heated to 40*C. The conical flask is labelled ‘40’
- To precipitate the Mg ions in the solution 5ml of 0.1mol/dm^3 NaOH(aq) is added to form white Mg(OH)2(s).
- Formula: Mg(Aq)2++NaOH(aq)→Mg(OH)2(s)

- The white solid Mg(OH)2(s) is then filtered out.
- The burette is filled with a standard solution of EDTA.
- 3 drops of Eriochrome black T (EBT) indicator are added to the conical flask. A colour change to wine/purple is seen.
- EDTA is added from the burette to the conical flask until the indicator changes colour to pale blue, indicating that the endpoint has been reached.
- The volume of EDTA used is recorded.
- The water hardness in German degrees is then calculated
- The steps above are repeated with the different temperatures allocated (25*C, 55*C, 70*C)
C. Data
1) Observations
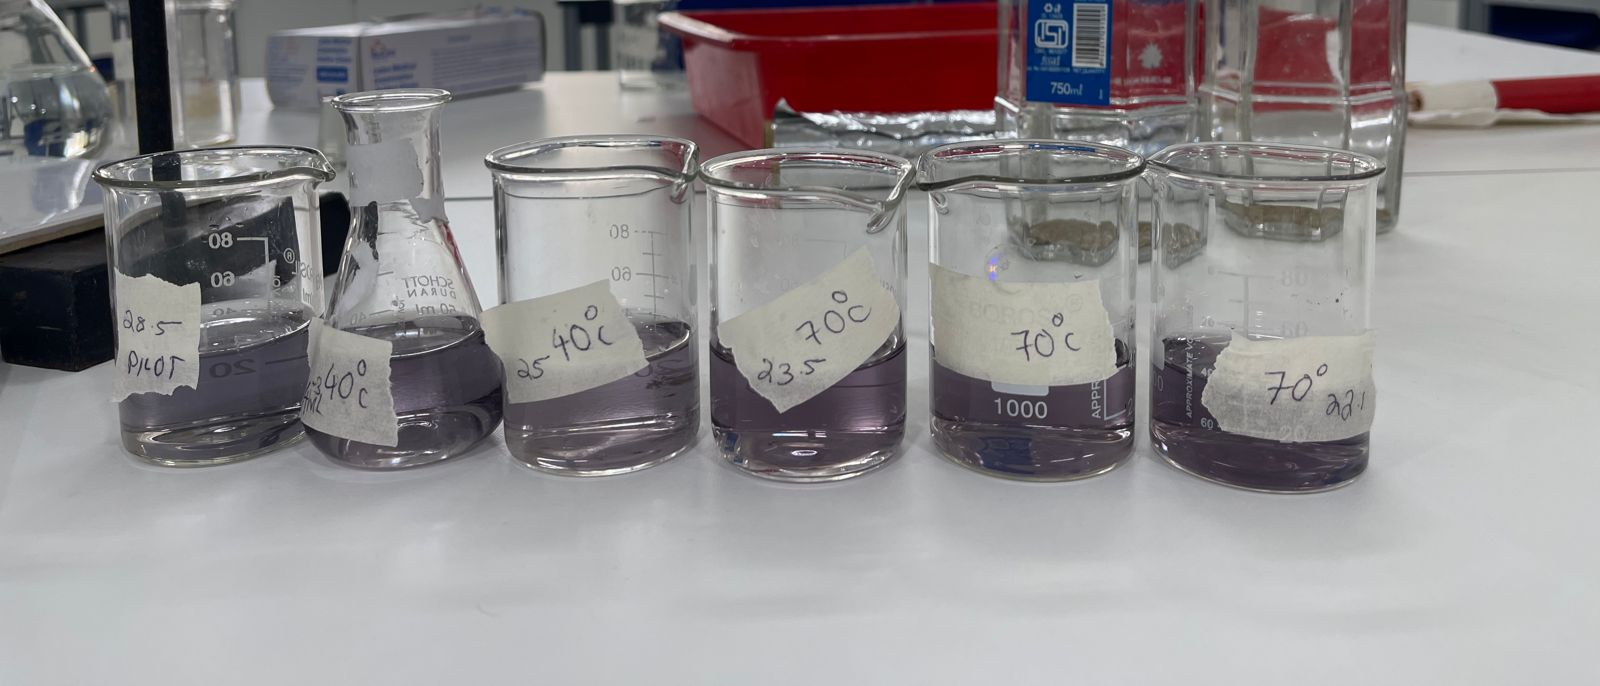
Fig 3.1 Raw Data Table
|
Temperature t/?C |
concentration of EDTA mol/dm3 |
volume of hard water ml |
Titre 1 ml |
Titre 2 ml |
Titre 3 ml |
Mean titre ml |
|
25 |
0.001 |
5 |
29.5 |
30.2 |
36.6 |
32.1 |
|
40 |
0.005 |
10 |
25 |
24.3 |
24.7 |
24.7 |
|
55 |
0.001 |
5 |
28.6 |
27.9 |
28.2 |
28.2 |
|
70 |
0.005 |
10 |
23.5 |
22.1 |
22.8 |
22.8 |
Fig 3.2 Processed Data Table
|
Temperature t/?C |
concentration of EDTA mol/dm3 |
volume of hard water in ml |
Mean titre/ml |
number of moles of Ca2+ n/mol |
Mass of Ca2+ mg |
Concentration of Ca2+ mg/L |
Water hardness degree (German) |
|
25 |
0.001 |
5 |
32.1 |
0.00003 |
1.284 |
256.80 |
Very Hard |
|
40 |
0.005 |
10 |
24.7 |
0.00012 |
4.940 |
494.00 |
Very Hard |
|
55 |
0.001 |
5 |
28.2 |
0.00003 |
1.129 |
225.87 |
Very Hard |
|
70 |
0.005 |
10 |
22.8 |
0.00011 |
4.560 |
456.00 |
Very Hard |
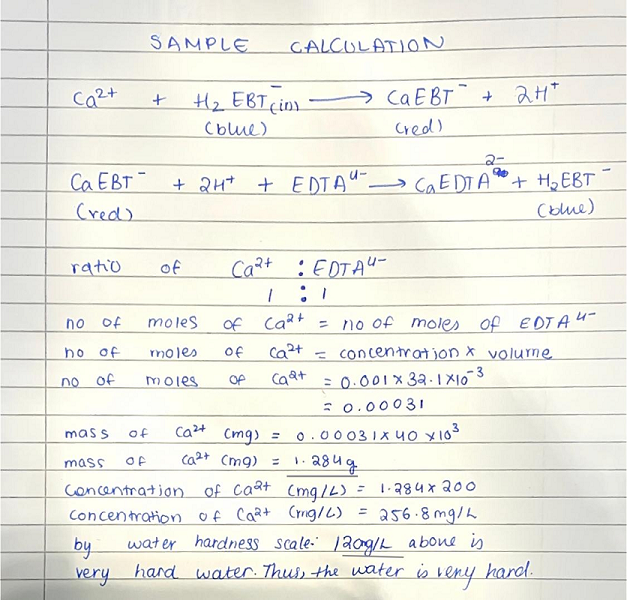
2) Sample Calculation:
3) Graph
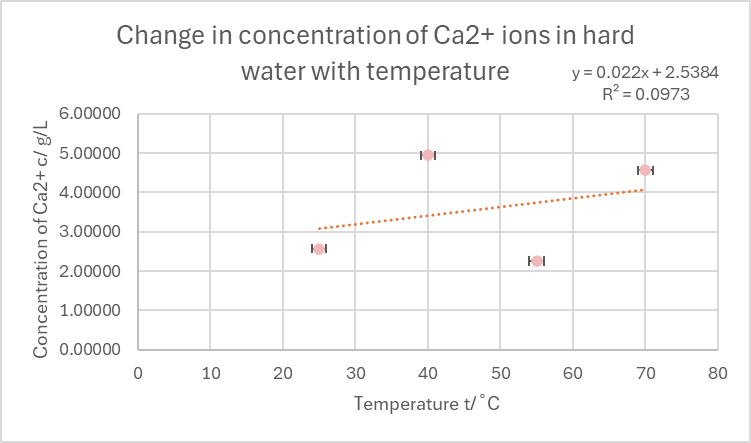
Fig 3.3 Graph - Change in concentration of Ca2+ions in hard water as temperature increases
X. ANALYSIS OF DATA
In the graph above, a rough relationship between the temperature and the concentration of Ca2+ can be seen. The points in the graph, when looked at as a whole, can be seen as having no correlation at all which is further proven by the low R^2 value and trendline that does not touch any of the data points. However, when further analysed it can be seen that trials conducted in the same concentrations of titre (refer to Fig 3.2) showcase a trend of negative correlation in which the Ca2+ Concentration decreases as the temperature increases. This is in line with the hypothesis which stated that:
It can be predicted that as the temperature of the solution increases, the Ca2+ concentration will decrease with a relationship of negative correlation. This can also be seen through a decrease in the mean titre observed.
Both the reduction of the mean titre and the decrease in Ca2+ concentration are evident in the processed data table for values with the same concentration of titre. The data agreeing with the hypothesis suggests that as the temperature of the hard water increases, Bicarbonate ions that contribute largely towards water hardness, decompose into carbonate ions, water and carbon dioxide. These further form insoluble calcium compounds like CaCO3 which then no longer contribute to the hardness of the water. However, qualitative observations such as the absence of any solid precipitate suggest that this process did not occur as CaCO3 being an insoluble compound should ideally have been a visible solid. In contrast, this can also be due to the fact that the volume of the hard water was extremely low.
Conclusion
In conclusion, the data collected aligns with the hypothesis with a certain degree of error. While the colour change seen in the titration was prominent, the data views major inconsistencies which can be caused by the changing concentration of the titre. The relationship observed in the data indicates a positive correlation, the exact relationship cannot be deduced from the data due to inconsistencies. Consequently, the data suggests that as the temperature of hard water increases, the hardness of the water decreases as the concentration of Ca2+ ions also decreases.
References
[1] https://w1.mtsu.edu/chemistry/chem2230/pdfs/Exp9A.pdf [2] https://www.mlsu.ac.in/econtents/2193_expriment%206.pdf [3] https://www.ccri.edu/chemistry/courses/chem_1100/wirkkala/labs/Calcium_Analysis_by%20EDTA_Titration.pdf [4] texts, Libre. “16.10: Water.” Chemistry LibreTexts, Libretexts, 3 Oct. 2023, chem.libretexts.org/Courses/Anoka-Ramsey_Community_ College/Introduction_to_Chemistry/16%3A_Environmental_Chemistry/16.10%3A_Water#:~:text=Waters%20containing%20Ca2%2B%20and,much%20dissolved%20mineral%20is%20present. [5] Texts, Libre. “Hard Water.” Chemistry LibreTexts, Libretexts, 30 June 2023, chem.libretexts.org/Bookshelv s/Inorganic_Chemistry/Su pplemental_Modules_and_Websites_(Inorganic_Chemistry)/Descriptive_Chemistry/Main_Group_Reactions/Hard_Water#:~:text=Hard%20water%20may%20also%20react,permanent%2C%20which%20are%20described%20below.\\
Copyright
Copyright © 2024 Yashita Goel. This is an open access article distributed under the Creative Commons Attribution License, which permits unrestricted use, distribution, and reproduction in any medium, provided the original work is properly cited.

Download Paper
Paper Id : IJRASET64040
Publish Date : 2024-08-21
ISSN : 2321-9653
Publisher Name : IJRASET
DOI Link : Click Here
 Submit Paper Online

